Personal Finance
How Do Americans Spend Their Money, By Generation?
Article/Editing:
var divElement = document.getElementById(‘viz1662032431066’); var vizElement = divElement.getElementsByTagName(‘object’)[0]; vizElement.style.width=’1200px’;vizElement.style.height=’1027px’; var scriptElement = document.createElement(‘script’); scriptElement.src = ‘https://public.tableau.com/javascripts/api/viz_v1.js’; vizElement.parentNode.insertBefore(scriptElement, vizElement);
Open the large interactive version here
Open the large interactive version here
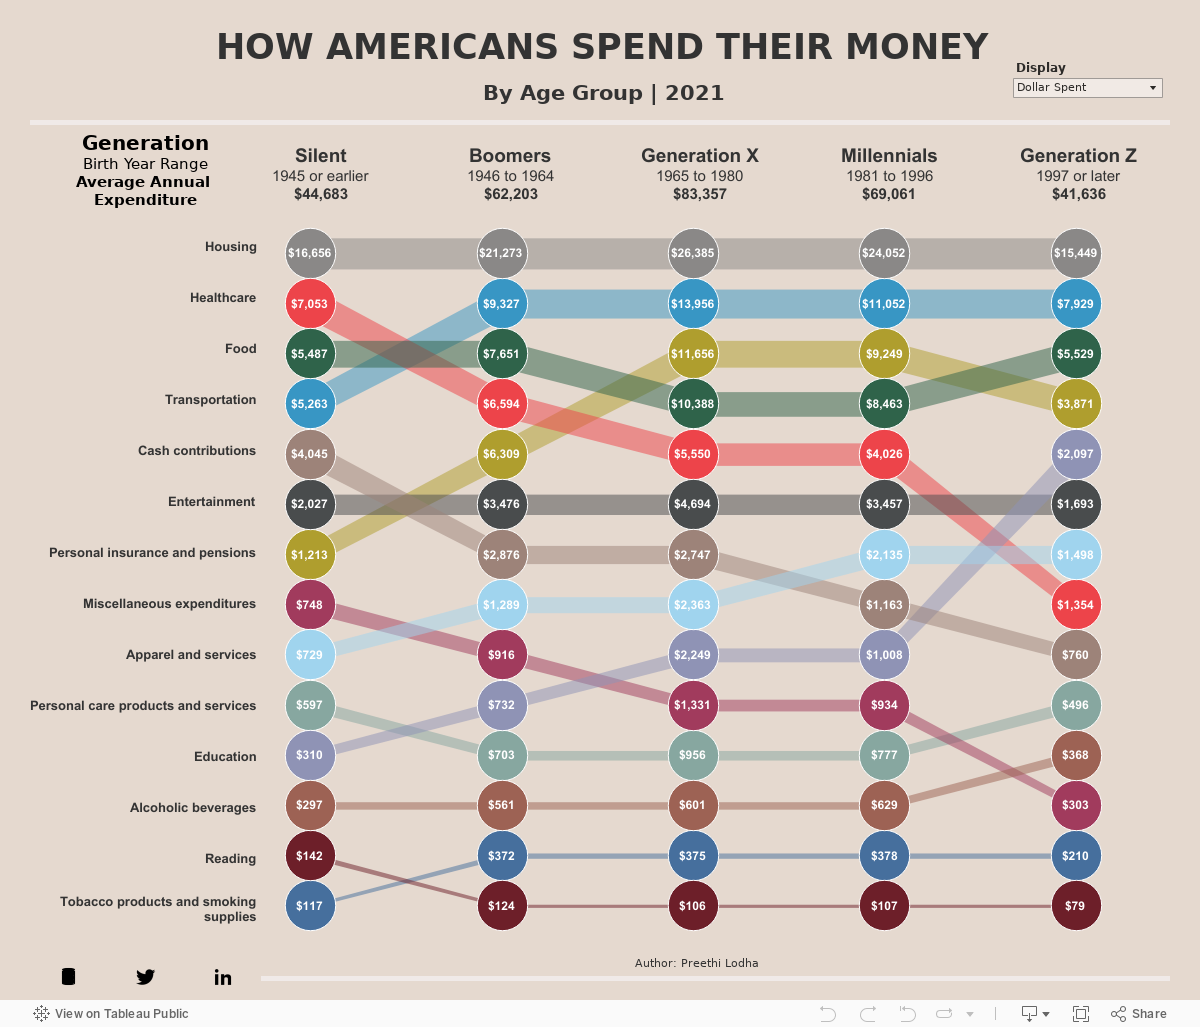
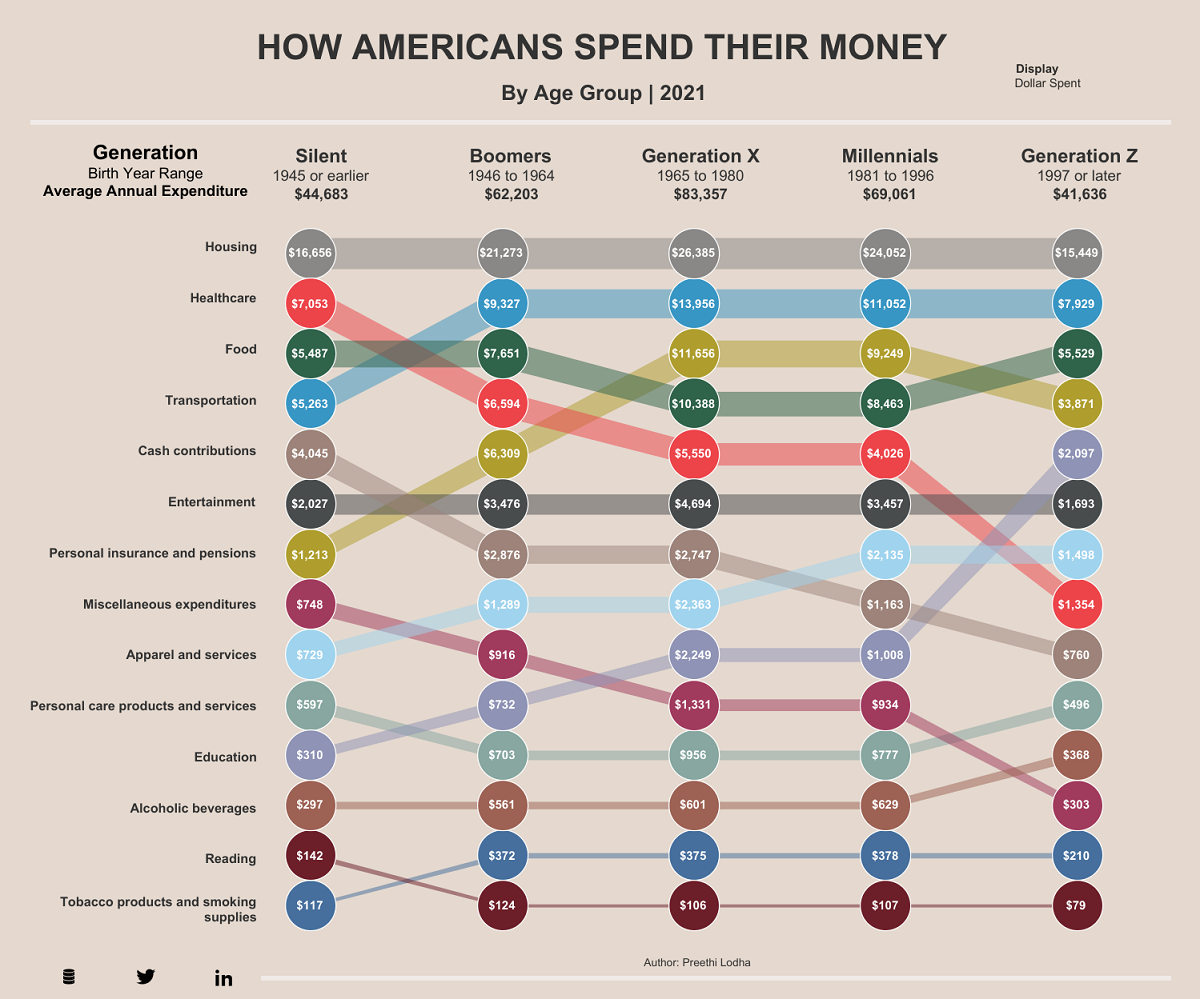
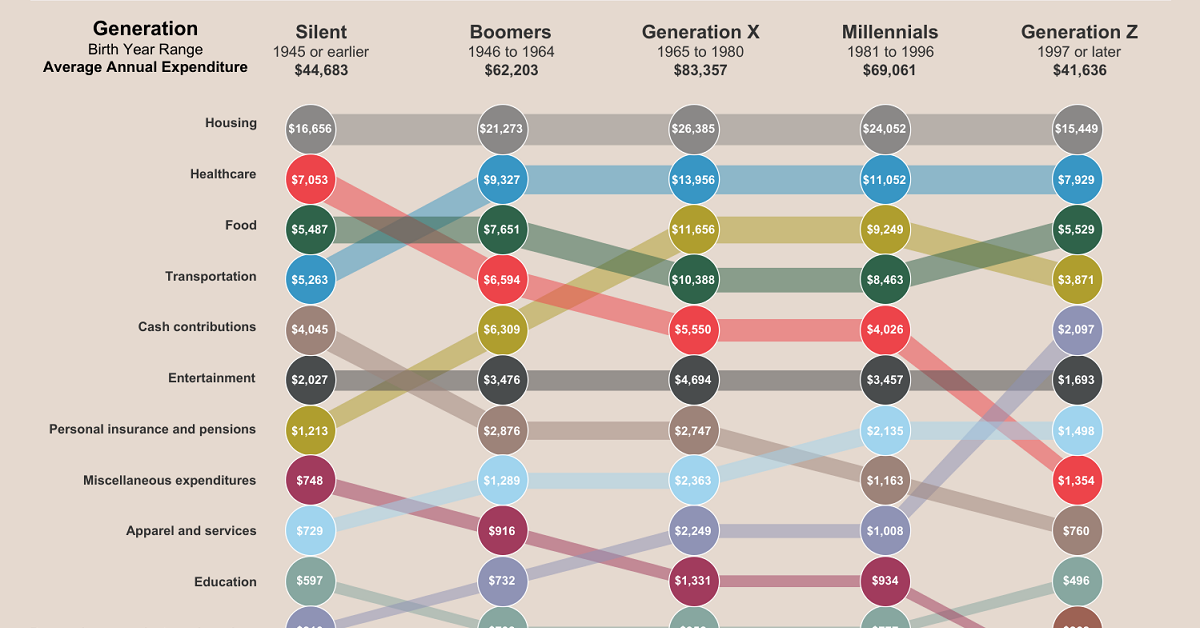
How Americans Spend Their Money, By Generation
In 2021, the average American spent just over $60,000 a year. But where does all their money go? Unsurprisingly, spending habits vary wildly depending on age.
This graphic by Preethi Lodha uses data from the U.S. Bureau of Labor Statistics to show how average Americans spend their money, and how annual expenses vary across generations.
A Generational Breakdown of Overall Spending
Overall in 2021, Gen X (anyone born from 1965 to 1980) spent the most money of any U.S. generation, with an average annual expenditure of $83,357.
| Generation | Birth Year Range | Average Annual Expenditure (2021) |
|---|---|---|
| Silent | 1945 or earlier | $44,683 |
| Boomers | 1946 to 1964 | $62,203 |
| Generation X | 1965 to 1980 | $83,357 |
| Millennials | 1981 to 1996 | $69,061 |
| Generation Z | 1997 or later | $41,636 |
Gen X has been nicknamed the “sandwich generation” because many members of this age group are financially supporting both their aging parents as well as children of their own.
The second biggest spenders are Millennials with an average annual expenditure of $69,061. Just like Gen X, this generation’s top three spending categories are housing, healthcare, and personal insurance.
On the opposite end of the spectrum, members of Generation Z are the lowest spenders with an average of $41,636. per year. Their spending habits are expected to ramp up, especially considering that in 2022 the oldest Gen Zers are just 25 and still early in their careers.
Similarities Across Generations
While spending habits vary depending on the age group, there are some categories that remain fairly consistent across the board.
One of the most consistent spending categories is housing—it’s by the far the biggest expense for all age groups, accounting for more than 30% of total annual spending for every generation.
| Generation | Average Spend on Housing (2021) | % of Total Spend |
|---|---|---|
| Silent (1945 or earlier) | $16,656 | 37.3% |
| Boomers (1946 to 1964) | $21,273 | 34.2% |
| Generation X (1965 to 1980) | $26,385 | 31.7% |
| Millennials (1981 to 1996) | $24,052 | 34.8% |
| Generation Z (1997 or later) | $15,449 | 37.1% |
Another spending category that’s surprisingly consistent across every generation is entertainment. All generations spent more than 4% of their total expenditures on entertainment, but none dedicated more than 5.6%.
| Generation | Average Spend on Entertainment (2021) | % of Total Spend |
|---|---|---|
| Silent (1945 or earlier) | $2,027 | 4.5% |
| Boomers (1946 to 1964) | $3,476 | 5.6% |
| Generation X (1965 to 1980) | $4,694 | 5.6% |
| Millennials (1981 to 1996) | $3,457 | 5.0% |
| Generation Z (1997 or later) | $1,693 | 4.1% |
Gen Zers spent the least on entertainment, which could boil down to the types of entertainment this generation typically enjoys. For instance, a study found that 51% of respondents aged 13-19 watch videos on Instagram on a weekly basis, while only 15% watch cable TV.
Differences Across Generations
One category that varies the most between generations and relative needs is spending on healthcare.
As the table below shows, the Silent Generation spent an average of $7,053 on healthcare, or 15.8% of their total average spend. Comparatively, Gen Z only spent $1,354 on average, or 3.3% of their total average spend.
| Generation | Average Spend on Healthcare (2021) | % of Total Spend |
|---|---|---|
| Silent (1945 or earlier) | $7,053 | 15.8% |
| Boomers (1946 to 1964) | $6,594 | 10.6% |
| Generation X (1965 to 1980) | $5,550 | 6.7% |
| Millennials (1981 to 1996) | $4,026 | 5.8% |
| Generation Z (1997 or later) | $1,354 | 3.3% |
However, while the younger generations typically spend less on healthcare, they’re also less likely to be insured—so those who do get sick could be left with a hefty bill.

This article was published as a part of Visual Capitalist's Creator Program, which features data-driven visuals from some of our favorite Creators around the world.


Personal Finance
Chart: The Declining Value of the U.S. Federal Minimum Wage
This graphic compares the nominal vs. inflation-adjusted value of the U.S. minimum wage, from 1940 to 2023.


The Declining Value of the U.S. Federal Minimum Wage
This was originally posted on our Voronoi app. Download the app for free on iOS or Android and discover incredible data-driven charts from a variety of trusted sources.
This graphic illustrates the history of the U.S. federal minimum wage using data compiled by Statista, in both nominal and real (inflation-adjusted) terms. The federal minimum wage was raised to $7.25 per hour in July 2009, where it has remained ever since.
Nominal vs. Real Value
The data we used to create this graphic can be found in the table below.
| Year | Nominal value ($/hour) | Real value ($/hour) |
|---|---|---|
| 1940 | 0.3 | 6.5 |
| 1945 | 0.4 | 6.82 |
| 1950 | 0.75 | 9.64 |
| 1955 | 0.75 | 8.52 |
| 1960 | 1 | 10.28 |
| 1965 | 1.25 | 12.08 |
| 1970 | 1.6 | 12.61 |
| 1975 | 2.1 | 12.04 |
| 1980 | 3.1 | 11.61 |
| 1985 | 3.35 | 9.51 |
| 1990 | 3.8 | 8.94 |
| 1995 | 4.25 | 8.49 |
| 2000 | 5.15 | 9.12 |
| 2005 | 5.15 | 8.03 |
| 2010 | 7.25 | 10.09 |
| 2015 | 7.25 | 9.3 |
| 2018 | 7.25 | 8.78 |
| 2019 | 7.25 | 8.61 |
| 2020 | 7.25 | 8.58 |
| 2021 | 7.25 | 8.24 |
| 2022 | 7.25 | 7.61 |
| 2023 | 7.25 | 7.25 |
What our graphic shows is how inflation has eroded the real value of the U.S. minimum wage over time, despite nominal increases.
For instance, consider the year 1960, when the federal minimum wage was $1 per hour. After accounting for inflation, this would be worth around $10.28 today!
The two lines converge at 2023 because the nominal and real value are identical in present day terms.
Many States Have Their Own Minimum Wage
According to the National Conference of State Legislatures (NCSL), 30 states and Washington, D.C. have implemented a minimum wage that is higher than $7.25.
The following states have adopted the federal minimum: Georgia, Idaho, Indiana, Iowa, Kansas, Kentucky, New Hampshire, North Carolina, North Dakota, Oklahoma, Pennsylvania, Texas, Utah, Wisconsin, and Wyoming.
Meanwhile, the states of Alabama, Louisiana, Mississippi, South Carolina, and Tennessee have no wage minimums, but have to follow the federal minimum.
How Does the U.S. Minimum Wage Rank Globally?
If you found this topic interesting, check out Mapped: Minimum Wage Around the World to see which countries have the highest minimum wage in monthly terms, as of January 2023.

-

 Markets1 week ago
Ranked: The Largest U.S. Corporations by Number of Employees
-

 Green3 weeks ago
Ranked: Top Countries by Total Forest Loss Since 2001
-

 Money2 weeks ago
Where Does One U.S. Tax Dollar Go?
-

 Automotive2 weeks ago
Almost Every EV Stock is Down After Q1 2024
-

 AI2 weeks ago
The Stock Performance of U.S. Chipmakers So Far in 2024
-

 Markets2 weeks ago
Charted: Big Four Market Share by S&P 500 Audits
-

 Real Estate2 weeks ago
Ranked: The Most Valuable Housing Markets in America
-

 Money2 weeks ago
Which States Have the Highest Minimum Wage in America?