Misc
Visualizing Two Decades of Reported Hate Crimes in the U.S.
Article/Editing:
var divElement = document.getElementById(‘viz1657269922717’); var vizElement = divElement.getElementsByTagName(‘object’)[0]; vizElement.style.width=’1200px’;vizElement.style.height=’1107px’; var scriptElement = document.createElement(‘script’); scriptElement.src = ‘https://public.tableau.com/javascripts/api/viz_v1.js’; vizElement.parentNode.insertBefore(scriptElement, vizElement);
Open the large interactive version here
Open the large interactive version here
Visualizing Two Decades of Reported Hate Crimes in the U.S.
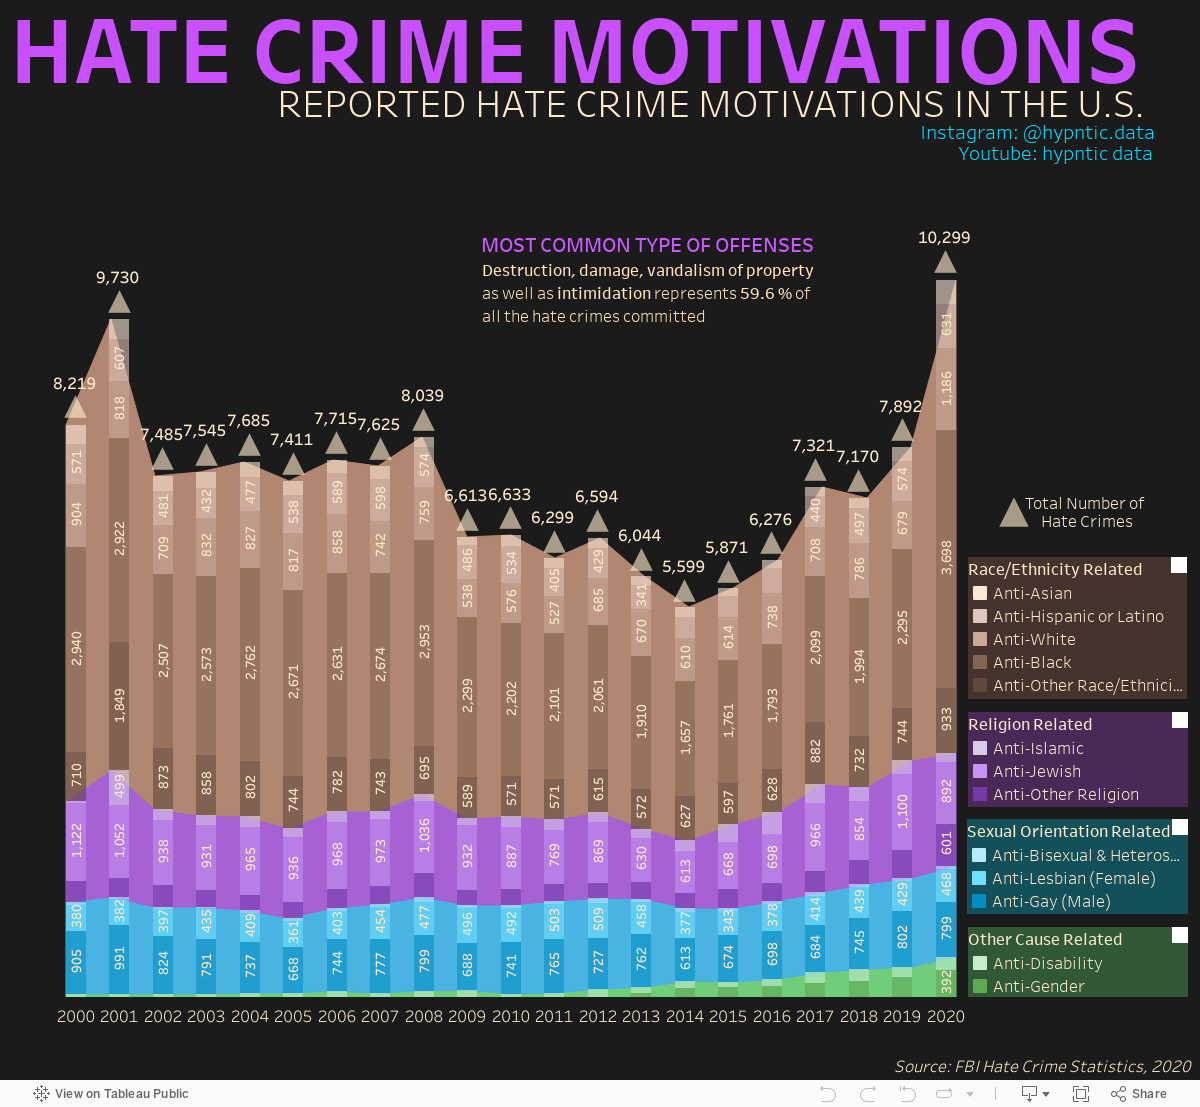
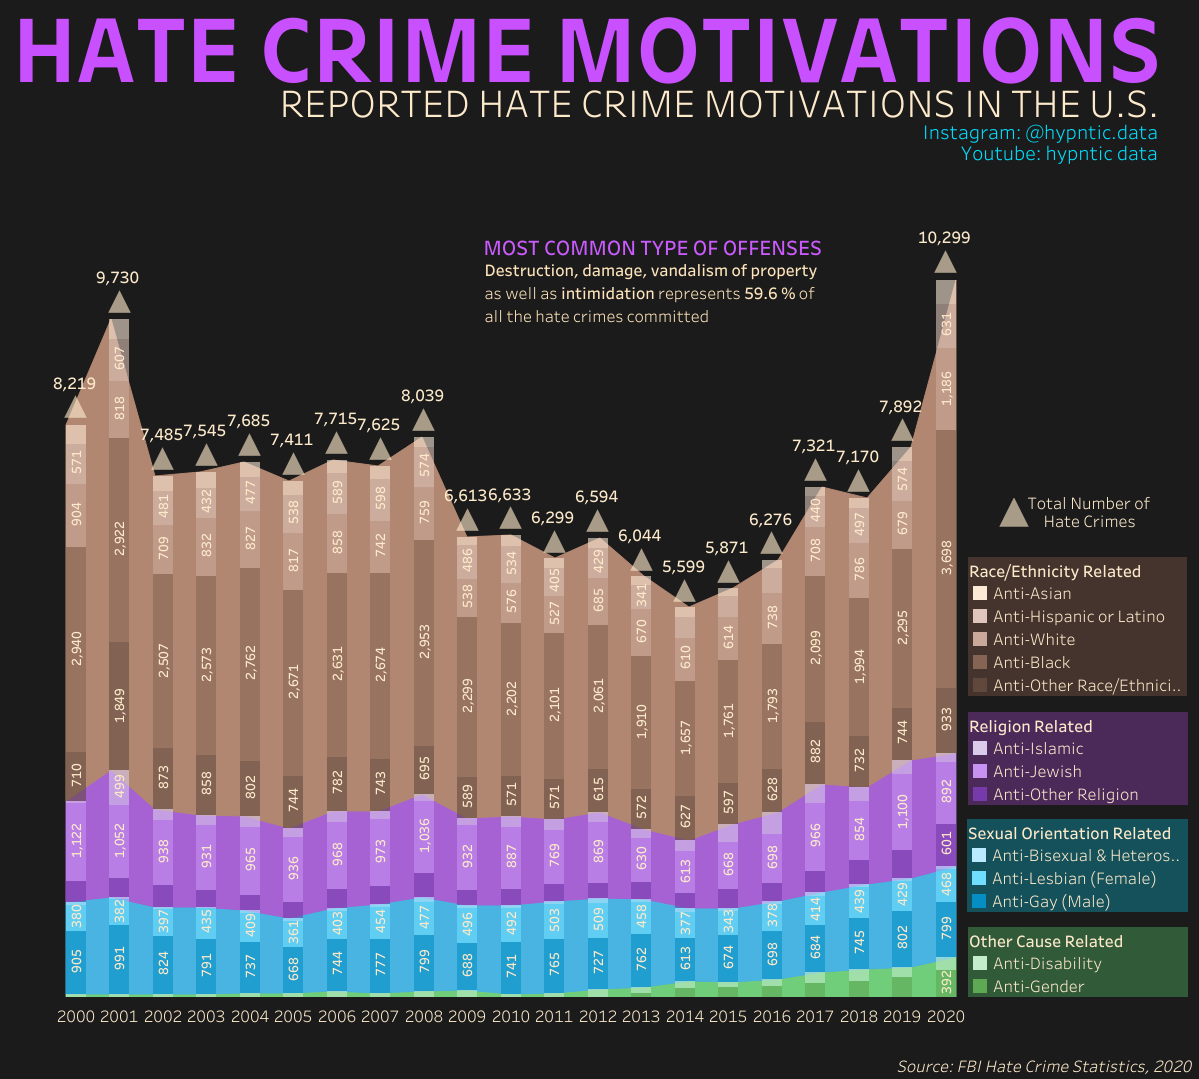
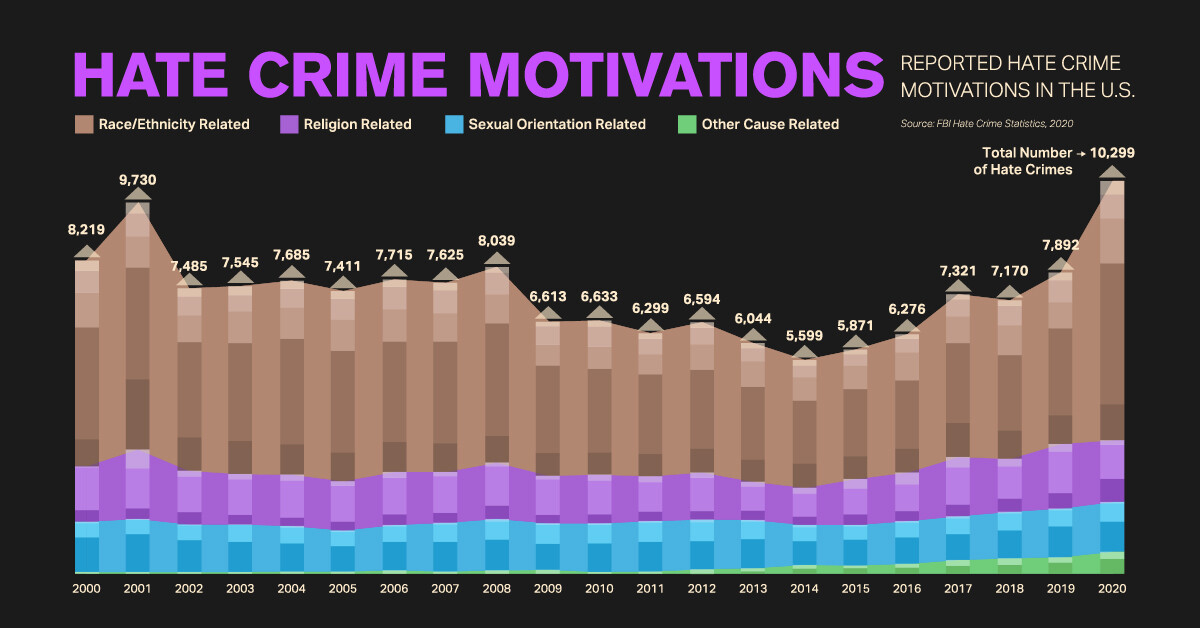
Across the U.S., thousands of hate crimes are committed each year, with many different motivating biases.
In 2020 alone, more than 10,000 unique hate crime incidents were reported to the Federal Bureau of Investigation (FBI)—and it’s likely that thousands more were committed that didn’t get reported to law enforcement.
What are the most commonly reported motivating biases, and how have hate crime rates evolved over the years? This graphic uses data from the FBI to visualize two decades of reported hate crime incidents across America.
What is Considered a Hate Crime?
Before diving in, it’s important to determine what constitutes a hate crime.
According to the U.S. Department of Justice, a hate crime is a crime that’s “committed on the basis of the victim’s perceived or actual race, color, religion, national origin, sexual orientation, gender, gender identity, or disability.”
These types of crimes are a threat to society, as they have a broader impact on communities than other types of crimes do. This is because hate crimes can foster fear and intimidate large groups of people or marginalized communities, making them feel unwelcome, unsafe, or othered.
Hate Crimes on the Rise
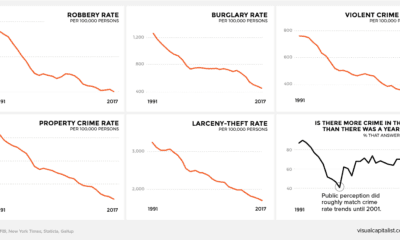
Hate crimes have been rising across the U.S. in nearly every year since 2014. By 2020, reported crimes across America reached record-level highs not seen in over two decades.
| Year | Number of Reported Incidents | % Change (y-o-y) |
|---|---|---|
| 2001 | 9730 | 18.4% |
| 2002 | 7485 | -23.1% |
| 2003 | 7545 | 0.8% |
| 2004 | 7685 | 1.9% |
| 2005 | 7411 | -3.6% |
| 2006 | 7715 | 4.1% |
| 2007 | 7625 | -1.2% |
| 2008 | 8039 | 5.4% |
| 2009 | 6613 | -17.7% |
| 2010 | 6633 | 0.3% |
| 2011 | 6299 | -5.0% |
| 2012 | 6594 | 4.7% |
| 2013 | 6044 | -8.3% |
| 2014 | 5599 | -7.4% |
| 2015 | 5871 | 4.9% |
| 2016 | 6276 | 6.9% |
| 2017 | 7321 | 16.7% |
| 2018 | 7170 | -2.1% |
| 2019 | 7892 | 10.1% |
| 2020 | 10299 | 30.5% |
And sadly, these figures are likely a vast undercount. Law enforcement submit this data to the FBI of their own volition, and in 2020, thousands of agencies did not submit their crime statistics.
Race-Related Hate Crimes are Most Common
Historically, the most reported hate crimes in the U.S. are related to race. In 2020, about 66% of incidents were motivated by discrimination against the victim’s race or ethnicity.
| Type of Bias | Total Number of Crimes (2020) | % of Total |
|---|---|---|
| Race/Ethnicity | 6793 | 66.0% |
| Religion | 1626 | 15.8% |
| Sexual Orientation | 1311 | 12.7% |
| Other | 569 | 5.5% |
| Total | 10299 | -- |
While race is the most commonly reported hate crime, incidents related to gender and gender identity are on the rise—in 2020, there was a 9% increase in gender-related incidents, and a 34% increase in gender identity-related incidents, compared to 2019 figures.

This article was published as a part of Visual Capitalist's Creator Program, which features data-driven visuals from some of our favorite Creators around the world.


Misc
How Hard Is It to Get Into an Ivy League School?
We detail the admission rates and average annual cost for Ivy League schools, as well as the median SAT scores required to be accepted.


How Hard Is It to Get Into an Ivy League School?
This was originally posted on our Voronoi app. Download the app for free on iOS or Android and discover incredible data-driven charts from a variety of trusted sources.
Ivy League institutions are renowned worldwide for their academic excellence and long-standing traditions. But how hard is it to get into one of the top universities in the U.S.?
In this graphic, we detail the admission rates and average annual cost for Ivy League schools, as well as the median SAT scores required to be accepted. The data comes from the National Center for Education Statistics and was compiled by 24/7 Wall St.
Note that “average annual cost” represents the net price a student pays after subtracting the average value of grants and/or scholarships received.
Harvard is the Most Selective
The SAT is a standardized test commonly used for college admissions in the United States. It’s taken by high school juniors and seniors to assess their readiness for college-level academic work.
When comparing SAT scores, Harvard and Dartmouth are among the most challenging universities to gain admission to. The median SAT scores for their students are 760 for reading and writing and 790 for math. Still, Harvard has half the admission rate (3.2%) compared to Dartmouth (6.4%).
| School | Admission rate (%) | SAT Score: Reading & Writing | SAT Score: Math | Avg Annual Cost* |
|---|---|---|---|---|
| Harvard University | 3.2 | 760 | 790 | $13,259 |
| Columbia University | 3.9 | 750 | 780 | $12,836 |
| Yale University | 4.6 | 760 | 780 | $16,341 |
| Brown University | 5.1 | 760 | 780 | $26,308 |
| Princeton University | 5.7 | 760 | 780 | $11,080 |
| Dartmouth College | 6.4 | 760 | 790 | $33,023 |
| University of Pennsylvania | 6.5 | 750 | 790 | $14,851 |
| Cornell University | 7.5 | 750 | 780 | $29,011 |
*Costs after receiving federal financial aid.
Additionally, Dartmouth has the highest average annual cost at $33,000. Princeton has the lowest at $11,100.
While student debt has surged in the United States in recent years, hitting $1.73 trillion in 2023, the worth of obtaining a degree from any of the schools listed surpasses mere academics. This is evidenced by the substantial incomes earned by former students.
Harvard grads, for example, have the highest average starting salary in the country, at $91,700.

-

 Real Estate2 weeks ago
Visualizing America’s Shortage of Affordable Homes
-

 Technology1 week ago
Ranked: Semiconductor Companies by Industry Revenue Share
-

 Money1 week ago
Which States Have the Highest Minimum Wage in America?
-

 Real Estate1 week ago
Ranked: The Most Valuable Housing Markets in America
-

 Business1 week ago
Charted: Big Four Market Share by S&P 500 Audits
-

 AI2 weeks ago
The Stock Performance of U.S. Chipmakers So Far in 2024
-

 Misc2 weeks ago
Almost Every EV Stock is Down After Q1 2024
-

 Money2 weeks ago
Where Does One U.S. Tax Dollar Go?