Demographics
Mapped: The Geography of Global Literacy
Article/Editing:
Mapped: The Geography of Global Literacy
Literacy is a fundamental building block that can lead to a strong education, the ability to solve complex problems, and gaining the skills and knowledge to participate meaningfully in society. As a result, it’s also an important facilitator of economic development.
However, it’s estimated that nearly 800 million adults around the world still lack basic literacy skills—and this can create ongoing drag on the economy.
In the U.S., as one example, the people with the lowest literacy scores are 16.5x more likely to receive financial aid from the government. At the same time, they are also more likely to be in the lowest earning wage group, earning less than $300 per week.
Today’s post uses charts from Our World in Data, and it shows what literacy looks like on a global scale, and how is it shifting from generation to generation.
Global Literacy: The Big Picture
Over the past two centuries, global literacy has seen steady growth.
In the year 1800, it’s estimated that a mere 12.1% of the world was able to read and write. The most recent data shows the numbers have actually flipped—and now just 13.8% of the global population is illiterate.
It’s clear that from a high level, progress towards global literacy is being made.
But at the same time, a look at the graph shows that in more recent years, the rate of change has been slowing as we reach the “last mile” of literacy.
The Generational Perspective
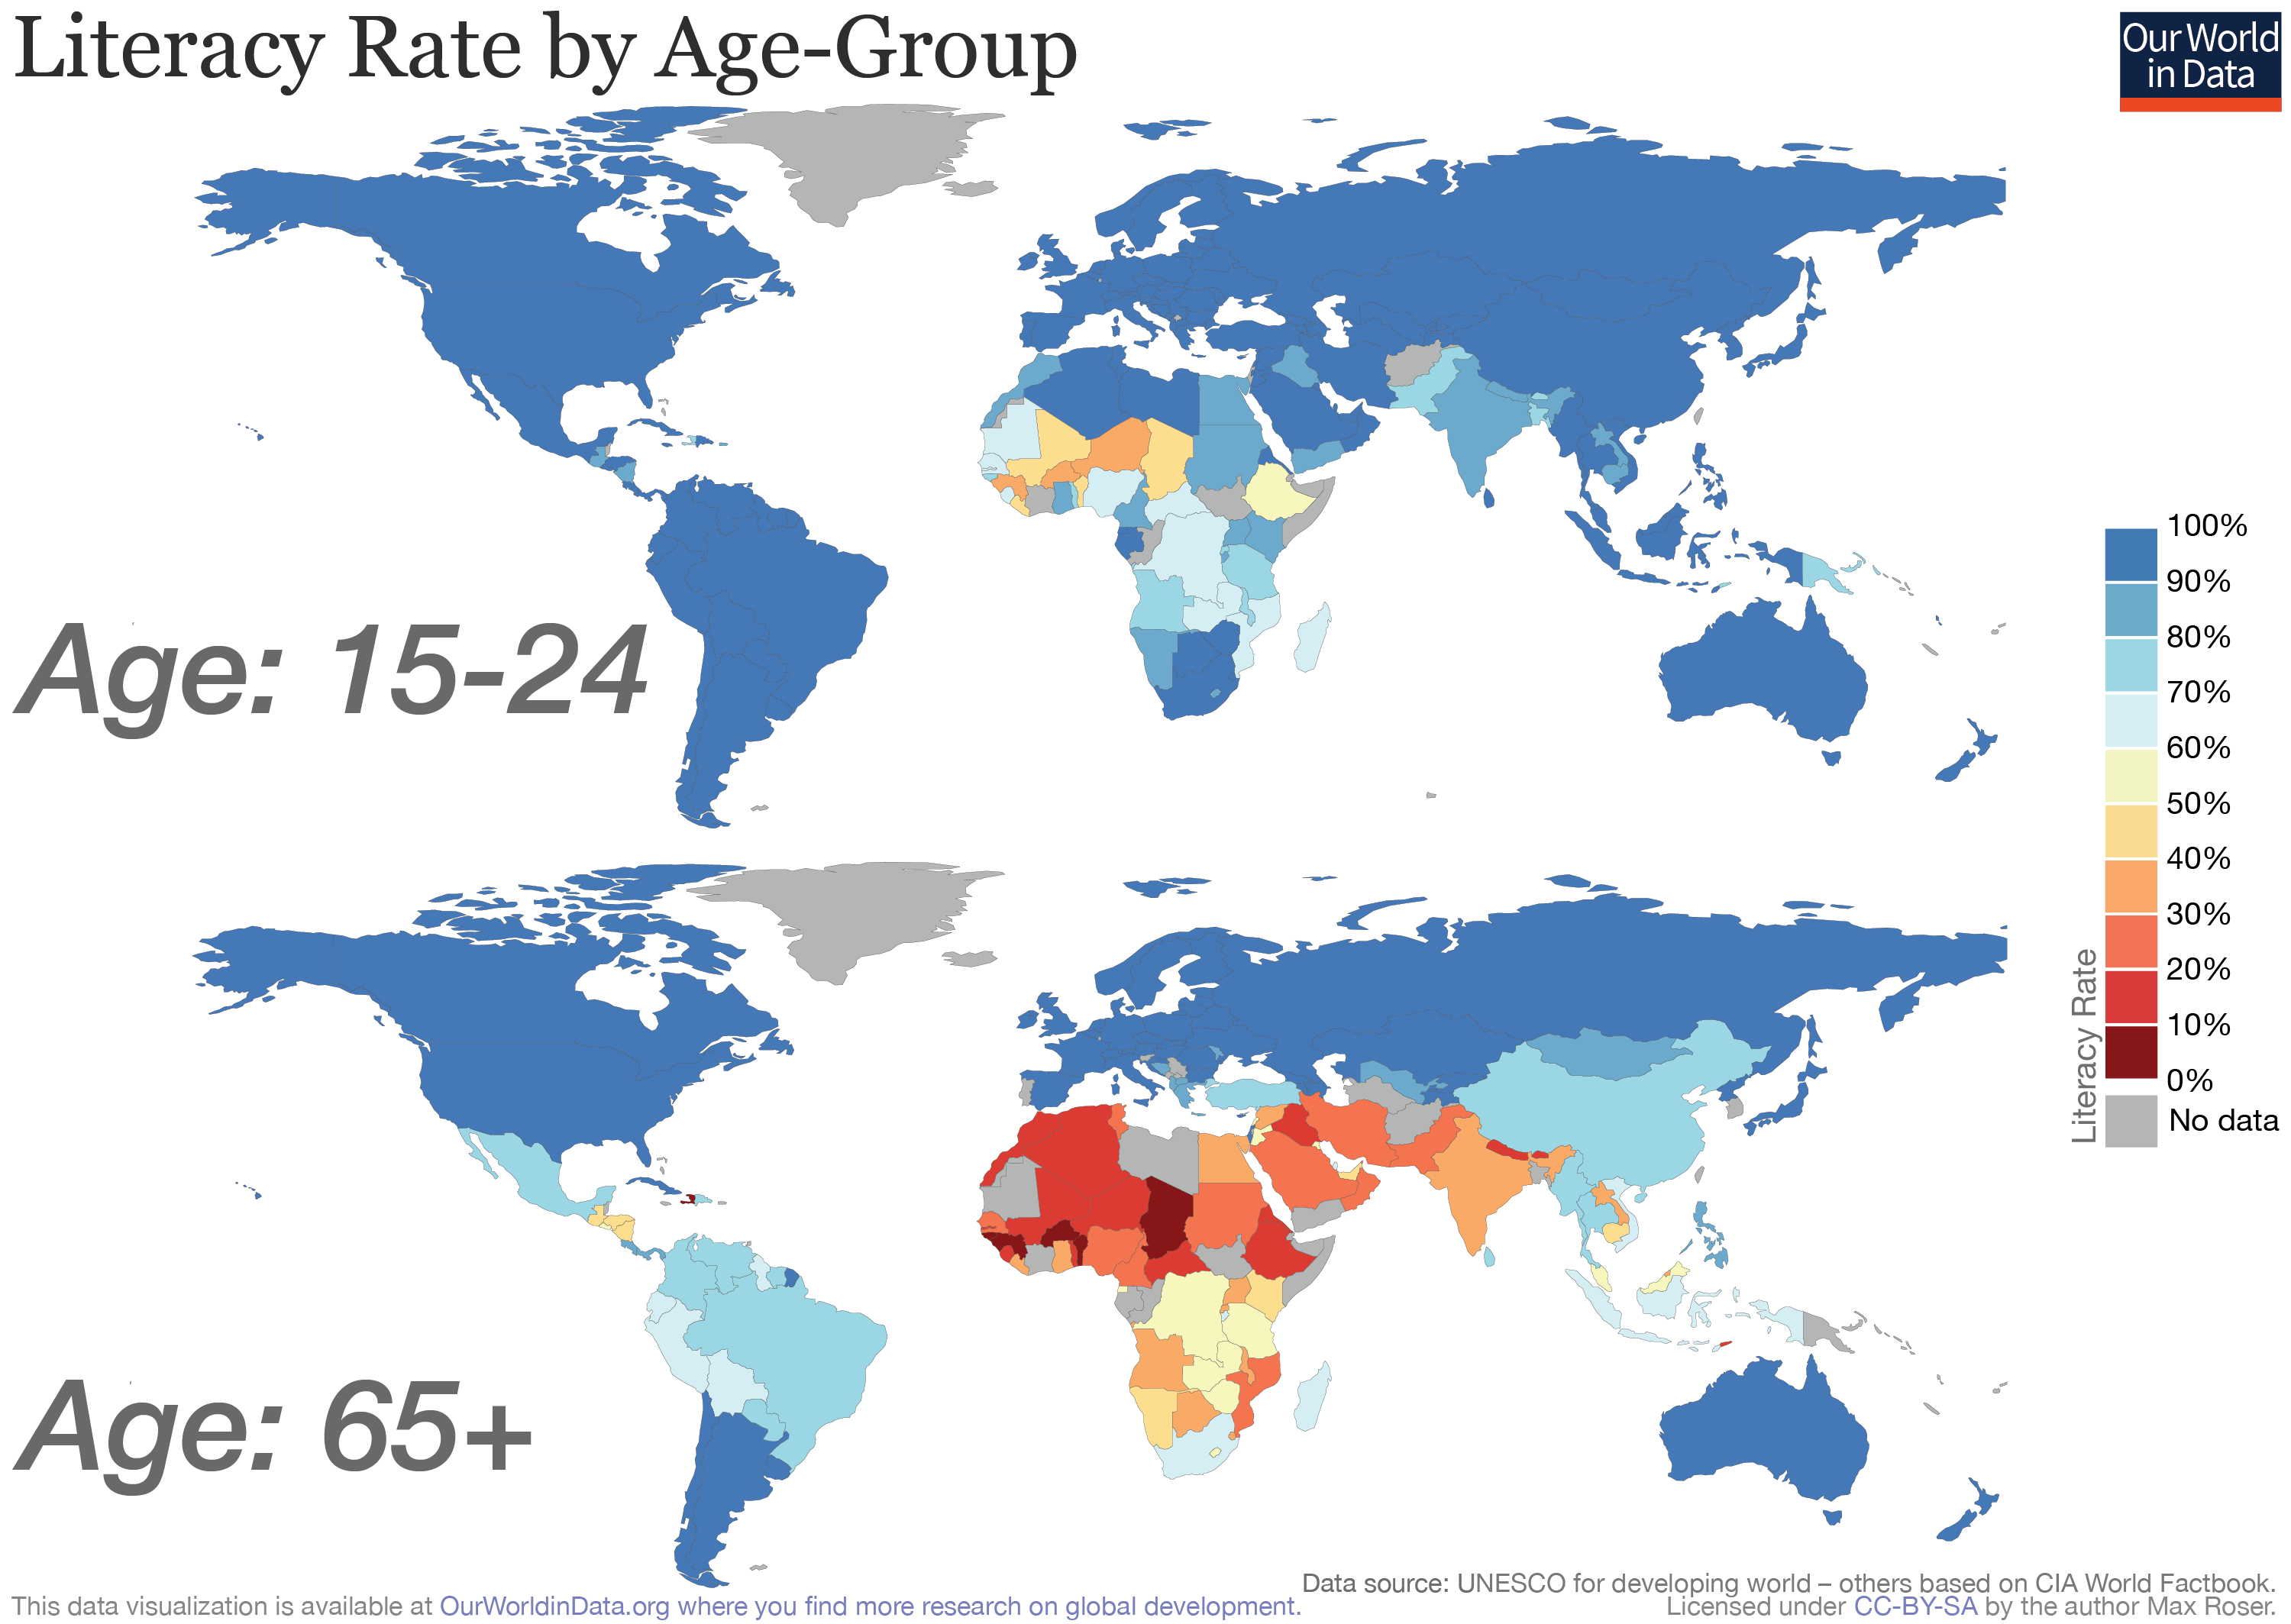
Learning to read and write is easiest and most fruitful at a young age, and it’s a skill that is very unlikely to be lost later in life. For that reason, it’s worth looking at the difference between older and younger generations in terms of who is learning these skills.
For this, we zoom into the Middle East and Northern Africa region, which is where the majority of recent gains in literacy have been made:
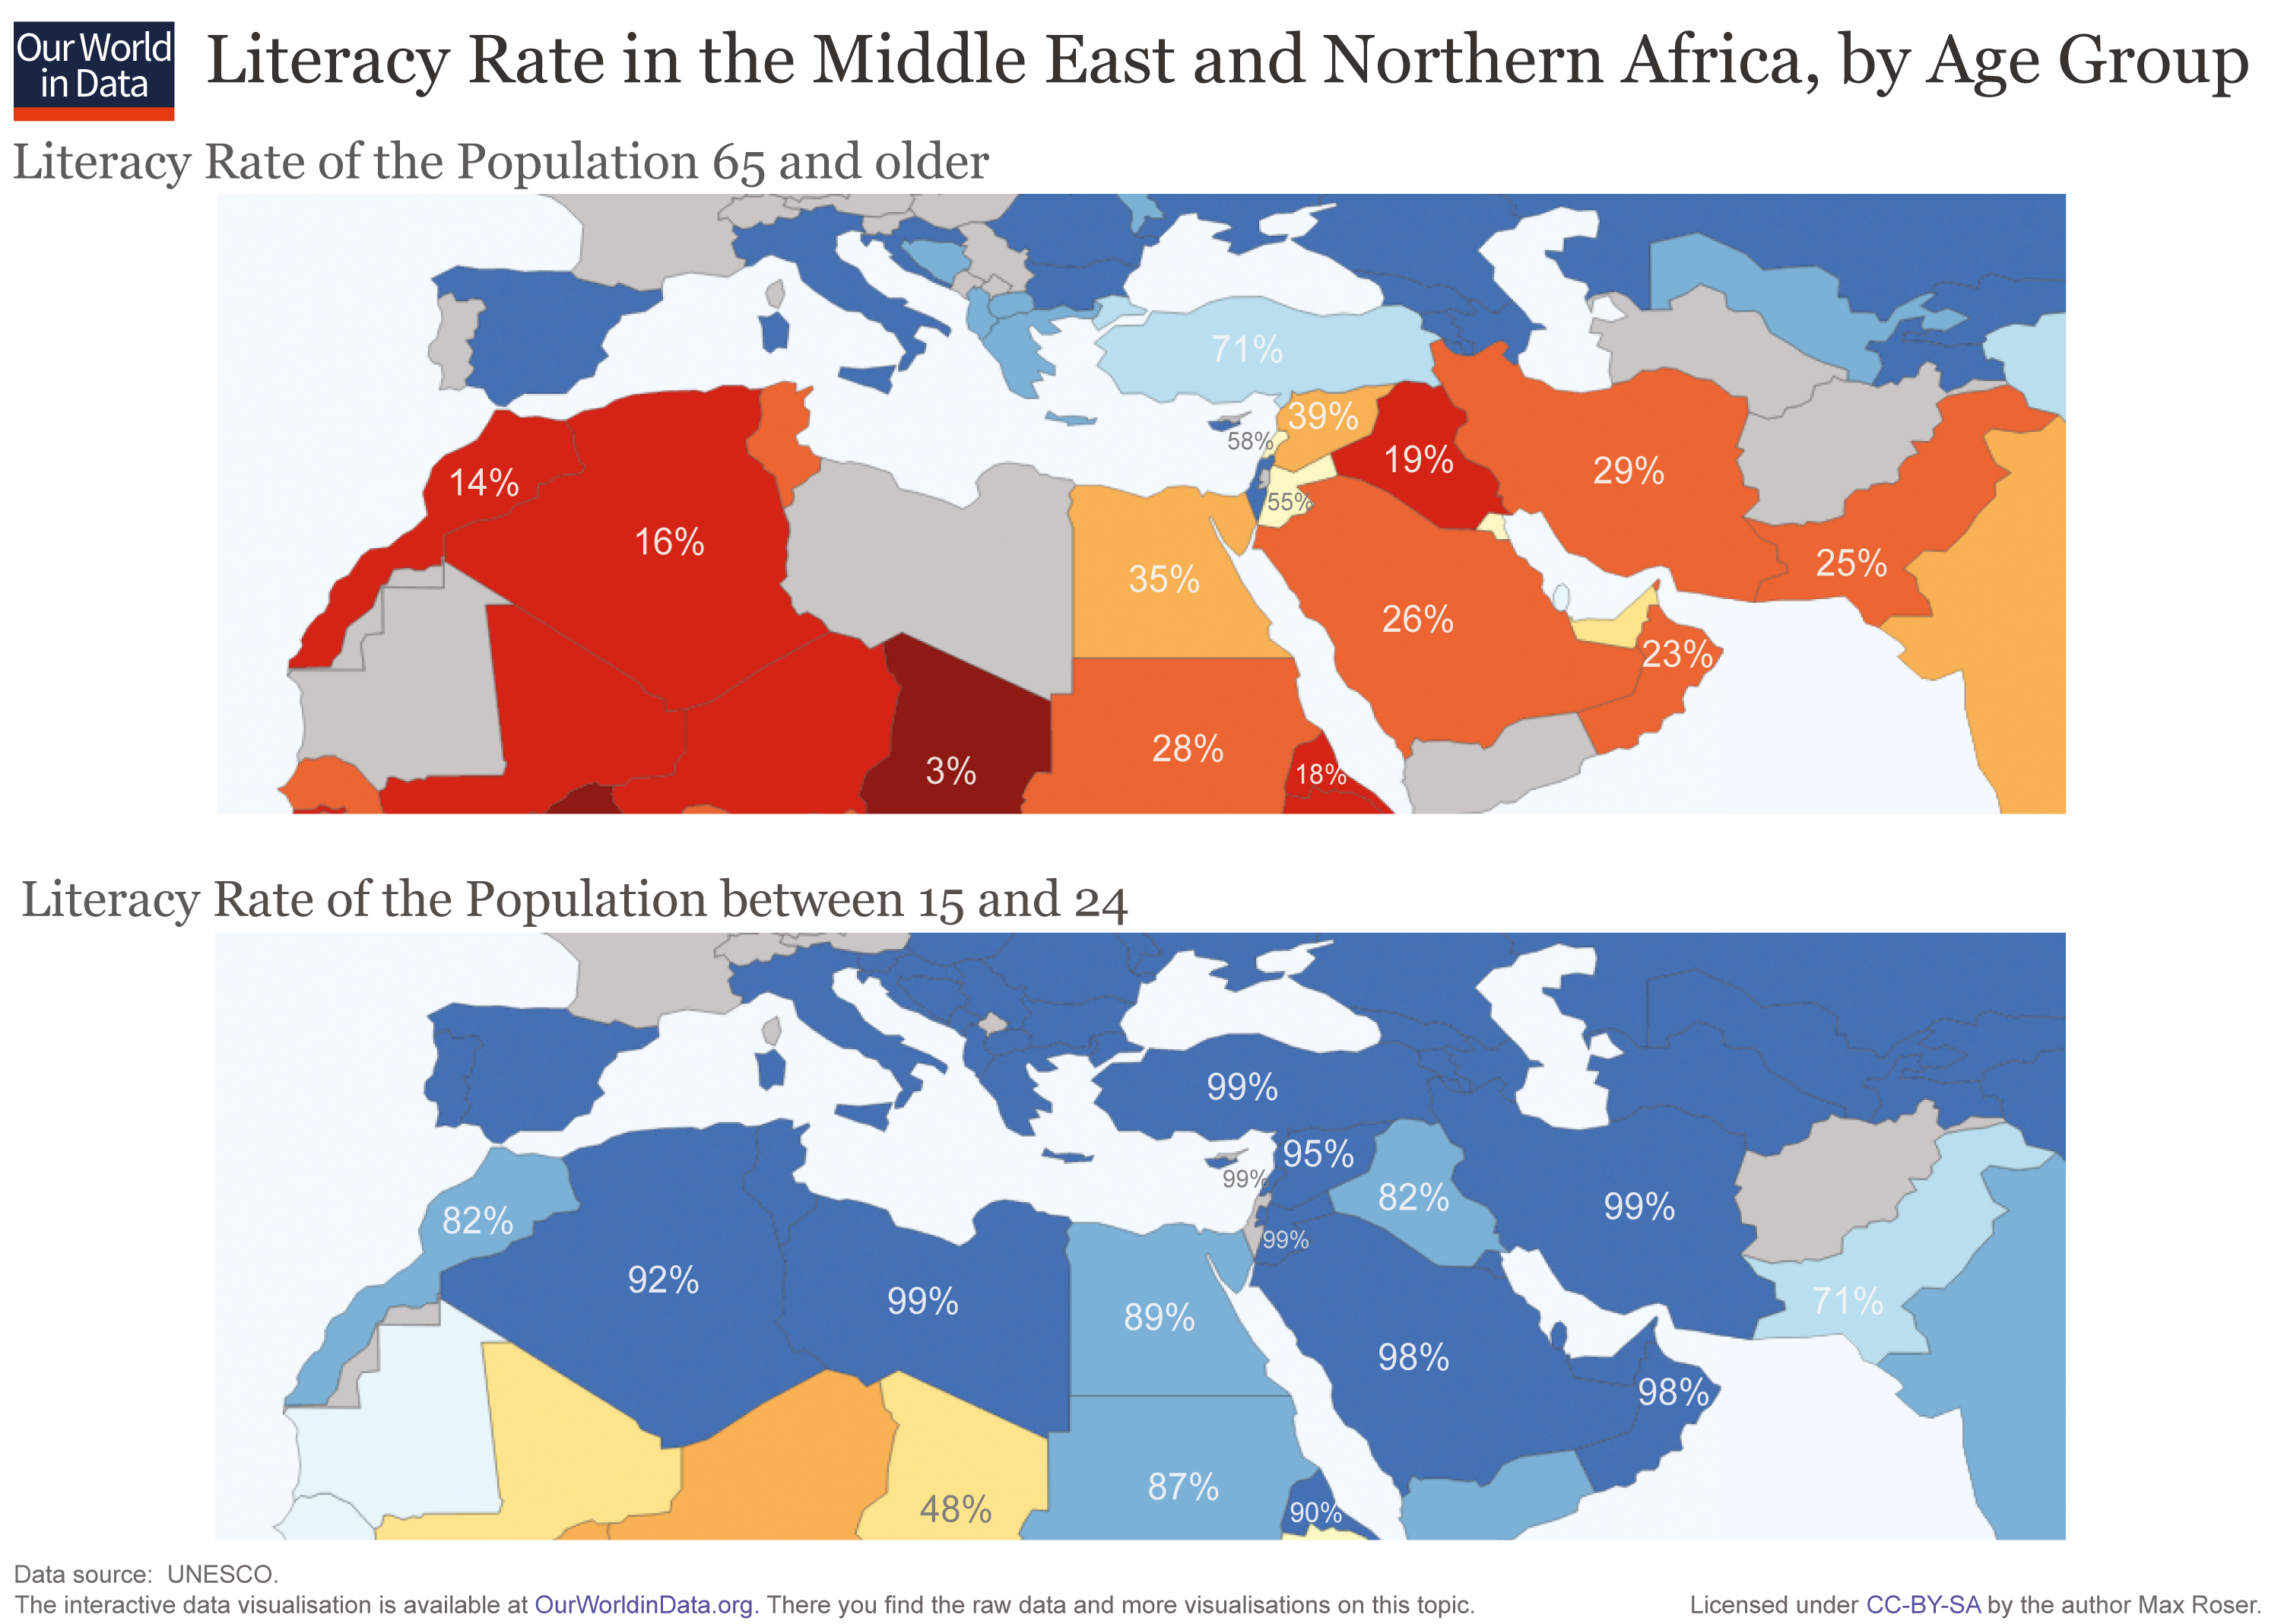
Here, the difference in literacy between the 15-24 year age group and those over 65 years is substantial, with countries seeing large, double-digit increases in the ability to read and write:
- 🇩🇿 Algeria
The literacy rate is at 92% for the 15-24 age group, compared to 16% of the oldest generation - 🇮🇷 Iran
99% of the 15-24 age group is literate, while 29% of the oldest generation can say the same - 🇴🇲 Oman
98% of those aged 15-24 are literate, compared to just 23% in the 65+ age group - 🇸🇦 Saudi Arabia
98% of those aged 15-24 can read and write, versus 26% of those in the oldest bracket - 🇪🇷 Eritrea
The literacy rate is at 90% for the 15-24 age group, and 18% for those in the 65+ age group
It’s not that surprising then, that the above countries all now sit in the 75-95% percent range for overall literacy—a number that will likely improve further as education systems continue to help younger generations become literate early in life.
The Literacy Opportunity
While some countries have seen obvious generational improvements in literacy, there are places in the world where changes to educational systems have not fully yet manifested yet, or perhaps the data is not yet available for.
According to the interactive map above, here are some places on each continent where progress must still be made:
- North America
Literacy rates: 🇭🇹 Haiti (61%), 🇬🇹 Guatemala (79%), 🇳🇮 Nicaragua (82%) - South America
Literacy rates: 🇬🇾 Guyana (88%) - Europe
Literacy rates: 🇽🇰 Kosovo (92%) - Asia
Literacy rates: 🇦🇫 Afghanistan (38%), 🇵🇰 Pakistan (56%), 🇧🇩 Bangladesh (61%), 🇾🇪 Yemen (70%) - Africa
Literacy rates: 🇳🇪 Niger (19%), 🇬🇳 Guinea (30%), 🇸🇸 South Sudan (32%), 🇲🇱 Mali (33%), 🇨🇫 Central African Republic (37%), 🇸🇴 Somalia (38%), 🇧🇯 Benin (38%) - Oceania
Literacy rates: 🇵🇬 Papua New Guinea (62%)
With many NGOs and educators focused on this problem, there is hope that the “last mile” of global literacy can be solved, leading to more economic opportunity in these places—and also the world itself as a whole.

This article was published as a part of Visual Capitalist's Creator Program, which features data-driven visuals from some of our favorite Creators around the world.


Demographics
The Smallest Gender Wage Gaps in OECD Countries
Which OECD countries have the smallest gender wage gaps? We look at the 10 countries with gaps lower than the average.


The Smallest Gender Pay Gaps in OECD Countries
This was originally posted on our Voronoi app. Download the app for free on iOS or Android and discover incredible data-driven charts from a variety of trusted sources.
Among the 38 member countries in the Organization for Economic Cooperation and Development (OECD), several have made significant strides in addressing income inequality between men and women.
In this graphic we’ve ranked the OECD countries with the 10 smallest gender pay gaps, using the latest data from the OECD for 2022.
The gender pay gap is calculated as the difference between median full-time earnings for men and women divided by the median full-time earnings of men.
Which Countries Have the Smallest Gender Pay Gaps?
Luxembourg’s gender pay gap is the lowest among OECD members at only 0.4%—well below the OECD average of 11.6%.
| Rank | Country | Percentage Difference in Men's & Women's Full-time Earnings |
|---|---|---|
| 1 | 🇱🇺 Luxembourg | 0.4% |
| 2 | 🇧🇪 Belgium | 1.1% |
| 3 | 🇨🇷 Costa Rica | 1.4% |
| 4 | 🇨🇴 Colombia | 1.9% |
| 5 | 🇮🇪 Ireland | 2.0% |
| 6 | 🇭🇷 Croatia | 3.2% |
| 7 | 🇮🇹 Italy | 3.3% |
| 8 | 🇳🇴 Norway | 4.5% |
| 9 | 🇩🇰 Denmark | 5.8% |
| 10 | 🇵🇹 Portugal | 6.1% |
| OECD Average | 11.6% |
Notably, eight of the top 10 countries with the smallest gender pay gaps are located in Europe, as labor equality laws designed to target gender differences have begun to pay off.
The two other countries that made the list were Costa Rica (1.4%) and Colombia (1.9%), which came in third and fourth place, respectively.
How Did Luxembourg (Nearly) Eliminate its Gender Wage Gap?
Luxembourg’s virtually-non-existent gender wage gap in 2020 can be traced back to its diligent efforts to prioritize equal pay. Since 2016, firms that have not complied with the Labor Code’s equal pay laws have been subjected to penalizing fines ranging from €251 to €25,000.
Higher female education rates also contribute to the diminishing pay gap, with Luxembourg tied for first in the educational attainment rankings of the World Economic Forum’s Global Gender Gap Index Report for 2023.
See More Graphics about Demographics and Money
While these 10 countries are well below the OECD’s average gender pay gap of 11.6%, many OECD member countries including the U.S. are significantly above the average. To see the full list of the top 10 OECD countries with the largest gender pay gaps, check out this visualization.

-

 Real Estate2 weeks ago
Visualizing America’s Shortage of Affordable Homes
-

 Technology1 week ago
Ranked: Semiconductor Companies by Industry Revenue Share
-

 Money1 week ago
Which States Have the Highest Minimum Wage in America?
-

 Real Estate1 week ago
Ranked: The Most Valuable Housing Markets in America
-

 Business2 weeks ago
Charted: Big Four Market Share by S&P 500 Audits
-

 AI2 weeks ago
The Stock Performance of U.S. Chipmakers So Far in 2024
-

 Misc2 weeks ago
Almost Every EV Stock is Down After Q1 2024
-

 Money2 weeks ago
Where Does One U.S. Tax Dollar Go?