Energy
Charted: 40 Years of Global Energy Production, by Country
Article/Editing:
Energy was already a hot topic before 2022, but soaring household energy bills and a cost of living crisis has brought it even more to the forefront.
Which countries are the biggest energy producers, and what types of energy are they churning out? This graphic by 911 Metallurgist gives a breakdown of global energy production, showing which countries have used the most fossil fuels, nuclear, and renewable energy since 1980.
All figures refer to the British thermal unit (BTU), equivalent to the heat required to heat one pound of water by one degree Fahrenheit.
Editor’s note: Click on any graphic to see a full-width version that is higher resolution
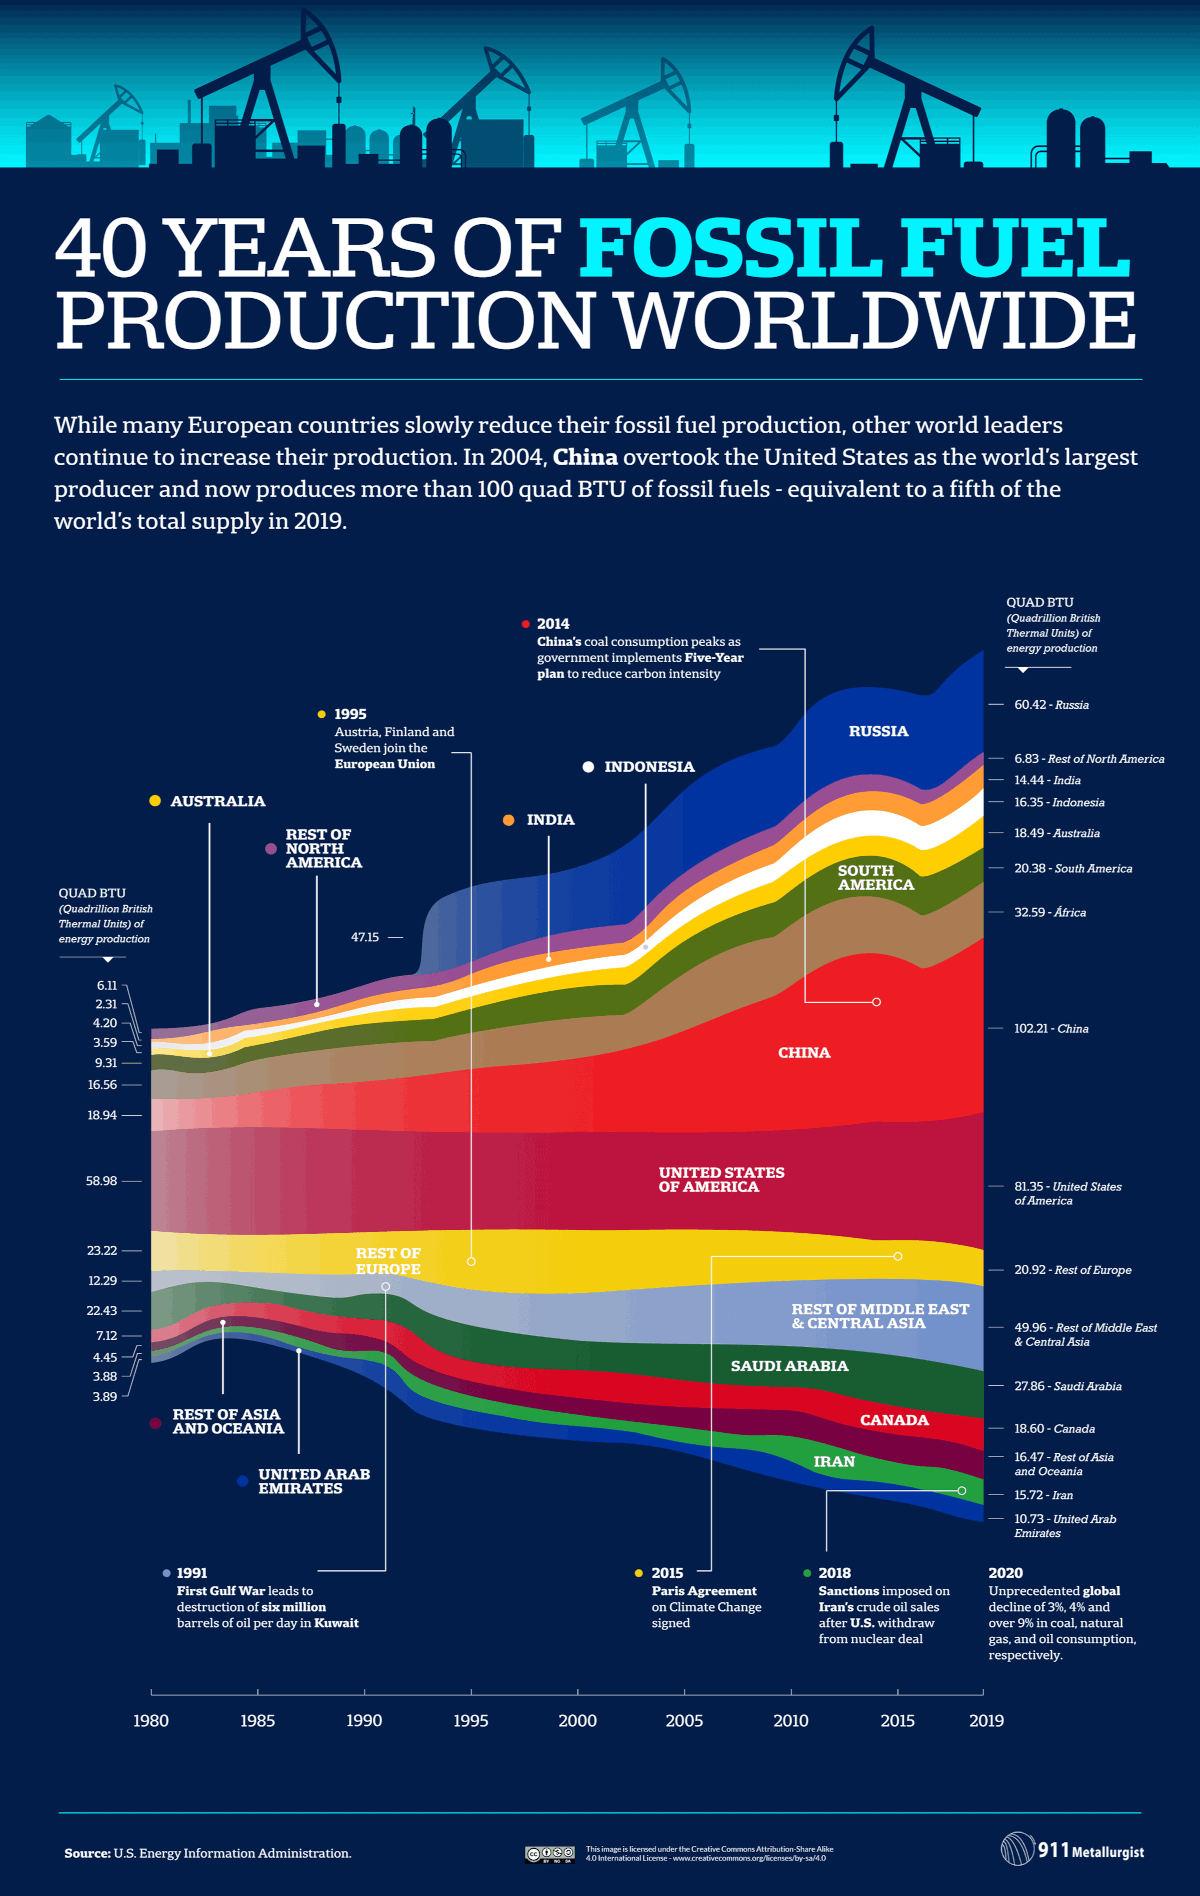
1. Fossil Fuels
View the full-size infographic
While the U.S. is a dominant player in both oil and natural gas production, China holds the top spot as the world’s largest fossil fuel producer, largely because of its significant production and consumption of coal.
Over the last decade, China has used more coal than the rest of the world, combined.
However, it’s worth noting that the country’s fossil fuel consumption and production have dipped in recent years, ever since the government launched a five-year plan back in 2014 to help reduce carbon emissions.
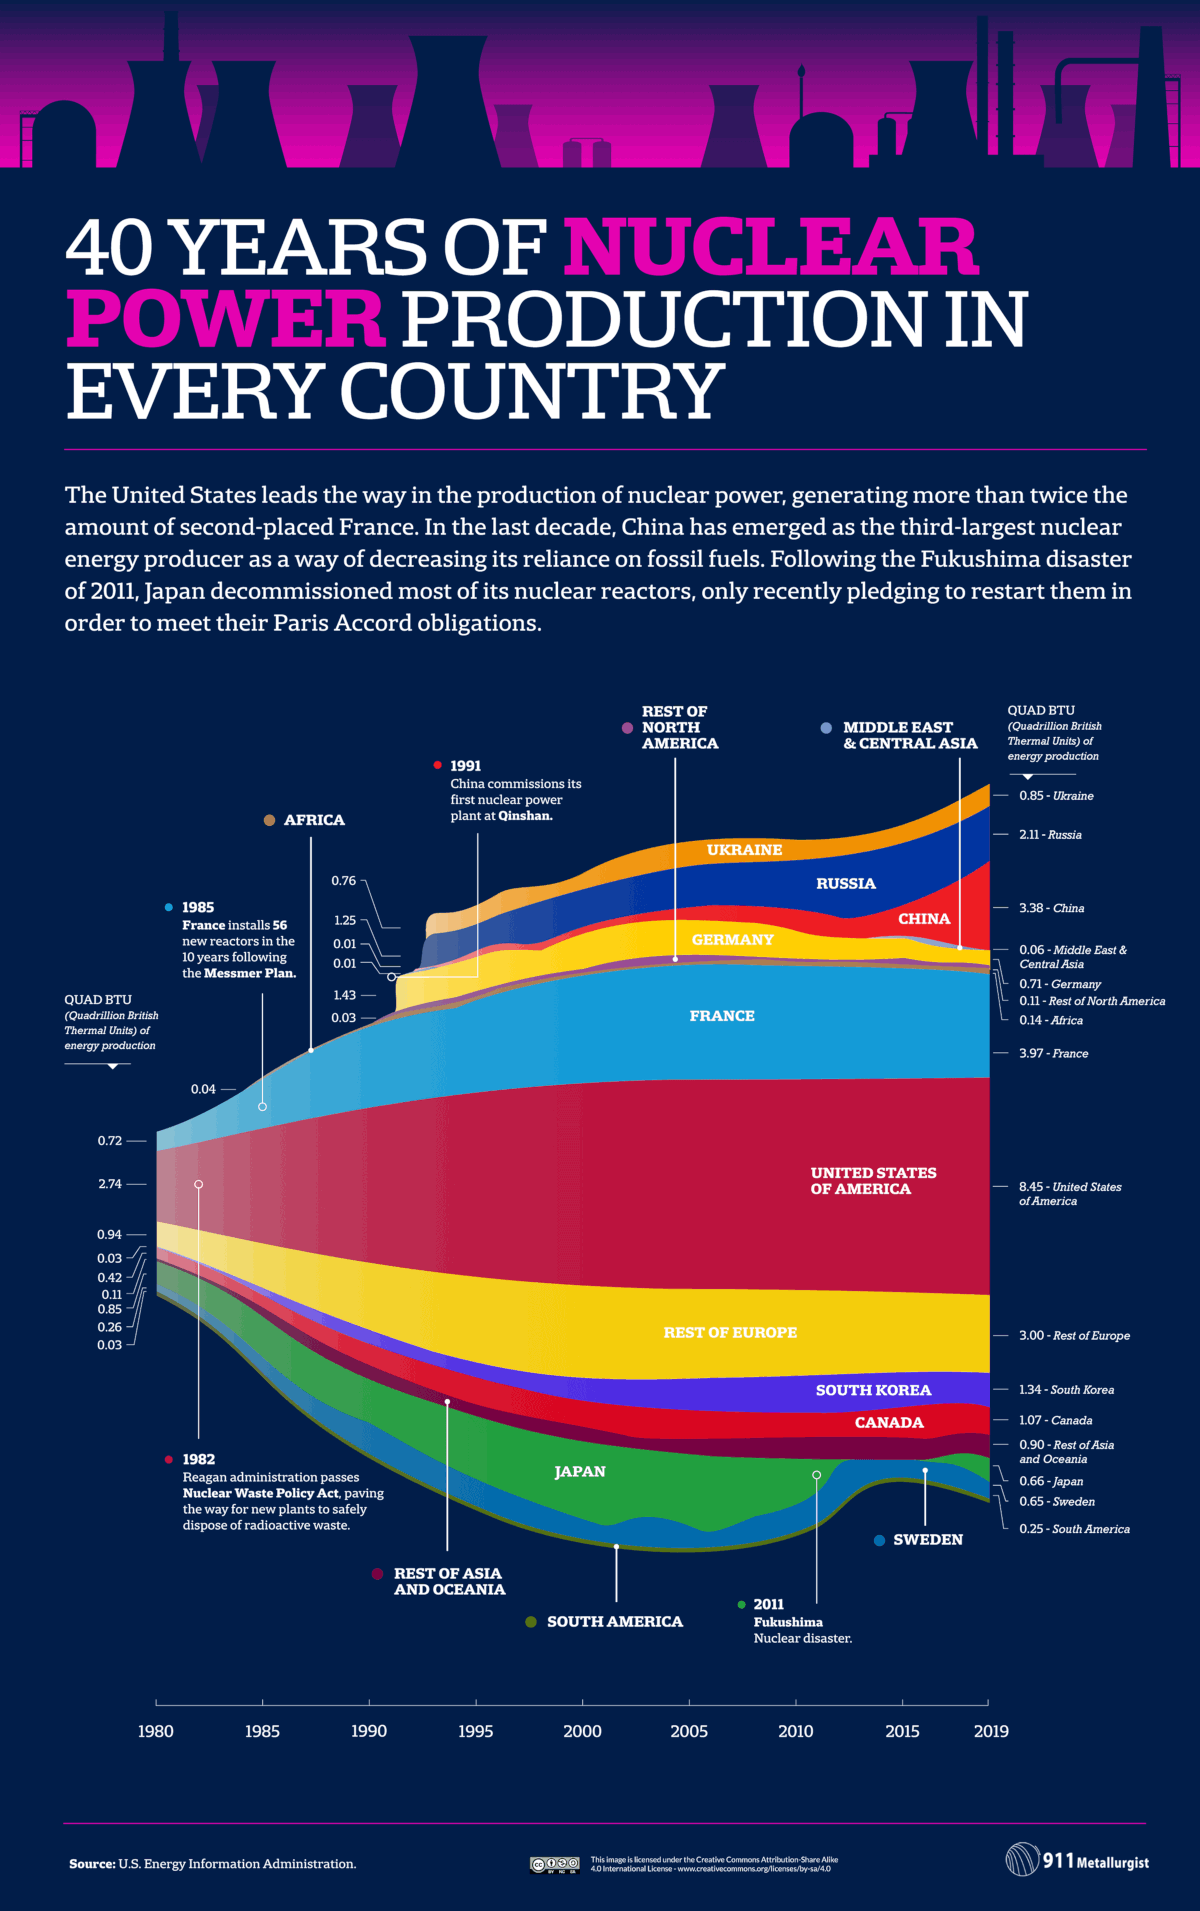
2. Nuclear Power
View the full-size infographic
The U.S. is the world’s largest producer of nuclear power by far, generating about double the amount of nuclear energy as France, the second-largest producer.
While nuclear power provides a carbon-free alternative to fossil fuels, the nuclear disaster in Fukushima caused many countries to move away from the energy source, which is why global use has dipped in recent years.
Despite the fact that many countries have recently pivoted away from nuclear energy, it still powers about 10% of the world’s electricity. It’s also possible that nuclear energy will play an expanded role in the energy mix going forward, since decarbonization has emerged as a top priority for nations around the world.
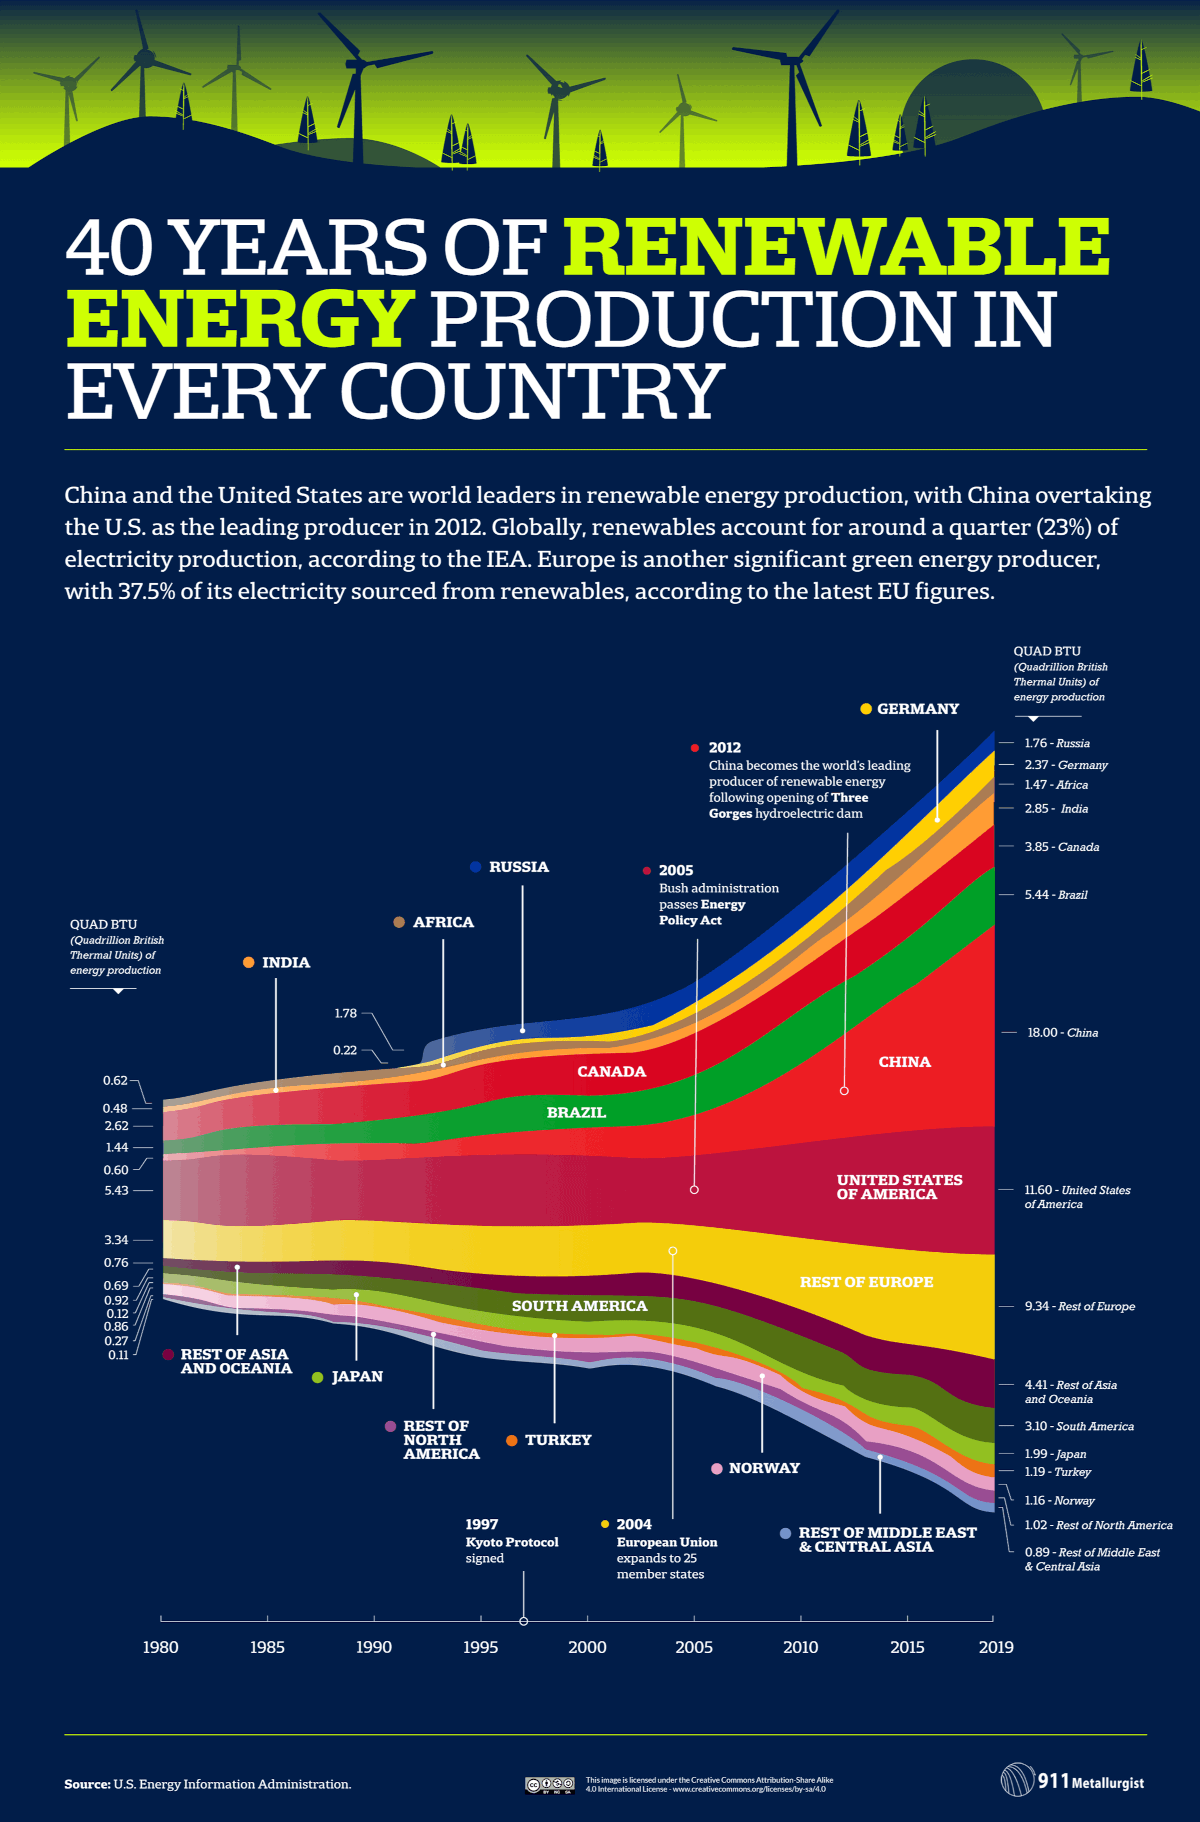
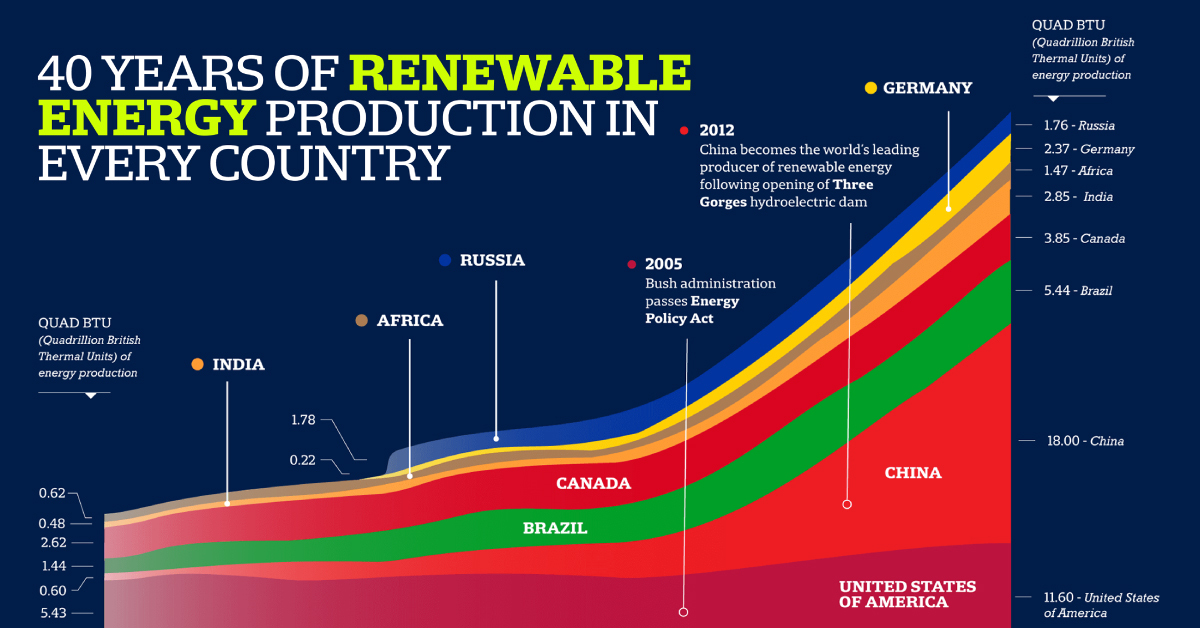
3. Renewable Energy
View the full-size infographic
Renewable energy sources (including wind, hydro, and solar) account for about 23% of electricity production worldwide. China leads the front on renewable production, while the U.S. comes in second place.
While renewable energy production has ramped up in recent years, more countries will need to ramp up their renewable energy production in order to reach net-zero targets by 2050.

This article was published as a part of Visual Capitalist's Creator Program, which features data-driven visuals from some of our favorite Creators around the world.


Energy
The World’s Biggest Nuclear Energy Producers
China has grown its nuclear capacity over the last decade, now ranking second on the list of top nuclear energy producers.


The World’s Biggest Nuclear Energy Producers
This was originally posted on our Voronoi app. Download the app for free on Apple or Android and discover incredible data-driven charts from a variety of trusted sources.
Scientists in South Korea recently broke a record in a nuclear fusion experiment. For 48 seconds, they sustained a temperature seven times that of the sun’s core.
But generating commercially viable energy from nuclear fusion still remains more science fiction than reality. Meanwhile, its more reliable sibling, nuclear fission, has been powering our world for many decades.
In this graphic, we visualized the top producers of nuclear energy by their share of the global total, measured in terawatt hours (TWh). Data for this was sourced from the Nuclear Energy Institute, last updated in August 2022.
Which Country Generates the Most Nuclear Energy?
Nuclear energy production in the U.S. is more than twice the amount produced by China (ranked second) and France (ranked third) put together. In total, the U.S. accounts for nearly 30% of global nuclear energy output.
However, nuclear power only accounts for one-fifth of America’s electricity supply. This is in contrast to France, which generates 60% of its electricity from nuclear plants.
| Rank | Country | Nuclear Energy Produced (TWh) | % of Total |
|---|---|---|---|
| 1 | 🇺🇸 U.S. | 772 | 29% |
| 2 | 🇨🇳 China | 383 | 14% |
| 3 | 🇫🇷 France | 363 | 14% |
| 4 | 🇷🇺 Russia | 208 | 8% |
| 5 | 🇰🇷 South Korea | 150 | 6% |
| 6 | 🇨🇦 Canada | 87 | 3% |
| 7 | 🇺🇦 Ukraine | 81 | 3% |
| 8 | 🇩🇪 Germany | 65 | 2% |
| 9 | 🇯🇵 Japan | 61 | 2% |
| 10 | 🇪🇸 Spain | 54 | 2% |
| 11 | 🇸🇪 Sweden | 51 | 2% |
| 12 | 🇧🇪 Belgium | 48 | 2% |
| 13 | 🇬🇧 UK | 42 | 2% |
| 14 | 🇮🇳 India | 40 | 2% |
| 15 | 🇨🇿 Czech Republic | 29 | 1% |
| N/A | 🌐 Other | 219 | 8% |
| N/A | 🌍 Total | 2,653 | 100% |
Another highlight is how China has rapidly grown its nuclear energy capabilities in the last decade. Between 2016 and 2021, for example, it increased its share of global nuclear energy output from less than 10% to more than 14%, overtaking France for second place.
On the opposite end, the UK’s share has slipped to 2% over the same time period.
Meanwhile, Ukraine has heavily relied on nuclear energy to power its grid. In March 2022, it lost access to its key Zaporizhzhia Nuclear Power Station after Russian forces wrested control of the facility. With six 1,000 MW reactors, the plant is one of the largest in Europe. It is currently not producing any power, and has been the site of recent drone attacks.

-

 Real Estate2 weeks ago
Visualizing America’s Shortage of Affordable Homes
-

 Technology1 week ago
Ranked: Semiconductor Companies by Industry Revenue Share
-

 Money2 weeks ago
Which States Have the Highest Minimum Wage in America?
-

 Real Estate2 weeks ago
Ranked: The Most Valuable Housing Markets in America
-

 Business2 weeks ago
Charted: Big Four Market Share by S&P 500 Audits
-

 AI2 weeks ago
The Stock Performance of U.S. Chipmakers So Far in 2024
-

 Misc2 weeks ago
Almost Every EV Stock is Down After Q1 2024
-

 Money2 weeks ago
Where Does One U.S. Tax Dollar Go?