Technology
Visualizing Financials of the World’s Biggest Companies: From IPO to Today
Article/Editing:
In today’s fast-paced world, companies need to adapt if they want to stay relevant. Even the Big Tech giants can’t get too comfortable—to remain competitive, large corporations like Google and Amazon are constantly innovating and evolving.
This series of graphics by Truman Du illustrates the income statements of five of the world’s biggest companies—Amazon, Apple, Microsoft, Tesla, and Alphabet—and shows how their financials have evolved since the date of their very first public disclosures.
Editor’s note: Click on any graphic to see a full-width version that is higher resolution. Also, because these companies are in some cases 10,000x the size they were at IPO date, the two visual financial statements are not meant to be directly comparable in sizing.
Visual Income Statements: From IPO to Today
Let’s start with Apple, the first company to go public, and the biggest in the mix:
1. Apple
View the full-size infographic
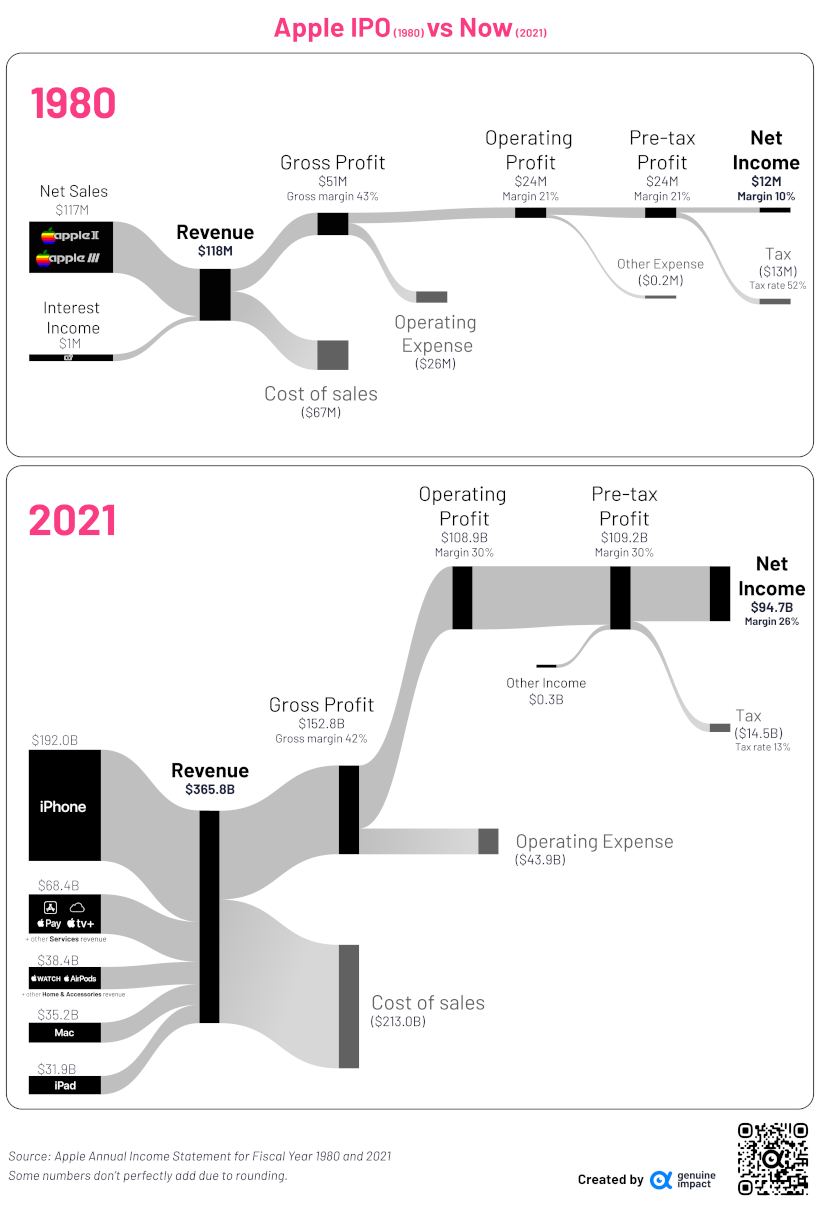
Back in 1998, Apple went by the name “Apple Computer,” because at the time, the company only sold computers and computer hardware kits. However, over the next decade, the company expanded its product offerings and started to sell various consumer tech products like phones, portable music players, and even tablets.
Apple’s consumer tech was so successful, that by 2007 the company decided to drop “Computer” from its name. Fast forward to today, and the company also generates revenue through services like Apple TV and Apple Pay.
While computers are still a core part of its business, the iPhone has become the biggest revenue driver for the company.
In 2021, Apple generated $94.7 billion in profit at a 26% margin. Today, the company is one of the only Big Tech companies that has been able to withstand the industrywide drop in valuations. Sitting strong with a market capitalization over $2 trillion, the company is worth roughly the same as Amazon, Alphabet, and Meta combined.
2. Microsoft
View the full-size infographic
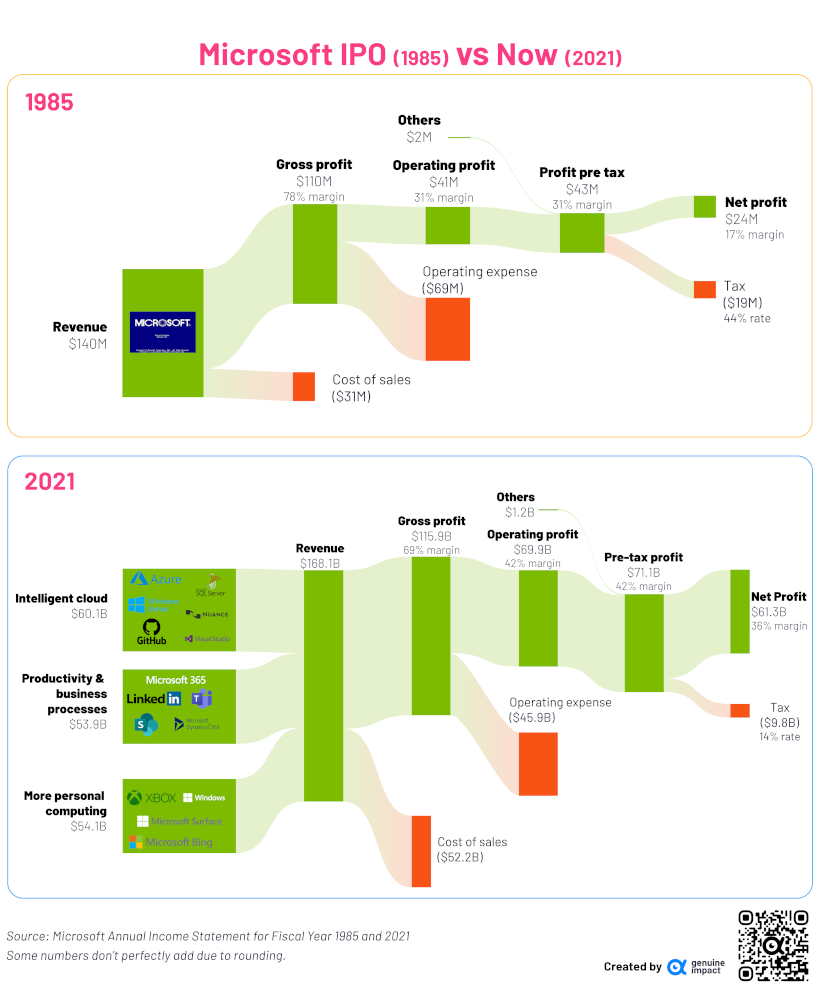
Microsoft, one of the oldest companies on this list, went public in 1985. Back then, the company only sold microprocessors and software—hence the name Micro-Soft.
And while Microsoft’s flagship operating system (Windows) is still one of its major revenue drivers, the company’s product offerings have become much more diverse.
Now, its revenue streams are split fairly evenly between its cloud service (Azure), productivity tools (Office), and personal computing (Xbox and Windows OS).
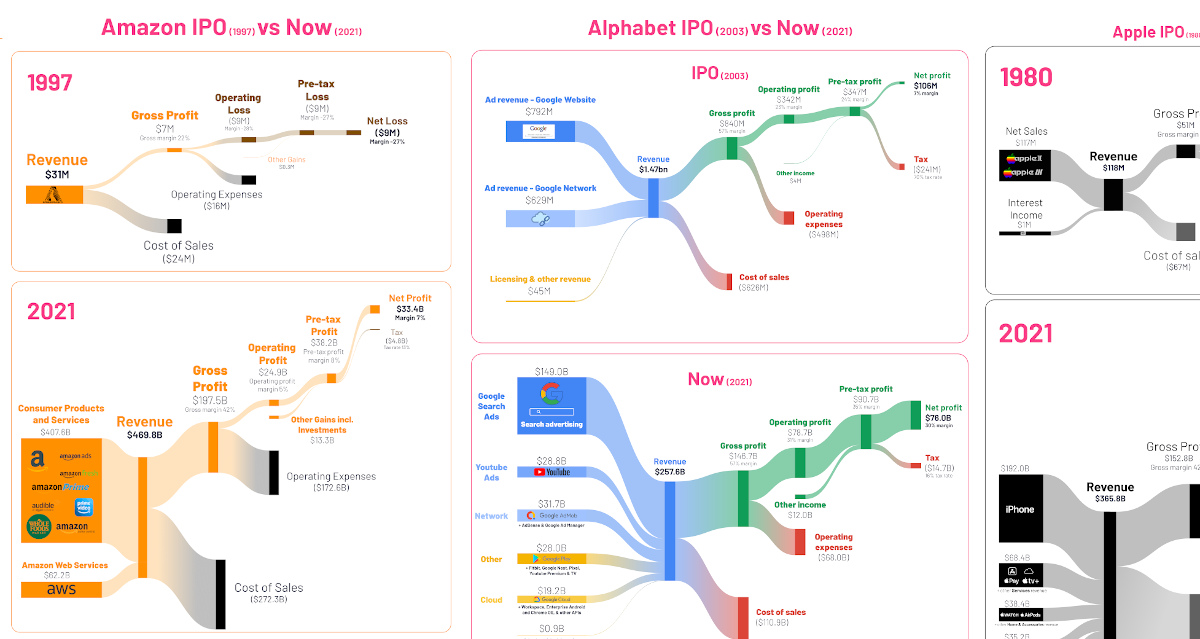
3. Amazon
View the full-size infographic
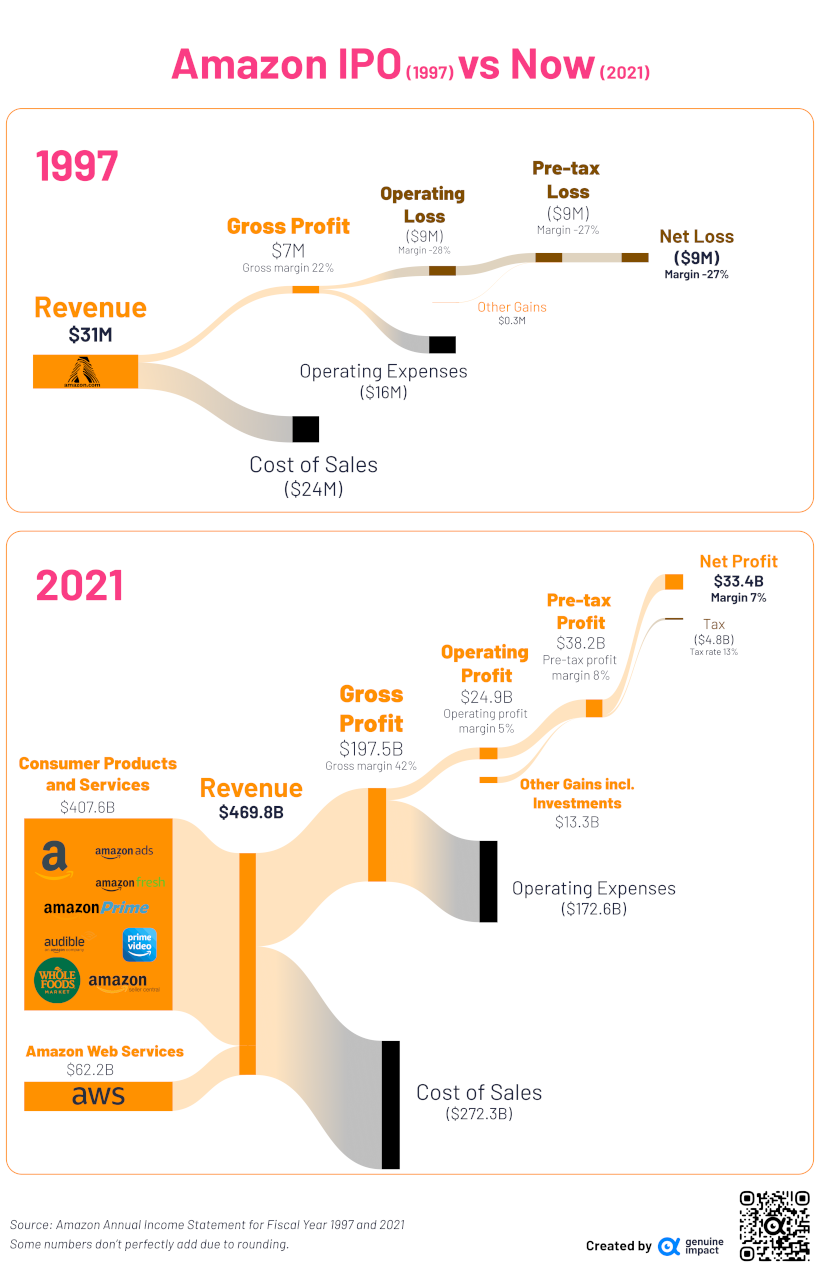
When Amazon went public in 1997, the online retailer was only selling books.
But by 1998, Amazon started rapidly expanding its product offering. Soon it was selling everything from CDs and toys to electronics, and even tools.
Fast forward to now, and the ecommerce segment of Amazon has become just a portion of the company’s overall business.
Amazon is also a cloud-service provider (AWS), supermarket chain (with its grocery brands Amazon Fresh and its acquisition of Whole Foods) and even a video streaming service (Prime Video). In particular, AWS stands out as an important part of Amazon’s overall business, driving a whopping 74% of operating profits.
4. Alphabet
View the full-size infographic
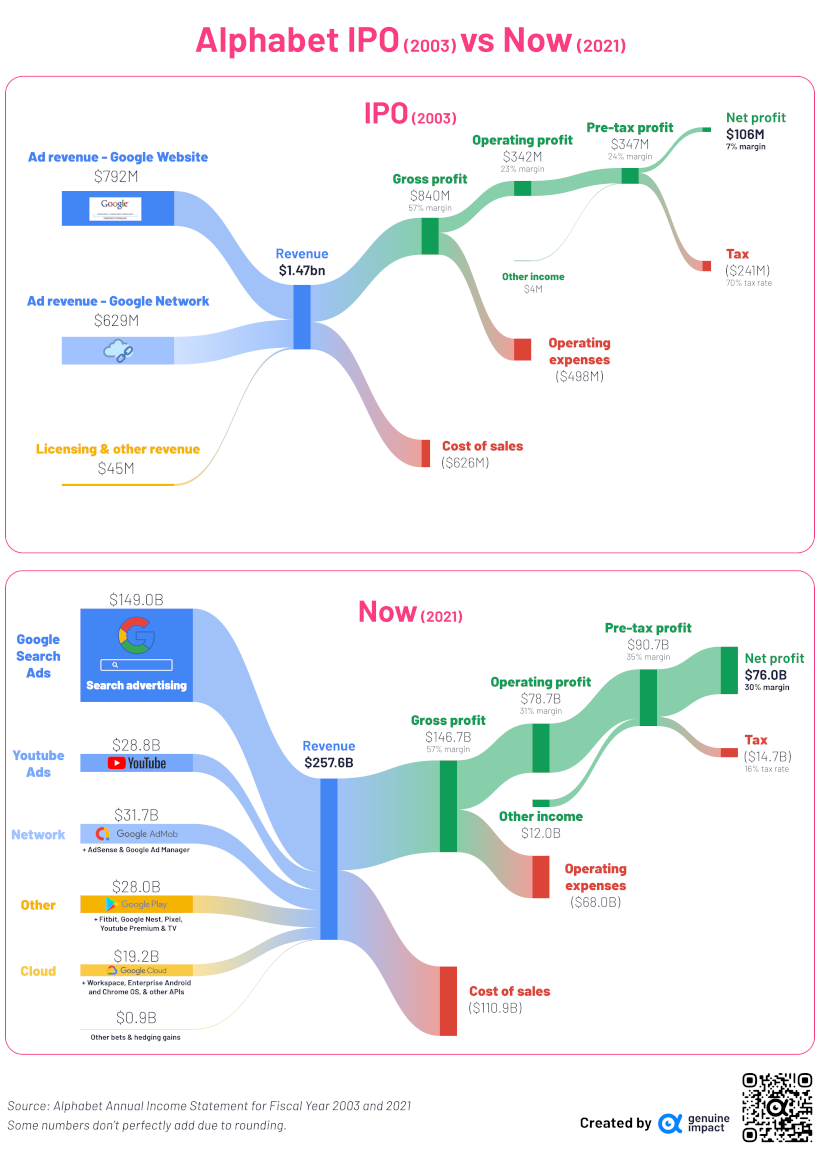
When Google went public in 2003, it was a simple search engine that generated about $1.4 billion in ad revenue from its website and cloud network.
Today, the company (now renamed Alphabet) has become synonymous with the internet, and accounts for an overwhelming majority of the internet’s search traffic. Because of this, it generates hundreds of billions in ad revenue each year.
The company also owns YouTube, and has branched out into different verticals as well like consumer tech (Fitbit), and premium streaming (YouTube Premium &TV).
5. Tesla
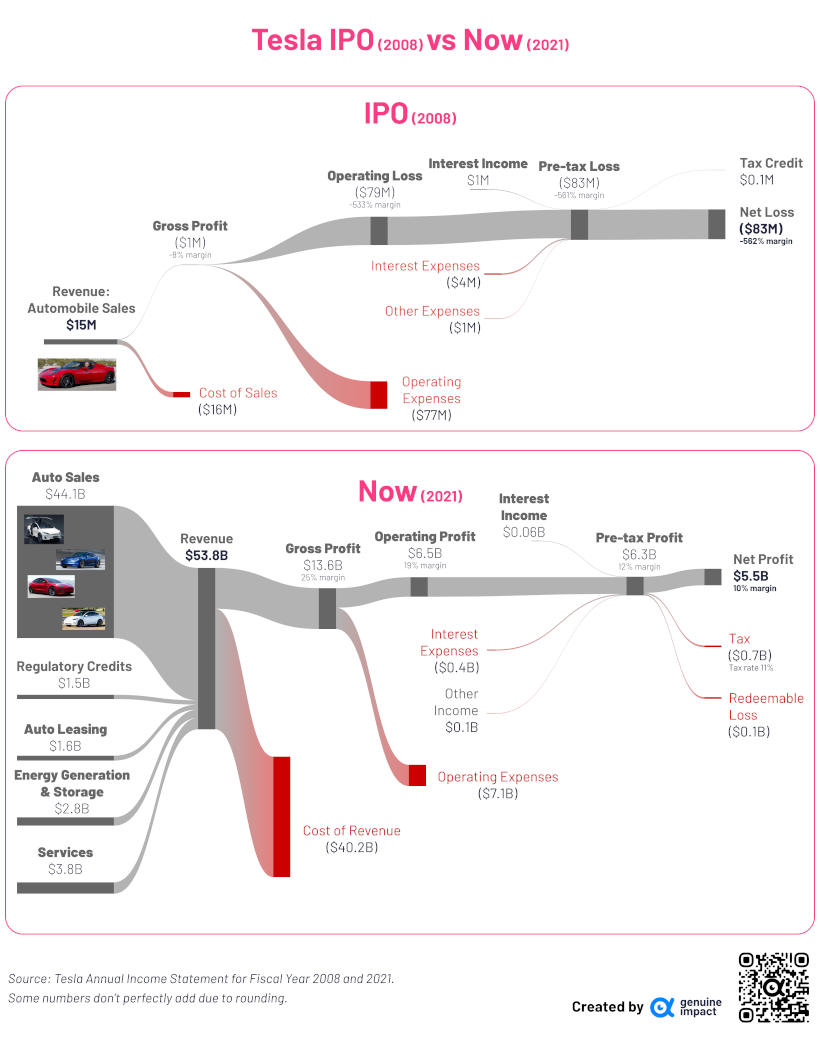
View the full-size infographic
Tesla’s IPO was in 2008, making it the youngest company on the list. And as the newest kid on the block, Tesla’s revenue streams haven’t changed as drastically as the others have.
However, while electric vehicles are still the company’s main revenue driver, Tesla has managed to dip its toes into other verticals over the last 10 years. For instance, in 2021, about $2.8 billion of its $53.8 billion in revenue came from energy generation and storage.

This article was published as a part of Visual Capitalist's Creator Program, which features data-driven visuals from some of our favorite Creators around the world.


Technology
Visualizing AI Patents by Country
See which countries have been granted the most AI patents each year, from 2012 to 2022.


Visualizing AI Patents by Country
This was originally posted on our Voronoi app. Download the app for free on iOS or Android and discover incredible data-driven charts from a variety of trusted sources.
This infographic shows the number of AI-related patents granted each year from 2010 to 2022 (latest data available). These figures come from the Center for Security and Emerging Technology (CSET), accessed via Stanford University’s 2024 AI Index Report.
From this data, we can see that China first overtook the U.S. in 2013. Since then, the country has seen enormous growth in the number of AI patents granted each year.
| Year | China | EU and UK | U.S. | RoW | Global Total |
|---|---|---|---|---|---|
| 2010 | 307 | 137 | 984 | 571 | 1,999 |
| 2011 | 516 | 129 | 980 | 581 | 2,206 |
| 2012 | 926 | 112 | 950 | 660 | 2,648 |
| 2013 | 1,035 | 91 | 970 | 627 | 2,723 |
| 2014 | 1,278 | 97 | 1,078 | 667 | 3,120 |
| 2015 | 1,721 | 110 | 1,135 | 539 | 3,505 |
| 2016 | 1,621 | 128 | 1,298 | 714 | 3,761 |
| 2017 | 2,428 | 144 | 1,489 | 1,075 | 5,136 |
| 2018 | 4,741 | 155 | 1,674 | 1,574 | 8,144 |
| 2019 | 9,530 | 322 | 3,211 | 2,720 | 15,783 |
| 2020 | 13,071 | 406 | 5,441 | 4,455 | 23,373 |
| 2021 | 21,907 | 623 | 8,219 | 7,519 | 38,268 |
| 2022 | 35,315 | 1,173 | 12,077 | 13,699 | 62,264 |
In 2022, China was granted more patents than every other country combined.
While this suggests that the country is very active in researching the field of artificial intelligence, it doesn’t necessarily mean that China is the farthest in terms of capability.
Key Facts About AI Patents
According to CSET, AI patents relate to mathematical relationships and algorithms, which are considered abstract ideas under patent law. They can also have different meaning, depending on where they are filed.
In the U.S., AI patenting is concentrated amongst large companies including IBM, Microsoft, and Google. On the other hand, AI patenting in China is more distributed across government organizations, universities, and tech firms (e.g. Tencent).
In terms of focus area, China’s patents are typically related to computer vision, a field of AI that enables computers and systems to interpret visual data and inputs. Meanwhile America’s efforts are more evenly distributed across research fields.
Learn More About AI From Visual Capitalist
If you want to see more data visualizations on artificial intelligence, check out this graphic that shows which job departments will be impacted by AI the most.

-

 Markets1 week ago
U.S. Debt Interest Payments Reach $1 Trillion
-

 Business2 weeks ago
Charted: Big Four Market Share by S&P 500 Audits
-

 Real Estate2 weeks ago
Ranked: The Most Valuable Housing Markets in America
-

 Money2 weeks ago
Which States Have the Highest Minimum Wage in America?
-

 AI2 weeks ago
Ranked: Semiconductor Companies by Industry Revenue Share
-

 Markets2 weeks ago
Ranked: The World’s Top Flight Routes, by Revenue
-

 Demographics2 weeks ago
Population Projections: The World’s 6 Largest Countries in 2075
-

 Markets2 weeks ago
The Top 10 States by Real GDP Growth in 2023