Demographics
Visualizing The European Union’s Aging Population by 2100
Article/Editing:
View a higher resolution version of this map.
The EU’s Population by 2100
View a higher resolution version of this map.
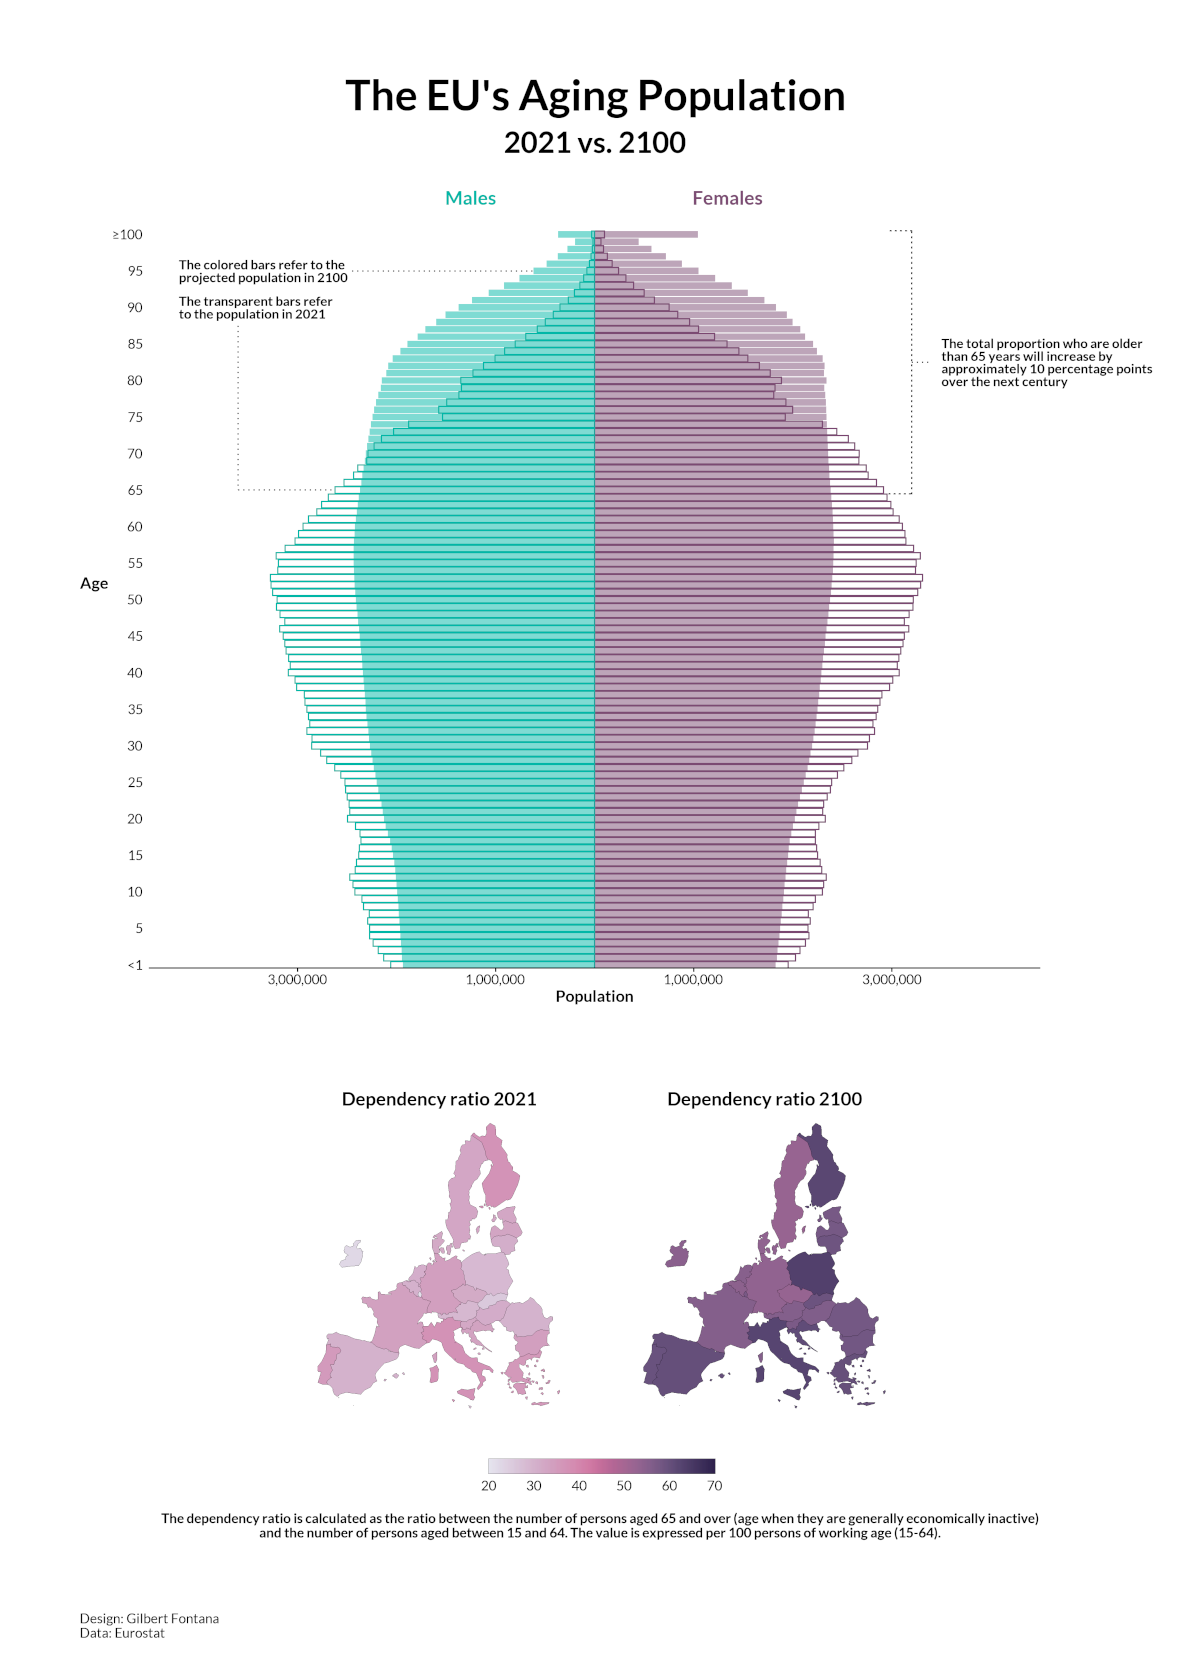
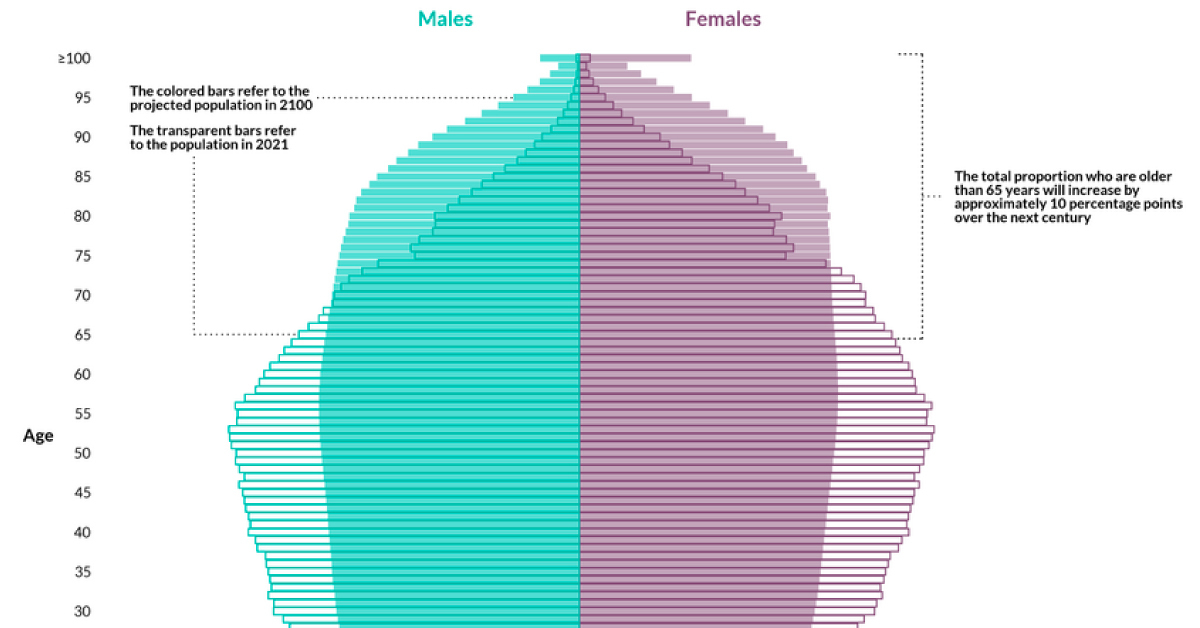
Many countries and regions are expected to see rapidly aging demographics, and the EU is a notable example. By the end of the century, more than 30% of the region’s population is expected to be 65 or older.
This graphic by Gilbert Fontana uses data from Eurostat to show how the EU’s population is projected to change by 2100. In the article below, we explain how this shift could have a dire impact on the region’s economic growth.
Dependency Ratio from 2021 to 2100
The graphic highlights the old-age dependency ratio, which measures the ratio of people 65 and above, and generally retired or needing supplemental income, compared to the number of people that are working age (15-64).
In 2021, the EU’s dependency ratio was 32. This meant that for every 100 working-age people, there were 32 elderly people. By 2100, this ratio is expected to increase to 57.
But what’s the real-life impact of this?
The Impact of the EU’s Aging Population
Typically, the retirement age population is not working and relies on pensions to support themselves financially. Therefore, the bigger the elderly population, the more pressure put on a country’s social safety net.
| Age | EU Population (2021) | EU Population (2100) | % Change |
|---|---|---|---|
| <1-10 | 48,495,075 | 42,216,181 | -12.9% |
| 11-20 | 46,931,543 | 40,137,280 | -14.5% |
| 21-30 | 50,884,150 | 43,247,514 | -15.0% |
| 31-40 | 58,431,638 | 45,628,731 | -21.9% |
| 41-50 | 62,846,623 | 47,136,614 | -25.0% |
| 51-60 | 63,798,230 | 48,320,559 | -24.3% |
| 61-70 | 54,466,484 | 47,430,312 | -12.9% |
| 71-80 | 38,414,111 | 45,671,192 | 18.9% |
| 81-90 | 20,326,431 | 39,411,662 | 93.9% |
| 91-100+ | 3,658,154 | 16,874,396 | 361.3% |
As the population ages, taxes may rise to help cover those inflating costs. And a decrease in a region’s working-age population can also have a significant impact on innovation and experience in the overall workforce.
For example, Japan’s population is also aging rapidly. According to the IMF, this could slow down the country’s annual GDP growth by 1 percentage point in the next 30 years.
Main Causes of An Aging Population
Japan and the EU aren’t the only places in the world that are seeing their population get older—the entire global population is aging.
According to the World Health Organization, one in six people worldwide will be 60 years old or older by 2030. This is happening for two main reasons:
- Drop in global fertility rates
- Increased life expectancies
To help mitigate the risks that come from aging populations, governments need to ensure their pension systems are adequate and adjusted to account for increasing life expectancies and growing elderly populations.

This article was published as a part of Visual Capitalist's Creator Program, which features data-driven visuals from some of our favorite Creators around the world.


Demographics
The Smallest Gender Wage Gaps in OECD Countries
Which OECD countries have the smallest gender wage gaps? We look at the 10 countries with gaps lower than the average.


The Smallest Gender Pay Gaps in OECD Countries
This was originally posted on our Voronoi app. Download the app for free on iOS or Android and discover incredible data-driven charts from a variety of trusted sources.
Among the 38 member countries in the Organization for Economic Cooperation and Development (OECD), several have made significant strides in addressing income inequality between men and women.
In this graphic we’ve ranked the OECD countries with the 10 smallest gender pay gaps, using the latest data from the OECD for 2022.
The gender pay gap is calculated as the difference between median full-time earnings for men and women divided by the median full-time earnings of men.
Which Countries Have the Smallest Gender Pay Gaps?
Luxembourg’s gender pay gap is the lowest among OECD members at only 0.4%—well below the OECD average of 11.6%.
| Rank | Country | Percentage Difference in Men's & Women's Full-time Earnings |
|---|---|---|
| 1 | 🇱🇺 Luxembourg | 0.4% |
| 2 | 🇧🇪 Belgium | 1.1% |
| 3 | 🇨🇷 Costa Rica | 1.4% |
| 4 | 🇨🇴 Colombia | 1.9% |
| 5 | 🇮🇪 Ireland | 2.0% |
| 6 | 🇭🇷 Croatia | 3.2% |
| 7 | 🇮🇹 Italy | 3.3% |
| 8 | 🇳🇴 Norway | 4.5% |
| 9 | 🇩🇰 Denmark | 5.8% |
| 10 | 🇵🇹 Portugal | 6.1% |
| OECD Average | 11.6% |
Notably, eight of the top 10 countries with the smallest gender pay gaps are located in Europe, as labor equality laws designed to target gender differences have begun to pay off.
The two other countries that made the list were Costa Rica (1.4%) and Colombia (1.9%), which came in third and fourth place, respectively.
How Did Luxembourg (Nearly) Eliminate its Gender Wage Gap?
Luxembourg’s virtually-non-existent gender wage gap in 2020 can be traced back to its diligent efforts to prioritize equal pay. Since 2016, firms that have not complied with the Labor Code’s equal pay laws have been subjected to penalizing fines ranging from €251 to €25,000.
Higher female education rates also contribute to the diminishing pay gap, with Luxembourg tied for first in the educational attainment rankings of the World Economic Forum’s Global Gender Gap Index Report for 2023.
See More Graphics about Demographics and Money
While these 10 countries are well below the OECD’s average gender pay gap of 11.6%, many OECD member countries including the U.S. are significantly above the average. To see the full list of the top 10 OECD countries with the largest gender pay gaps, check out this visualization.

-

 Mining2 weeks ago
Charted: The Value Gap Between the Gold Price and Gold Miners
-

 Real Estate1 week ago
Ranked: The Most Valuable Housing Markets in America
-

 Business1 week ago
Charted: Big Four Market Share by S&P 500 Audits
-

 AI1 week ago
The Stock Performance of U.S. Chipmakers So Far in 2024
-

 Misc1 week ago
Almost Every EV Stock is Down After Q1 2024
-

 Money2 weeks ago
Where Does One U.S. Tax Dollar Go?
-

 Green2 weeks ago
Ranked: Top Countries by Total Forest Loss Since 2001
-

 Real Estate2 weeks ago
Visualizing America’s Shortage of Affordable Homes