Misc
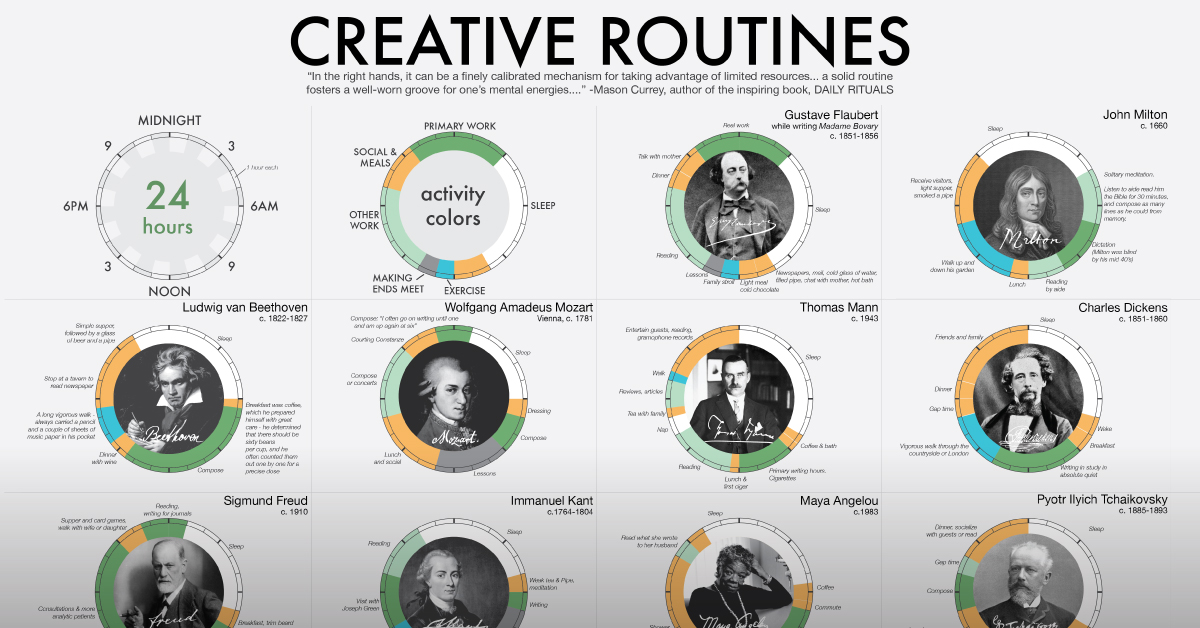
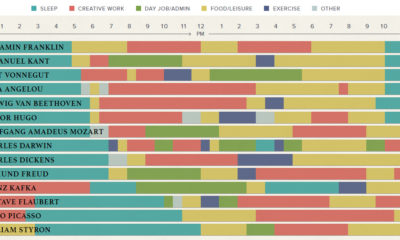
Visualized: The Daily Routines of Famous Creatives
Article/Editing:
View a higher resolution version of graphic.
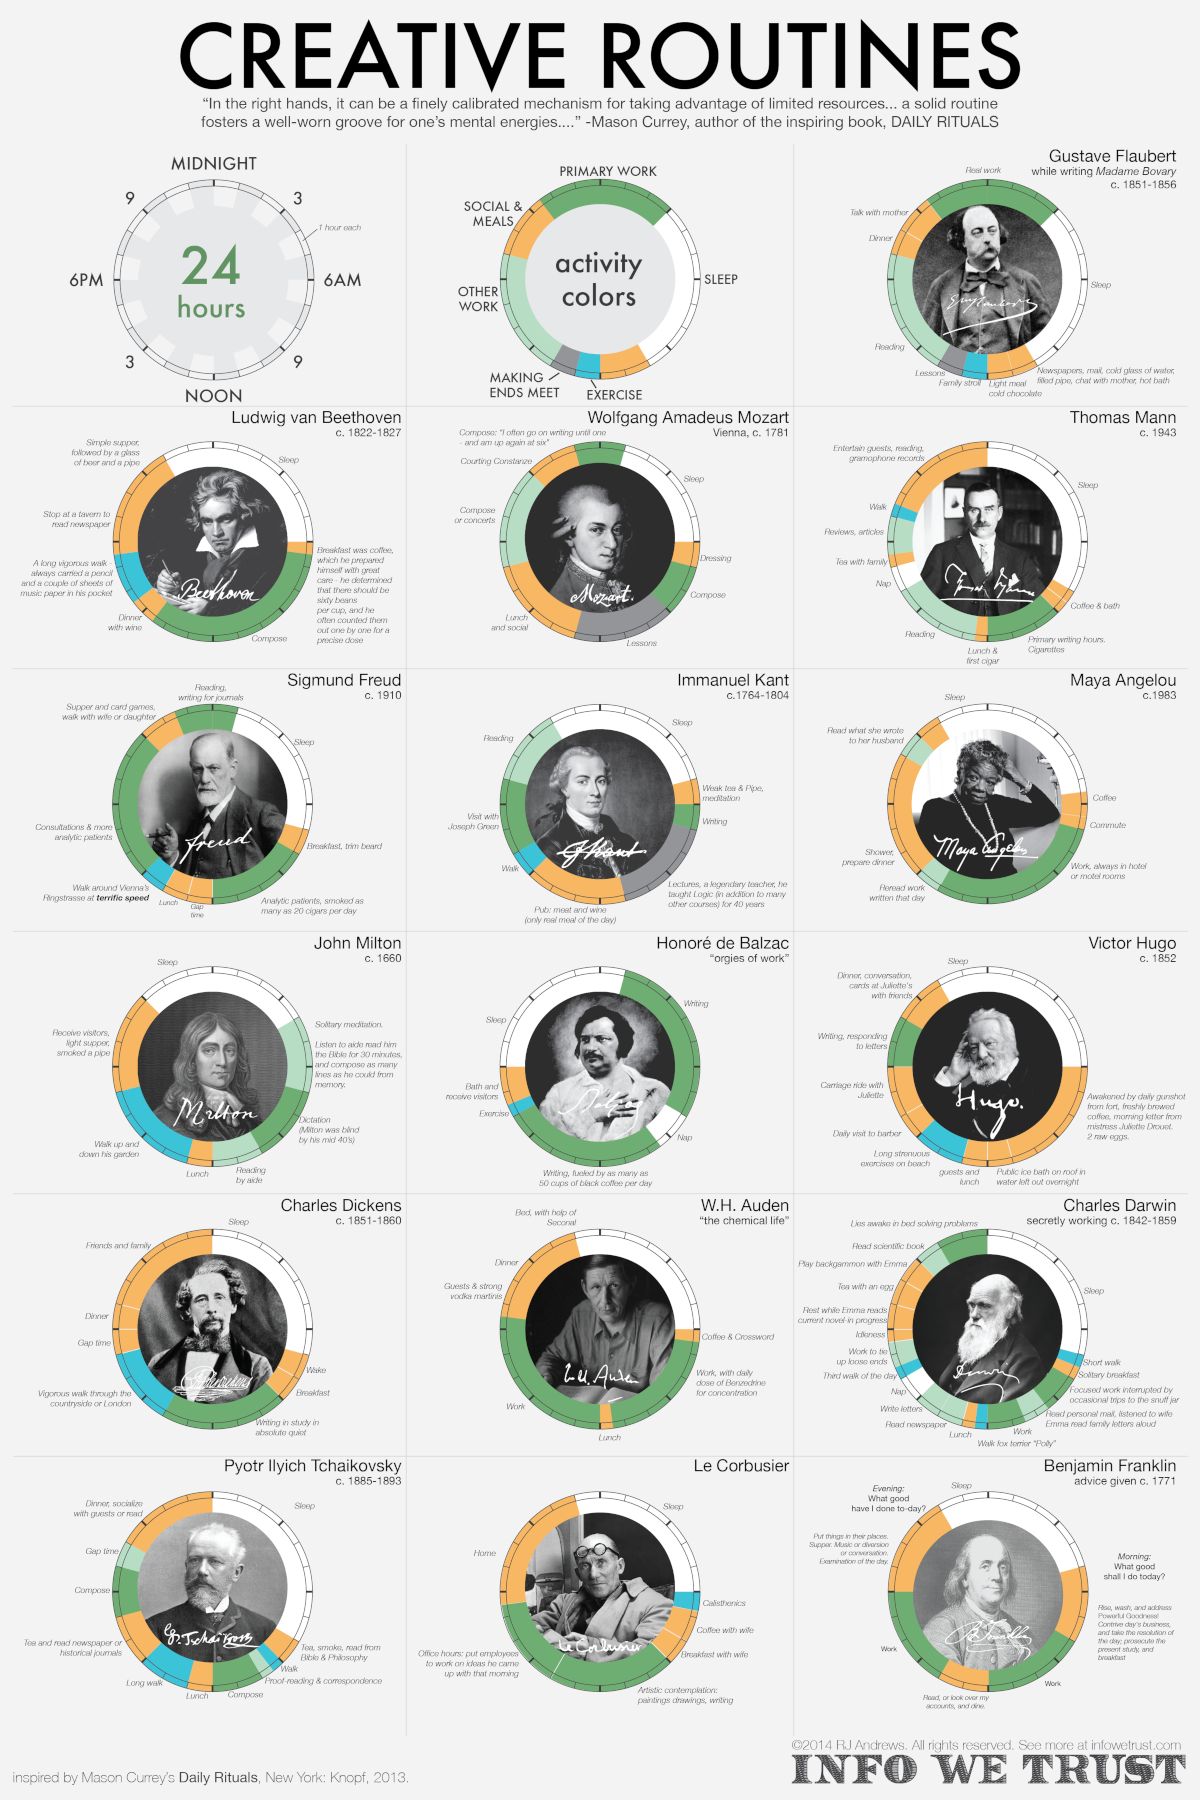
Visualized: The Daily Routines of Famous Creatives
What is the best daily routine to unlock creativity, or is there such a thing?
Many modern suggestions for optimizing creativity—like scheduling time for “deep work,” and building small, sustainable “atomic habits”—can be traced back to famous creatives in many different eras. And though they all found success, they employed different methods as well.
In this unique visualization, RJ Andrews from InfoWeTrust has charted how notable creatives in different fields spent their days. He picked 16 of the 161 “inspired minds” covered by Daily Rituals: How Artists Work, a book by writer and editor Mason Currey published in 2013.
How Much “Creativity Time” in Famous Daily Routines?
Dividing the day into 24 hours, Andrews denoted certain categories for daily activities like working creatively, sleeping, and other miscellaneous endeavors (meals, leisure, exercise, and social time).
For the creatives with a separate day job—Immanuel Kant and Wolfgang Amadeus Mozart—their ordinary labor is also counted in miscellaneous activities.
Below is a breakdown of the daily routine of all 16 people featured above:
| Name | Occupation | Creative (hrs) | Sleep (hrs) | Miscellaneous (hrs) |
|---|---|---|---|---|
| Maya Angelou | Writer/Poet | 9 | 7.5 | 7.5 |
| W.H. Auden | Poet | 11.5 | 7 | 5.5 |
| Honoré de Balzac | Novelist | 13.5 | 8.5 | 2 |
| L.V. Beethoven | Composer / Pianist | 8 | 8 | 8 |
| Le Corbusier | Architect | 8.5 | 7 | 8.5 |
| Charles Darwin | Naturalist / Biologist/ Geologist | 7 | 8 | 9 |
| Charles Dickens | Writer | 5 | 7 | 12 |
| Gustave Flaubert | Novelist | 10.5 | 7 | 6.5 |
| Sigmund Freud | Psychologist | 12.5 | 6 | 5.5 |
| Benjamin Franklin | Writer / Inventor / Scientist / Statesman | 8 | 7 | 9 |
| Victor Hugo | Writer | 2 | 8 | 14 |
| Immanuel Kant | Philosopher | 7 | 7 | 10 |
| Thomas Mann | Novelist | 8 | 8 | 8 |
| John Milton | Poet | 8 | 7 | 9 |
| W.A. Mozart | Composer / Pianist | 8 | 5 | 11 |
| P.I. Tchaikovsky | Composer | 4.5 | 8 | 11.5 |
The average and median amount of time spent on creative work for these individuals was just over 8 hours a day. At the extremes were two French novelists, Honoré de Balzac with 13.5 hours daily spent on creative work, and Victor Hugo with only 2 hours.
Interestingly, the allocation of creative work time was different in almost every daily routine. Maya Angelou’s routine resembles the modern work day, with the bulk of her writing between 7 a.m. to 2 p.m. Others like Kant and Mozart had creativity blocks when time allowed, such as before and after their teaching jobs.
Then there are outliers like Honoré de Balzac and Sigmund Freud, who worked as much as they could. Balzac wrote from 1:00 a.m. to 4:00 p.m. with just an hour and a half nap break in between, fueled by up to 50 cups of coffee. Freud split up his creative work into three different blocks: analyzing patients in the morning, consulting in the afternoon, and reading and writing journals into the late evening.
But somewhere in their days, most of these brilliant minds made sure to get a good rest, with an average of 7.25 hours of sleep across the board.
Schedule Yourself to Create Success
Creativity may ebb and flow, but these great minds had one clear thing in common: scheduling time for creative work.
The perfect daily routine was usually what fit in with their lifestyle (and their bodies), not based on an arbitrary amount of work. For example, night owls with later chronotypes worked late, while socialites and politicians found time outside of their commitments.
They also found time to move and enjoy life. Half of the people in the dataset specified exercise in their accounts—either leisurely strolls or fast walks. Many also scheduled social time with partners, friends, or children, often paired with a meal.
Perhaps the greatest insight, however, is that the day-to-day routine doesn’t have to look extraordinary to be able to create extraordinary work.

This article was published as a part of Visual Capitalist's Creator Program, which features data-driven visuals from some of our favorite Creators around the world.


Misc
How Hard Is It to Get Into an Ivy League School?
We detail the admission rates and average annual cost for Ivy League schools, as well as the median SAT scores required to be accepted.


How Hard Is It to Get Into an Ivy League School?
This was originally posted on our Voronoi app. Download the app for free on iOS or Android and discover incredible data-driven charts from a variety of trusted sources.
Ivy League institutions are renowned worldwide for their academic excellence and long-standing traditions. But how hard is it to get into one of the top universities in the U.S.?
In this graphic, we detail the admission rates and average annual cost for Ivy League schools, as well as the median SAT scores required to be accepted. The data comes from the National Center for Education Statistics and was compiled by 24/7 Wall St.
Note that “average annual cost” represents the net price a student pays after subtracting the average value of grants and/or scholarships received.
Harvard is the Most Selective
The SAT is a standardized test commonly used for college admissions in the United States. It’s taken by high school juniors and seniors to assess their readiness for college-level academic work.
When comparing SAT scores, Harvard and Dartmouth are among the most challenging universities to gain admission to. The median SAT scores for their students are 760 for reading and writing and 790 for math. Still, Harvard has half the admission rate (3.2%) compared to Dartmouth (6.4%).
| School | Admission rate (%) | SAT Score: Reading & Writing | SAT Score: Math | Avg Annual Cost* |
|---|---|---|---|---|
| Harvard University | 3.2 | 760 | 790 | $13,259 |
| Columbia University | 3.9 | 750 | 780 | $12,836 |
| Yale University | 4.6 | 760 | 780 | $16,341 |
| Brown University | 5.1 | 760 | 780 | $26,308 |
| Princeton University | 5.7 | 760 | 780 | $11,080 |
| Dartmouth College | 6.4 | 760 | 790 | $33,023 |
| University of Pennsylvania | 6.5 | 750 | 790 | $14,851 |
| Cornell University | 7.5 | 750 | 780 | $29,011 |
*Costs after receiving federal financial aid.
Additionally, Dartmouth has the highest average annual cost at $33,000. Princeton has the lowest at $11,100.
While student debt has surged in the United States in recent years, hitting $1.73 trillion in 2023, the worth of obtaining a degree from any of the schools listed surpasses mere academics. This is evidenced by the substantial incomes earned by former students.
Harvard grads, for example, have the highest average starting salary in the country, at $91,700.

-

 Real Estate2 weeks ago
Visualizing America’s Shortage of Affordable Homes
-

 Technology1 week ago
Ranked: Semiconductor Companies by Industry Revenue Share
-

 Money1 week ago
Which States Have the Highest Minimum Wage in America?
-

 Real Estate1 week ago
Ranked: The Most Valuable Housing Markets in America
-

 Business2 weeks ago
Charted: Big Four Market Share by S&P 500 Audits
-

 AI2 weeks ago
The Stock Performance of U.S. Chipmakers So Far in 2024
-

 Misc2 weeks ago
Almost Every EV Stock is Down After Q1 2024
-

 Money2 weeks ago
Where Does One U.S. Tax Dollar Go?