Demographics
Does a City’s Population Size Impact its Quality of Life?
Article/Editing:
var divElement = document.getElementById(‘viz1665749470138’); var vizElement = divElement.getElementsByTagName(‘object’)[0]; vizElement.style.width=’1200px’;vizElement.style.height=’4227px’; var scriptElement = document.createElement(‘script’); scriptElement.src = ‘https://public.tableau.com/javascripts/api/viz_v1.js’; vizElement.parentNode.insertBefore(scriptElement, vizElement);
Open the large interactive version here
Open the large interactive version here
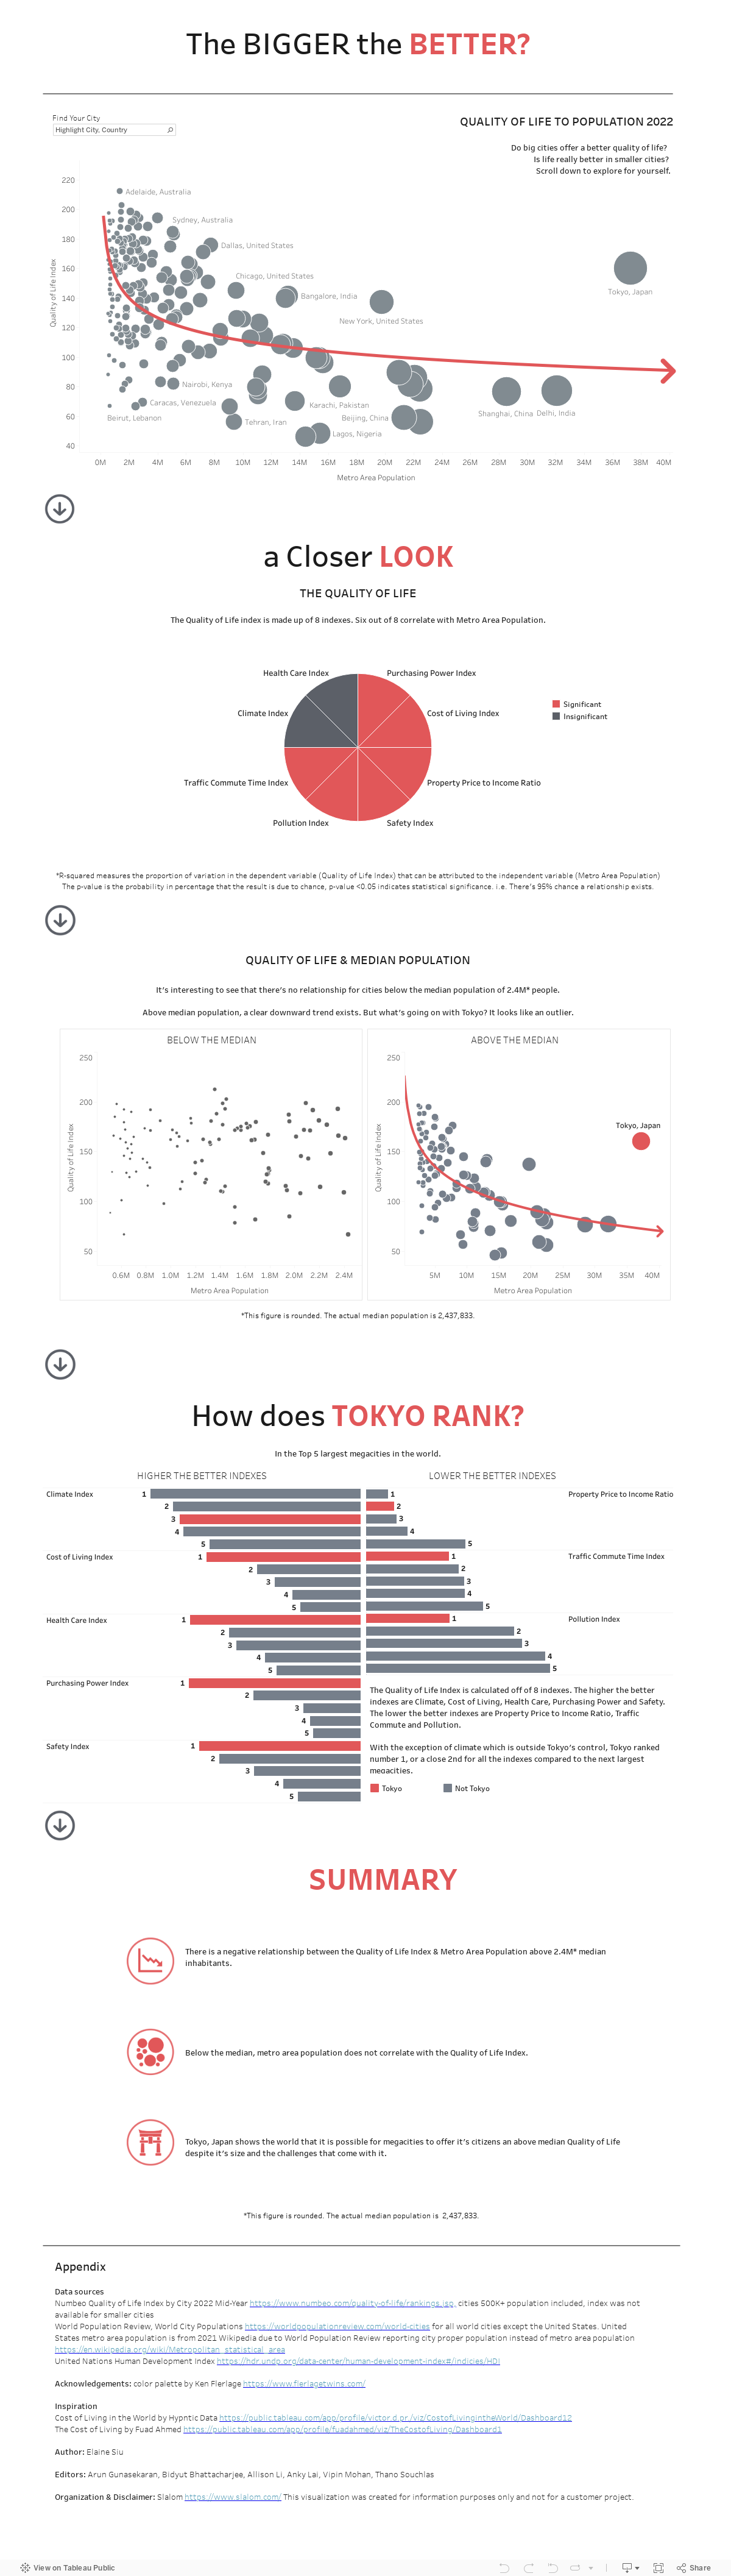
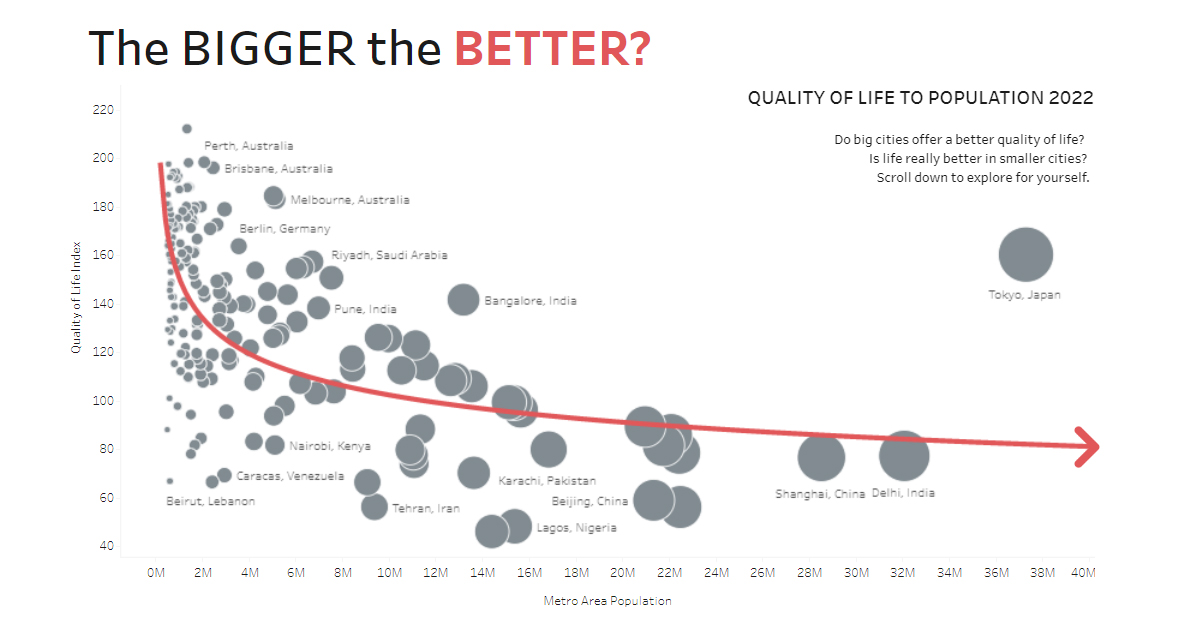
Does a City’s Population Size Impact its Quality of Life?
City living isn’t everyone’s cup of tea—the world’s most populous cities especially can be hectic, noisy, and busy.
Yet, despite the chaos of urban life, cities offer inhabitants a number of comforts and conveniences that are harder to find in smaller towns. That’s why more people are moving into urban areas around the world.
But do these conveniences reflect in people’s quality of lives?
According to research compiled by Elaine Siu, bigger doesn’t always mean better—at least when it comes to population size. This interactive visualization takes a deep dive into this dataset.
Measuring Quality of Life
Siu uses data from Numbeo’s 2022 Quality of Life Index to compare the quality of life in nearly 200 different cities around the world. For the purposes of this research, Siu used cities with metropolitan area populations of over 500,000.
The index measures quality of life using eight different metrics:
- Cost of Living
- Purchasing Power
- Property Price to Income Ratio
- Pollution
- Traffic Commute Time
- Safety
- Healthcare
- Climate
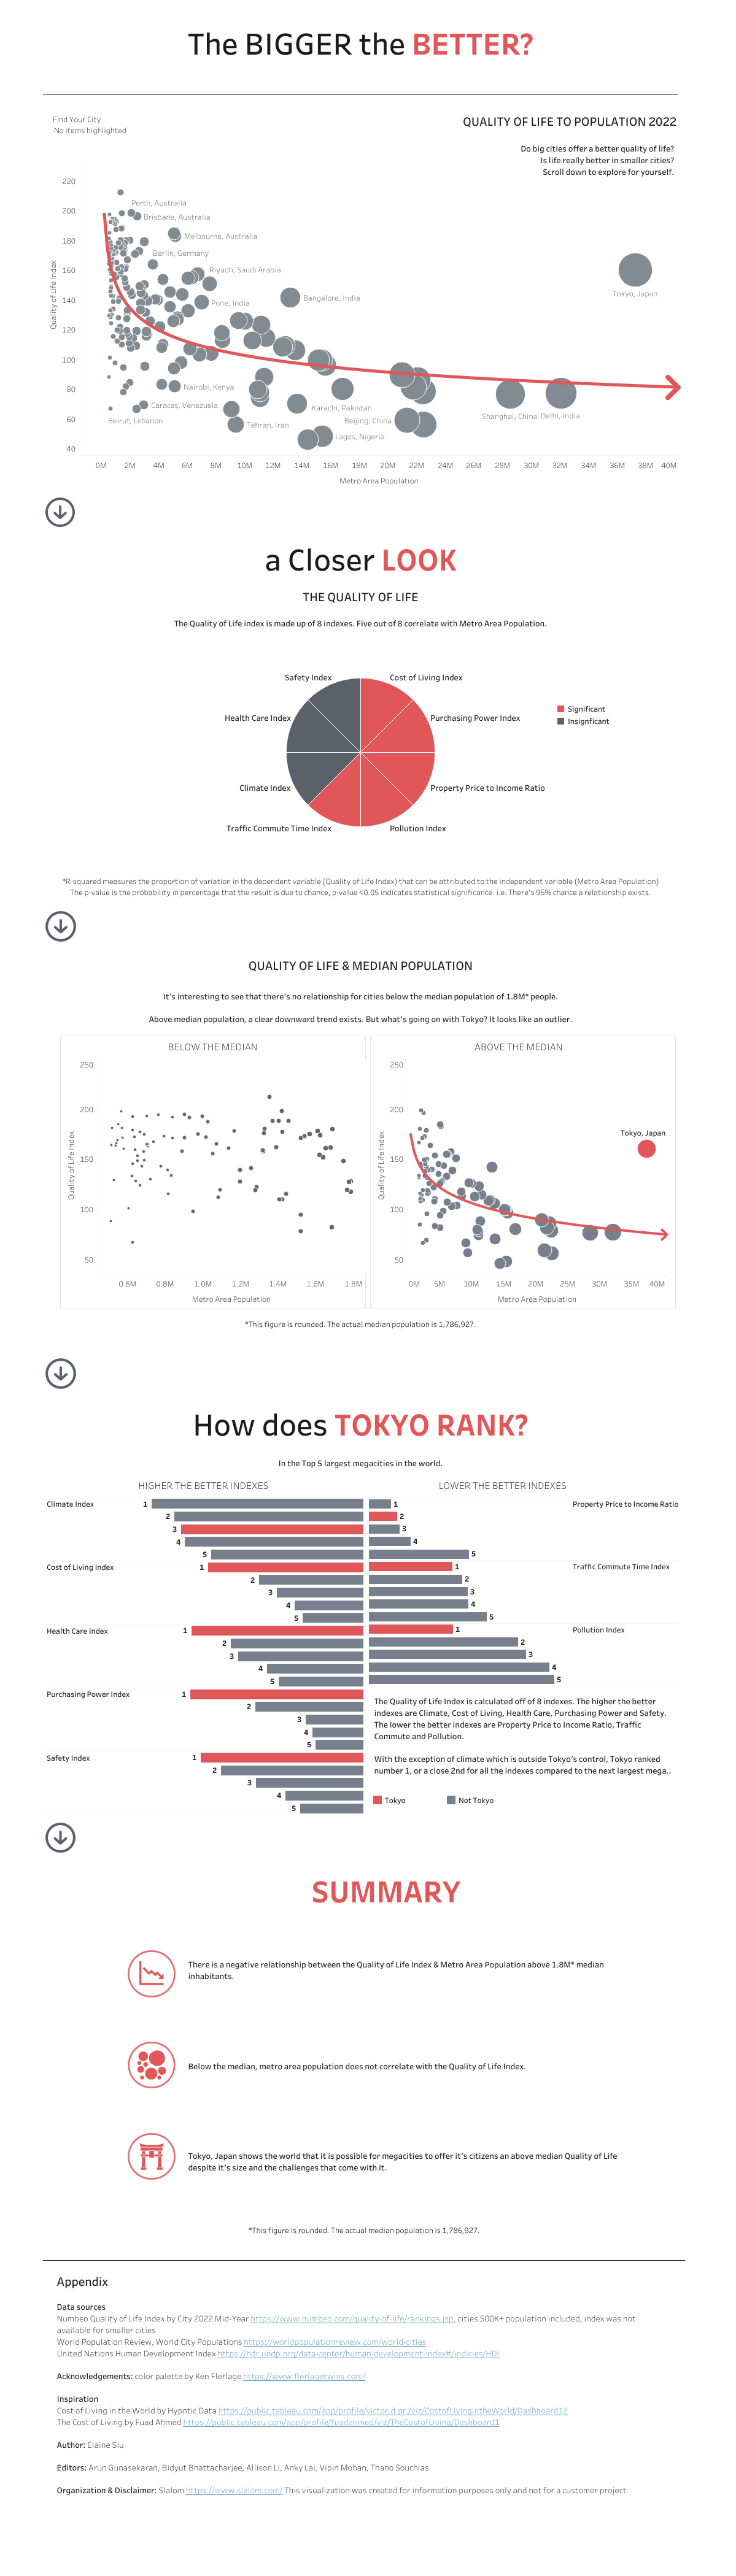
A majority of the metrics (six of the eight) seemed to correlate with population size, suggesting that the bigger a city’s population is, the lower its quality of life in those metrics.
Here’s a look at the full list of cities included in the study, along with their overall quality of life scores and their metro area populations:
| City | Quality of Life Index | Metro Area Population |
|---|---|---|
| Adelaide, Australia | 212.14 | 1,355,522 |
| The Hague (Den Haag), Netherlands | 204.88 | 709,388 |
| Perth, Australia | 198.37 | 2,092,649 |
| Zurich, Switzerland | 198.14 | 1,419,621 |
| Basel, Switzerland | 197.58 | 566,503 |
| Brisbane, Australia | 196.06 | 2,472,222 |
| Charlotte, NC, United States | 194.31 | 2,701,046 |
| Seattle, WA, United States | 194.3 | 4,018,762 |
| Oklahoma City, OK, United States | 192.79 | 1,441,647 |
| Austin, TX, United States | 192.56 | 2,352,426 |
| Geneva, Switzerland | 192.15 | 626,618 |
| Quebec City, Canada | 192.11 | 837,814 |
| Columbus, OH, United States | 191.34 | 2,151,017 |
| San Diego, CA, United States | 188.18 | 3,286,069 |
| San Antonio, TX, United States | 188.14 | 2,601,788 |
| Copenhagen, Denmark | 187.89 | 1,370,131 |
| San Jose, CA, United States | 187.16 | 1,952,185 |
| Edinburgh, United Kingdom | 185.01 | 548,206 |
| Sydney, Australia | 184.52 | 5,056,571 |
| Melbourne, Australia | 183.06 | 5,150,766 |
| Kansas City, MO, United States | 181.28 | 2,199,490 |
| Albuquerque, NM, United States | 181.09 | 918,259 |
| Helsinki, Finland | 180.21 | 1,327,762 |
| Vienna, Austria | 180.01 | 1,960,023 |
| Glasgow, United Kingdom | 179.79 | 1,688,907 |
| Gothenburg, Sweden | 179.12 | 624,780 |
| Dubai, United Arab Emirates | 178.96 | 2,964,382 |
| Calgary, Canada | 178.34 | 1,611,475 |
| Amsterdam, Netherlands | 178.17 | 1,165,898 |
| Ottawa, Canada | 177.09 | 1,422,635 |
| Portland, OR, United States | 176.92 | 2,511,612 |
| Dallas, TX, United States | 175.71 | 7,759,615 |
| Jacksonville, FL, United States | 175.25 | 1,637,666 |
| Munich, Germany | 174.98 | 1,566,128 |
| Boston, MA, United States | 174.52 | 4,899,932 |
| Muscat, Oman | 174.07 | 1,622,620 |
| Abu Dhabi, United Arab Emirates | 173.13 | 1,539,830 |
| Frankfurt, Germany | 173.06 | 791,232 |
| Vancouver, Canada | 172.66 | 2,631,690 |
| Stuttgart, Germany | 172 | 634,740 |
| Rotterdam, Netherlands | 171.72 | 1,014,675 |
| Milwaukee, WI, United States | 171.44 | 1,566,487 |
| Edmonton, Canada | 171.23 | 1,518,921 |
| Indianapolis, IN, United States | 171.2 | 2,126,804 |
| Houston, TX, United States | 170.9 | 7,206,841 |
| Valencia, Spain | 170.88 | 836,857 |
| Tucson, AZ, United States | 168.76 | 1,052,030 |
| Denver, CO, United States | 167.36 | 2,972,566 |
| Hamburg, Germany | 166.71 | 1,788,170 |
| Vilnius, Lithuania | 165.74 | 540,775 |
| Oslo, Norway | 164.94 | 1,071,062 |
| Nashville, TN, United States | 164.87 | 2,012,476 |
| Bristol, United Kingdom | 164.74 | 700,630 |
| Atlanta, GA, United States | 163.99 | 6,144,050 |
| Berlin, Germany | 163.74 | 3,570,750 |
| Sacramento, CA, United States | 163.54 | 2,411,428 |
| Washington, DC, United States | 162.88 | 6,356,434 |
| Queretaro, Mexico | 162.06 | 1,389,302 |
| Stockholm, Sweden | 161.54 | 1,679,050 |
| Auckland, New Zealand | 161 | 1,652,341 |
| Cologne, Germany | 160.82 | 1,136,992 |
| Baltimore, MD, United States | 160.36 | 2,838,327 |
| Tokyo, Japan | 160.27 | 37,274,000 |
| Belfast, United Kingdom | 159.26 | 638,717 |
| Prague, Czech Republic | 158.87 | 1,318,085 |
| San Francisco, CA, United States | 157.57 | 4,623,264 |
| Zagreb, Croatia | 157.5 | 684,254 |
| Madrid, Spain | 157.33 | 6,713,557 |
| Porto, Portugal | 157.26 | 1,320,347 |
| Antwerp, Belgium | 155.3 | 1,052,622 |
| Toronto, Canada | 155.02 | 6,312,974 |
| Singapore, Singapore | 154.54 | 6,039,577 |
| Philadelphia, PA, United States | 154.13 | 6,228,601 |
| Montreal, Canada | 153.76 | 4,276,526 |
| Doha, Qatar | 153.1 | 651,799 |
| Phoenix, AZ, United States | 151.95 | 4,946,145 |
| Riyadh, Saudi Arabia | 150.72 | 7,538,200 |
| Lisbon, Portugal | 150.09 | 2,986,162 |
| Birmingham, United Kingdom | 149.32 | 2,645,598 |
| Manama, Bahrain | 148.96 | 688,558 |
| Lyon, France | 148.34 | 1,747,575 |
| Las Vegas, NV, United States | 148.17 | 2,292,476 |
| Tel Aviv-Yafo, Israel | 147.84 | 4,343,584 |
| Manchester, United Kingdom | 147.47 | 2,770,434 |
| Riga, Latvia | 145.54 | 624,925 |
| Bursa, Turkey | 145.27 | 2,054,748 |
| Cape Town, South Africa | 145.05 | 4,800,954 |
| Chicago, IL, United States | 144.81 | 9,509,934 |
| Jeddah (Jiddah), Saudi Arabia | 144.4 | 4,780,740 |
| Barcelona, Spain | 143.73 | 5,658,472 |
| Brussels, Belgium | 143.12 | 2,109,631 |
| Genoa, Italy | 142.82 | 675,464 |
| Coimbatore, India | 142.77 | 2,934,621 |
| Hamilton, Canada | 142.74 | 775,751 |
| Bangalore, India | 141.67 | 13,193,035 |
| Dublin, Ireland | 140.93 | 1,255,963 |
| Curitiba, Brazil | 140.07 | 3,770,919 |
| Los Angeles, CA, United States | 139.75 | 12,997,353 |
| Nizhny Novgorod, Russia | 139.25 | 1,252,917 |
| Durban, South Africa | 139.09 | 3,199,329 |
| Islamabad, Pakistan | 139 | 1,198,035 |
| Bologna, Italy | 139 | 811,707 |
| Pune, India | 138.28 | 6,987,077 |
| Taipei, Taiwan | 137.81 | 2,742,379 |
| New York, NY, United States | 137.32 | 19,768,458 |
| Brasilia, Brazil | 135.44 | 4,803,877 |
| Winnipeg, Canada | 133.69 | 832,944 |
| Pretoria, South Africa | 133.25 | 2,739,768 |
| Warsaw, Poland | 133.21 | 1,794,532 |
| Detroit, MI, United States | 133.05 | 4,365,205 |
| Johannesburg, South Africa | 132.58 | 6,065,354 |
| Izmir, Turkey | 131.52 | 3,056,149 |
| Turin, Italy | 131.35 | 1,798,471 |
| Lviv, Ukraine | 129.85 | 721,383 |
| Poznan, Poland | 129.38 | 525,919 |
| Wroclaw, Poland | 128.45 | 642,497 |
| Guadalajara, Mexico | 128.14 | 5,339,583 |
| Chiang Mai, Thailand | 127.81 | 1,197,931 |
| Sharjah, United Arab Emirates | 127.77 | 1,785,684 |
| Budapest, Hungary | 127.23 | 1,775,207 |
| Ankara, Turkey | 126.93 | 5,309,690 |
| London, United Kingdom | 126.14 | 9,540,576 |
| Monterrey, Mexico | 125.76 | 5,036,535 |
| Campinas, Brazil | 125.75 | 3,384,564 |
| Seoul, South Korea | 125.66 | 9,975,709 |
| Lodz, Poland | 124 | 666,032 |
| Krakow (Cracow), Poland | 123.44 | 769,595 |
| Paris, France | 123.02 | 11,142,303 |
| Sofia, Bulgaria | 122.03 | 1,286,789 |
| Medellin, Colombia | 121.78 | 4,067,758 |
| Montevideo, Uruguay | 119.58 | 1,767,243 |
| Yerevan, Armenia | 119.46 | 1,092,028 |
| San Juan, Puerto Rico | 118.97 | 2,442,512 |
| Florianopolis, Brazil | 118.92 | 1,277,547 |
| Milan, Italy | 118.57 | 3,149,223 |
| Kuala Lumpur, Malaysia | 117.7 | 8,419,566 |
| Bucharest, Romania | 117.58 | 1,785,294 |
| Kuwait City, Kuwait | 116.64 | 3,238,523 |
| Athens, Greece | 115.69 | 3,153,781 |
| Quito, Ecuador | 115.33 | 1,928,296 |
| Thessaloniki, Greece | 115.32 | 813,793 |
| San Jose, Costa Rica | 115.02 | 1,441,324 |
| Chennai, India | 114.51 | 11,503,293 |
| Amman, Jordan | 114.37 | 2,209,584 |
| Ahmedabad, India | 113.04 | 8,450,228 |
| Hyderabad, India | 112.53 | 10,534,418 |
| Tbilisi, Georgia | 112.19 | 1,080,349 |
| Panama City, Panama | 110.94 | 1,937,963 |
| Rome, Italy | 109.98 | 4,297,877 |
| Belgrade, Serbia | 109.82 | 1,405,192 |
| Kharkiv, Ukraine | 109.51 | 1,423,343 |
| Shenzhen, China | 109.11 | 12,831,330 |
| Baku, Azerbaijan | 109.1 | 2,401,108 |
| Moscow, Russia | 108.32 | 12,640,818 |
| Minsk, Belarus | 107.79 | 2,048,574 |
| Porto Alegre, Brazil | 107.74 | 4,185,488 |
| Belo Horizonte, Brazil | 107.2 | 6,194,292 |
| Kiev (Kyiv), Ukraine | 106.88 | 3,010,209 |
| Odessa (Odesa), Ukraine | 106.41 | 1,007,989 |
| Lahore, Pakistan | 106.01 | 13,541,764 |
| Hong Kong, Hong Kong | 103.85 | 7,643,256 |
| Santiago, Chile | 103.1 | 6,856,939 |
| Skopje, North Macedonia | 101.02 | 605,996 |
| Kolkata, India | 99.37 | 15,133,888 |
| Buenos Aires, Argentina | 99.23 | 15,369,919 |
| Saint Petersburg, Russia | 97.91 | 5,535,556 |
| Dnipro, Ukraine | 97.76 | 946,574 |
| Istanbul, Turkey | 96.13 | 15,636,243 |
| Guatemala City, Guatemala | 95.46 | 3,036,405 |
| Yekaterinburg, Russia | 94.29 | 1,521,136 |
| Hanoi, Vietnam | 93.75 | 5,067,352 |
| Mumbai, India | 89.39 | 20,961,472 |
| Bogota, Colombia | 88.27 | 11,344,312 |
| Tirana, Albania | 88.09 | 511,559 |
| Mexico City, Mexico | 85.94 | 22,085,140 |
| Almaty, Kazakhstan | 84.53 | 1,958,135 |
| Recife, Brazil | 83.22 | 4,220,458 |
| Nairobi, Kenya | 81.75 | 5,118,844 |
| Novosibirsk, Russia | 81.71 | 1,686,236 |
| Cairo, Egypt | 81.6 | 21,750,020 |
| Karachi, Pakistan | 79.91 | 16,839,950 |
| Bangkok, Thailand | 79.74 | 10,899,698 |
| Sao Paulo, Brazil | 78.54 | 22,429,800 |
| Kathmandu, Nepal | 78.08 | 1,521,057 |
| Lima, Peru | 77.67 | 11,044,607 |
| Delhi, India | 77.27 | 32,065,760 |
| Shanghai, China | 76.62 | 28,516,904 |
| Jakarta, Indonesia | 74.13 | 11,074,811 |
| Rio de Janeiro, Brazil | 70.28 | 13,634,274 |
| Caracas, Venezuela | 69.32 | 2,956,813 |
| Colombo, Sri Lanka | 66.85 | 625,637 |
| Beirut, Lebanon | 66.54 | 2,433,155 |
| Ho Chi Minh City, Vietnam | 66.41 | 9,077,158 |
| Beijing, China | 58.96 | 21,333,332 |
| Tehran, Iran | 56.28 | 9,381,546 |
| Dhaka, Bangladesh | 56.18 | 22,478,116 |
| Lagos, Nigeria | 48.22 | 15,387,639 |
| Manila, Philippines | 46.08 | 14,406,059 |
It’s worth noting that the negative correlation between the quality of life and population size only appeared in cities above the median population of 2.4 million people, indicating that the size of a city doesn’t appear to impact quality of life until a certain tipping point. Then, above the median, there’s a blatant downward trend.
However, Tokyo is an anomaly—its quality of life is much higher than it’s metropolitan population would predict.
Zooming in on Tokyo
Despite being the world’s largest urban area, Tokyo compares favorably compared to other top megacities across the index. When ranked among the top five megacities, it places in first for Purchasing Power, Safety, Traffic Commute Time, Cost of Living, Healthcare, and Pollution.
What’s so special about Tokyo? One major thing going for the Japanese city is its immaculate public transport system. The city’s transport is so efficient, the city’s rail service once issued a public apology after a train left the station 25 seconds earlier than its scheduled departure.
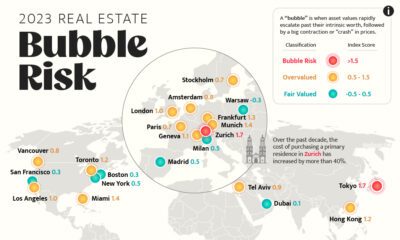
Another factor that makes Tokyo so livable is its relatively affordable housing, at least compared to other big cities like New York and Hong Kong. This is partly because of the city’s flexible land zoning system, which makes it relatively easy for developers to build housing and mix-use communities.
As our world becomes increasingly more urbanized, and cities around the world continue to increase in size, will they be able to emulate Tokyo’s growth? And if not, what other city design trends and innovations can cities utilize to raise quality of live?

This article was published as a part of Visual Capitalist's Creator Program, which features data-driven visuals from some of our favorite Creators around the world.


Demographics
The Smallest Gender Wage Gaps in OECD Countries
Which OECD countries have the smallest gender wage gaps? We look at the 10 countries with gaps lower than the average.


The Smallest Gender Pay Gaps in OECD Countries
This was originally posted on our Voronoi app. Download the app for free on iOS or Android and discover incredible data-driven charts from a variety of trusted sources.
Among the 38 member countries in the Organization for Economic Cooperation and Development (OECD), several have made significant strides in addressing income inequality between men and women.
In this graphic we’ve ranked the OECD countries with the 10 smallest gender pay gaps, using the latest data from the OECD for 2022.
The gender pay gap is calculated as the difference between median full-time earnings for men and women divided by the median full-time earnings of men.
Which Countries Have the Smallest Gender Pay Gaps?
Luxembourg’s gender pay gap is the lowest among OECD members at only 0.4%—well below the OECD average of 11.6%.
| Rank | Country | Percentage Difference in Men's & Women's Full-time Earnings |
|---|---|---|
| 1 | 🇱🇺 Luxembourg | 0.4% |
| 2 | 🇧🇪 Belgium | 1.1% |
| 3 | 🇨🇷 Costa Rica | 1.4% |
| 4 | 🇨🇴 Colombia | 1.9% |
| 5 | 🇮🇪 Ireland | 2.0% |
| 6 | 🇭🇷 Croatia | 3.2% |
| 7 | 🇮🇹 Italy | 3.3% |
| 8 | 🇳🇴 Norway | 4.5% |
| 9 | 🇩🇰 Denmark | 5.8% |
| 10 | 🇵🇹 Portugal | 6.1% |
| OECD Average | 11.6% |
Notably, eight of the top 10 countries with the smallest gender pay gaps are located in Europe, as labor equality laws designed to target gender differences have begun to pay off.
The two other countries that made the list were Costa Rica (1.4%) and Colombia (1.9%), which came in third and fourth place, respectively.
How Did Luxembourg (Nearly) Eliminate its Gender Wage Gap?
Luxembourg’s virtually-non-existent gender wage gap in 2020 can be traced back to its diligent efforts to prioritize equal pay. Since 2016, firms that have not complied with the Labor Code’s equal pay laws have been subjected to penalizing fines ranging from €251 to €25,000.
Higher female education rates also contribute to the diminishing pay gap, with Luxembourg tied for first in the educational attainment rankings of the World Economic Forum’s Global Gender Gap Index Report for 2023.
See More Graphics about Demographics and Money
While these 10 countries are well below the OECD’s average gender pay gap of 11.6%, many OECD member countries including the U.S. are significantly above the average. To see the full list of the top 10 OECD countries with the largest gender pay gaps, check out this visualization.

-

 Real Estate2 weeks ago
Visualizing America’s Shortage of Affordable Homes
-

 Technology1 week ago
Ranked: Semiconductor Companies by Industry Revenue Share
-

 Money1 week ago
Which States Have the Highest Minimum Wage in America?
-

 Real Estate1 week ago
Ranked: The Most Valuable Housing Markets in America
-

 Business2 weeks ago
Charted: Big Four Market Share by S&P 500 Audits
-

 AI2 weeks ago
The Stock Performance of U.S. Chipmakers So Far in 2024
-

 Misc2 weeks ago
Almost Every EV Stock is Down After Q1 2024
-

 Money2 weeks ago
Where Does One U.S. Tax Dollar Go?