Demographics
Does a City’s Population Size Impact its Quality of Life?
Article/Editing:
var divElement = document.getElementById(‘viz1665749470138’); var vizElement = divElement.getElementsByTagName(‘object’)[0]; vizElement.style.width=’1200px’;vizElement.style.height=’4227px’; var scriptElement = document.createElement(‘script’); scriptElement.src = ‘https://public.tableau.com/javascripts/api/viz_v1.js’; vizElement.parentNode.insertBefore(scriptElement, vizElement);
Open the large interactive version here
Open the large interactive version here
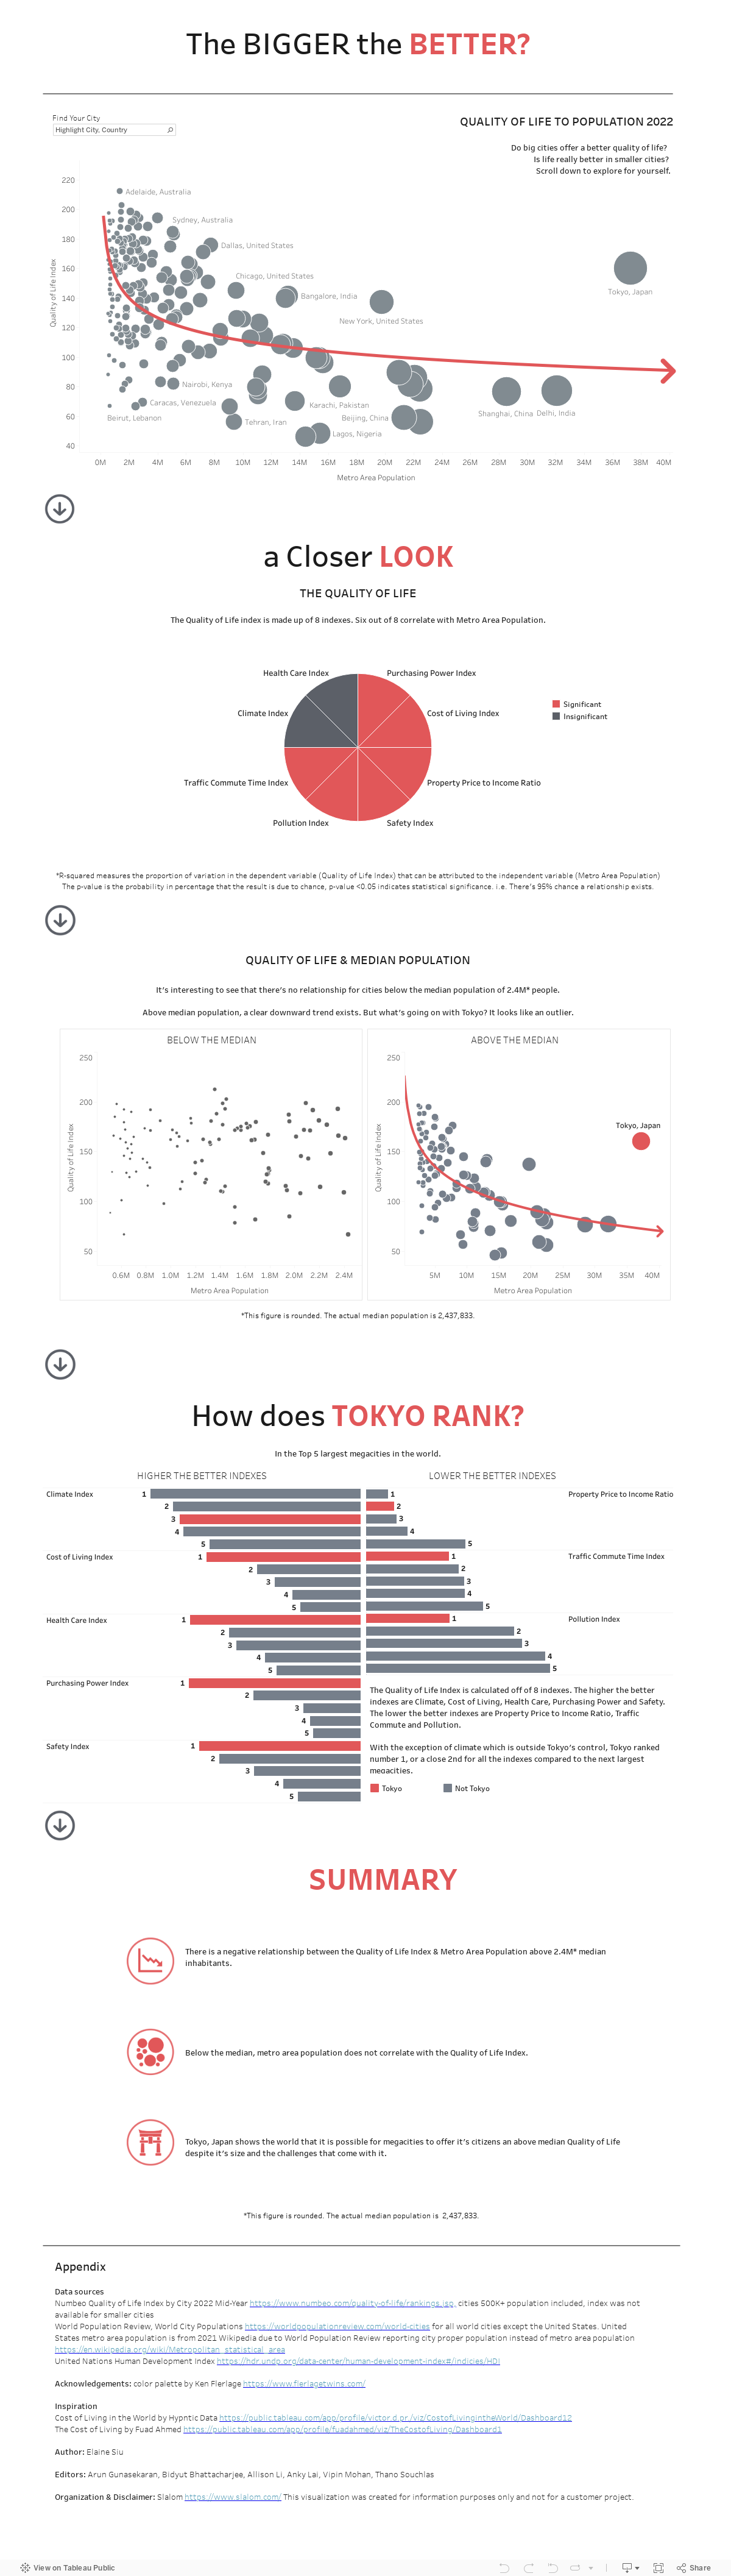
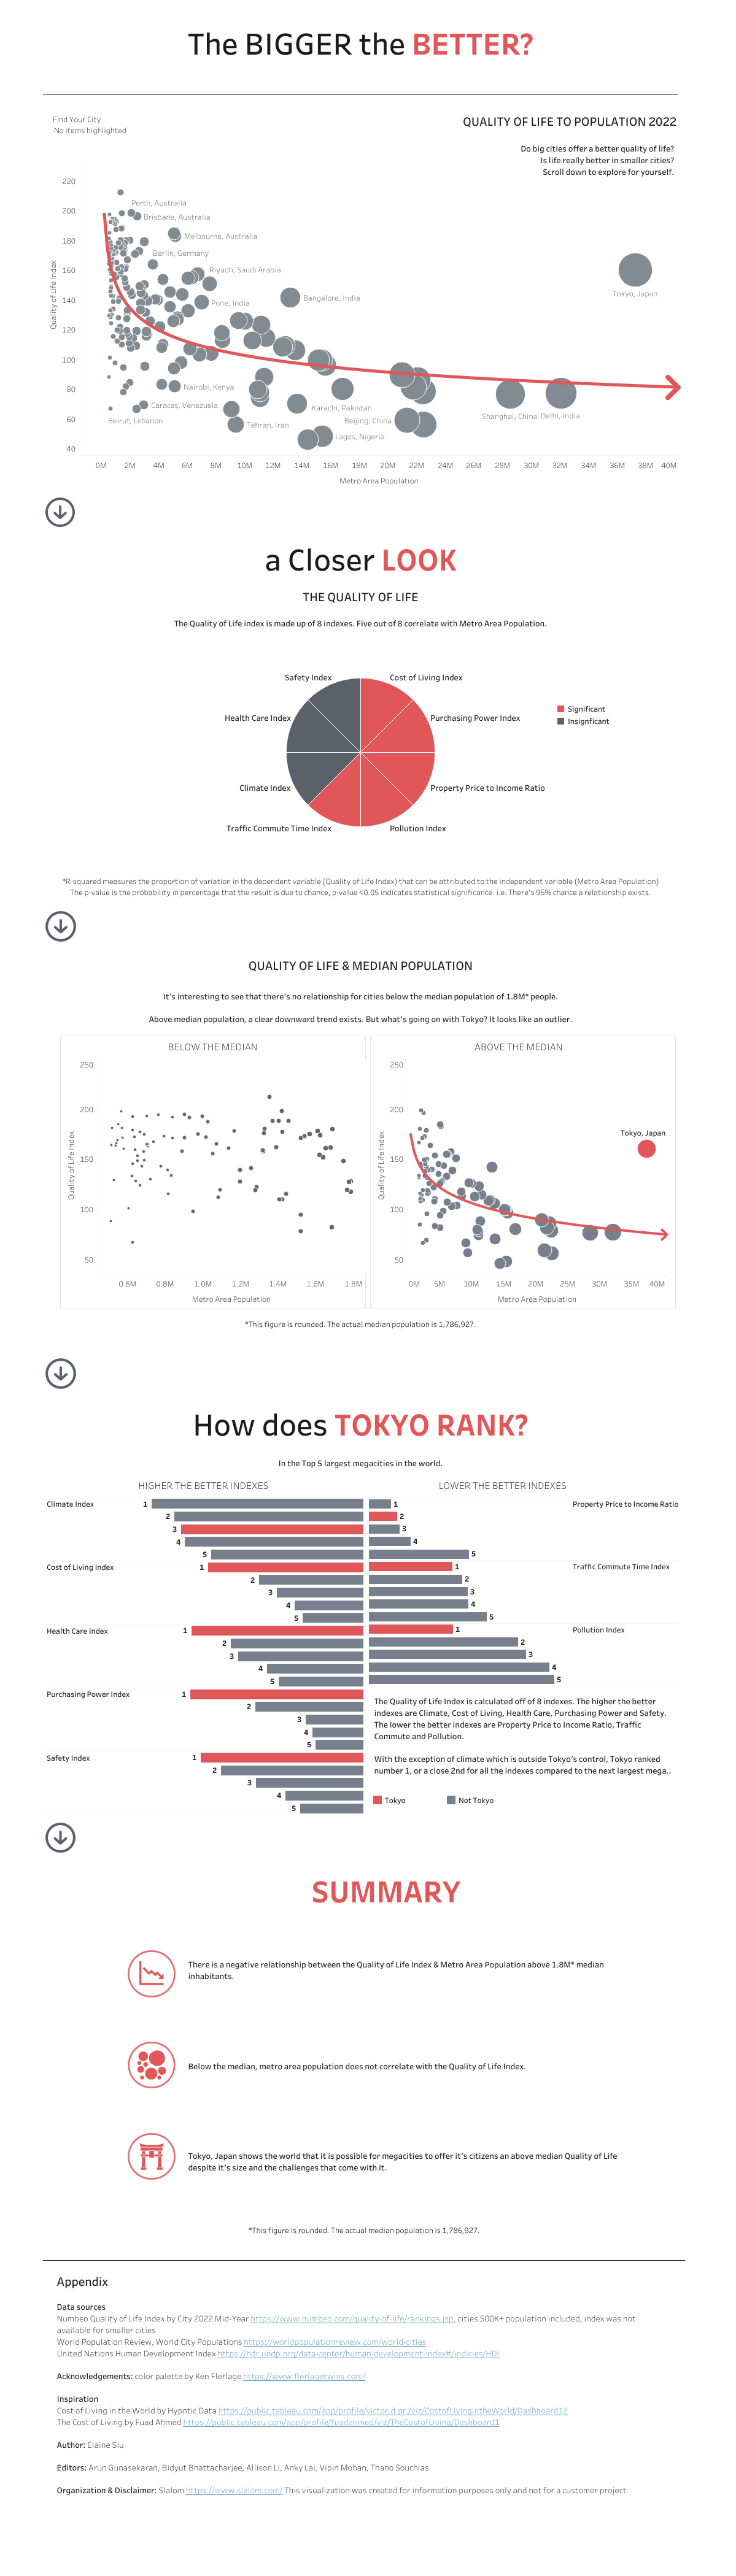
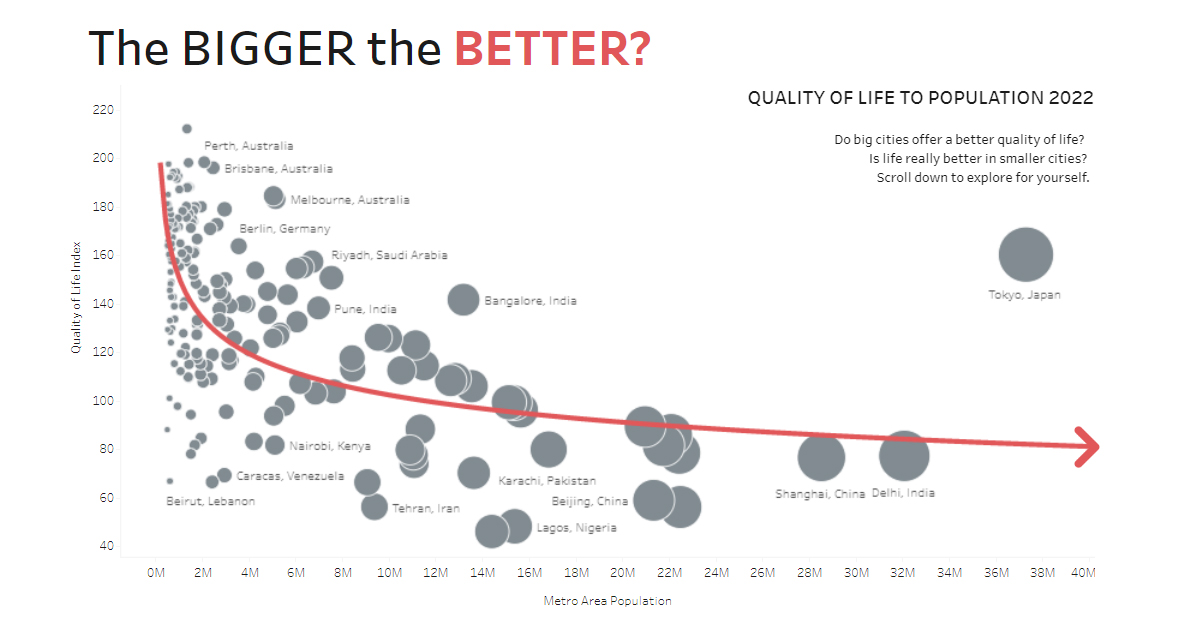
Does a City’s Population Size Impact its Quality of Life?
City living isn’t everyone’s cup of tea—the world’s most populous cities especially can be hectic, noisy, and busy.
Yet, despite the chaos of urban life, cities offer inhabitants a number of comforts and conveniences that are harder to find in smaller towns. That’s why more people are moving into urban areas around the world.
But do these conveniences reflect in people’s quality of lives?
According to research compiled by Elaine Siu, bigger doesn’t always mean better—at least when it comes to population size. This interactive visualization takes a deep dive into this dataset.
Measuring Quality of Life
Siu uses data from Numbeo’s 2022 Quality of Life Index to compare the quality of life in nearly 200 different cities around the world. For the purposes of this research, Siu used cities with metropolitan area populations of over 500,000.
The index measures quality of life using eight different metrics:
- Cost of Living
- Purchasing Power
- Property Price to Income Ratio
- Pollution
- Traffic Commute Time
- Safety
- Healthcare
- Climate
A majority of the metrics (six of the eight) seemed to correlate with population size, suggesting that the bigger a city’s population is, the lower its quality of life in those metrics.
Here’s a look at the full list of cities included in the study, along with their overall quality of life scores and their metro area populations:
| City | Quality of Life Index | Metro Area Population |
|---|---|---|
| Adelaide, Australia | 212.14 | 1,355,522 |
| The Hague (Den Haag), Netherlands | 204.88 | 709,388 |
| Perth, Australia | 198.37 | 2,092,649 |
| Zurich, Switzerland | 198.14 | 1,419,621 |
| Basel, Switzerland | 197.58 | 566,503 |
| Brisbane, Australia | 196.06 | 2,472,222 |
| Charlotte, NC, United States | 194.31 | 2,701,046 |
| Seattle, WA, United States | 194.3 | 4,018,762 |
| Oklahoma City, OK, United States | 192.79 | 1,441,647 |
| Austin, TX, United States | 192.56 | 2,352,426 |
| Geneva, Switzerland | 192.15 | 626,618 |
| Quebec City, Canada | 192.11 | 837,814 |
| Columbus, OH, United States | 191.34 | 2,151,017 |
| San Diego, CA, United States | 188.18 | 3,286,069 |
| San Antonio, TX, United States | 188.14 | 2,601,788 |
| Copenhagen, Denmark | 187.89 | 1,370,131 |
| San Jose, CA, United States | 187.16 | 1,952,185 |
| Edinburgh, United Kingdom | 185.01 | 548,206 |
| Sydney, Australia | 184.52 | 5,056,571 |
| Melbourne, Australia | 183.06 | 5,150,766 |
| Kansas City, MO, United States | 181.28 | 2,199,490 |
| Albuquerque, NM, United States | 181.09 | 918,259 |
| Helsinki, Finland | 180.21 | 1,327,762 |
| Vienna, Austria | 180.01 | 1,960,023 |
| Glasgow, United Kingdom | 179.79 | 1,688,907 |
| Gothenburg, Sweden | 179.12 | 624,780 |
| Dubai, United Arab Emirates | 178.96 | 2,964,382 |
| Calgary, Canada | 178.34 | 1,611,475 |
| Amsterdam, Netherlands | 178.17 | 1,165,898 |
| Ottawa, Canada | 177.09 | 1,422,635 |
| Portland, OR, United States | 176.92 | 2,511,612 |
| Dallas, TX, United States | 175.71 | 7,759,615 |
| Jacksonville, FL, United States | 175.25 | 1,637,666 |
| Munich, Germany | 174.98 | 1,566,128 |
| Boston, MA, United States | 174.52 | 4,899,932 |
| Muscat, Oman | 174.07 | 1,622,620 |
| Abu Dhabi, United Arab Emirates | 173.13 | 1,539,830 |
| Frankfurt, Germany | 173.06 | 791,232 |
| Vancouver, Canada | 172.66 | 2,631,690 |
| Stuttgart, Germany | 172 | 634,740 |
| Rotterdam, Netherlands | 171.72 | 1,014,675 |
| Milwaukee, WI, United States | 171.44 | 1,566,487 |
| Edmonton, Canada | 171.23 | 1,518,921 |
| Indianapolis, IN, United States | 171.2 | 2,126,804 |
| Houston, TX, United States | 170.9 | 7,206,841 |
| Valencia, Spain | 170.88 | 836,857 |
| Tucson, AZ, United States | 168.76 | 1,052,030 |
| Denver, CO, United States | 167.36 | 2,972,566 |
| Hamburg, Germany | 166.71 | 1,788,170 |
| Vilnius, Lithuania | 165.74 | 540,775 |
| Oslo, Norway | 164.94 | 1,071,062 |
| Nashville, TN, United States | 164.87 | 2,012,476 |
| Bristol, United Kingdom | 164.74 | 700,630 |
| Atlanta, GA, United States | 163.99 | 6,144,050 |
| Berlin, Germany | 163.74 | 3,570,750 |
| Sacramento, CA, United States | 163.54 | 2,411,428 |
| Washington, DC, United States | 162.88 | 6,356,434 |
| Queretaro, Mexico | 162.06 | 1,389,302 |
| Stockholm, Sweden | 161.54 | 1,679,050 |
| Auckland, New Zealand | 161 | 1,652,341 |
| Cologne, Germany | 160.82 | 1,136,992 |
| Baltimore, MD, United States | 160.36 | 2,838,327 |
| Tokyo, Japan | 160.27 | 37,274,000 |
| Belfast, United Kingdom | 159.26 | 638,717 |
| Prague, Czech Republic | 158.87 | 1,318,085 |
| San Francisco, CA, United States | 157.57 | 4,623,264 |
| Zagreb, Croatia | 157.5 | 684,254 |
| Madrid, Spain | 157.33 | 6,713,557 |
| Porto, Portugal | 157.26 | 1,320,347 |
| Antwerp, Belgium | 155.3 | 1,052,622 |
| Toronto, Canada | 155.02 | 6,312,974 |
| Singapore, Singapore | 154.54 | 6,039,577 |
| Philadelphia, PA, United States | 154.13 | 6,228,601 |
| Montreal, Canada | 153.76 | 4,276,526 |
| Doha, Qatar | 153.1 | 651,799 |
| Phoenix, AZ, United States | 151.95 | 4,946,145 |
| Riyadh, Saudi Arabia | 150.72 | 7,538,200 |
| Lisbon, Portugal | 150.09 | 2,986,162 |
| Birmingham, United Kingdom | 149.32 | 2,645,598 |
| Manama, Bahrain | 148.96 | 688,558 |
| Lyon, France | 148.34 | 1,747,575 |
| Las Vegas, NV, United States | 148.17 | 2,292,476 |
| Tel Aviv-Yafo, Israel | 147.84 | 4,343,584 |
| Manchester, United Kingdom | 147.47 | 2,770,434 |
| Riga, Latvia | 145.54 | 624,925 |
| Bursa, Turkey | 145.27 | 2,054,748 |
| Cape Town, South Africa | 145.05 | 4,800,954 |
| Chicago, IL, United States | 144.81 | 9,509,934 |
| Jeddah (Jiddah), Saudi Arabia | 144.4 | 4,780,740 |
| Barcelona, Spain | 143.73 | 5,658,472 |
| Brussels, Belgium | 143.12 | 2,109,631 |
| Genoa, Italy | 142.82 | 675,464 |
| Coimbatore, India | 142.77 | 2,934,621 |
| Hamilton, Canada | 142.74 | 775,751 |
| Bangalore, India | 141.67 | 13,193,035 |
| Dublin, Ireland | 140.93 | 1,255,963 |
| Curitiba, Brazil | 140.07 | 3,770,919 |
| Los Angeles, CA, United States | 139.75 | 12,997,353 |
| Nizhny Novgorod, Russia | 139.25 | 1,252,917 |
| Durban, South Africa | 139.09 | 3,199,329 |
| Islamabad, Pakistan | 139 | 1,198,035 |
| Bologna, Italy | 139 | 811,707 |
| Pune, India | 138.28 | 6,987,077 |
| Taipei, Taiwan | 137.81 | 2,742,379 |
| New York, NY, United States | 137.32 | 19,768,458 |
| Brasilia, Brazil | 135.44 | 4,803,877 |
| Winnipeg, Canada | 133.69 | 832,944 |
| Pretoria, South Africa | 133.25 | 2,739,768 |
| Warsaw, Poland | 133.21 | 1,794,532 |
| Detroit, MI, United States | 133.05 | 4,365,205 |
| Johannesburg, South Africa | 132.58 | 6,065,354 |
| Izmir, Turkey | 131.52 | 3,056,149 |
| Turin, Italy | 131.35 | 1,798,471 |
| Lviv, Ukraine | 129.85 | 721,383 |
| Poznan, Poland | 129.38 | 525,919 |
| Wroclaw, Poland | 128.45 | 642,497 |
| Guadalajara, Mexico | 128.14 | 5,339,583 |
| Chiang Mai, Thailand | 127.81 | 1,197,931 |
| Sharjah, United Arab Emirates | 127.77 | 1,785,684 |
| Budapest, Hungary | 127.23 | 1,775,207 |
| Ankara, Turkey | 126.93 | 5,309,690 |
| London, United Kingdom | 126.14 | 9,540,576 |
| Monterrey, Mexico | 125.76 | 5,036,535 |
| Campinas, Brazil | 125.75 | 3,384,564 |
| Seoul, South Korea | 125.66 | 9,975,709 |
| Lodz, Poland | 124 | 666,032 |
| Krakow (Cracow), Poland | 123.44 | 769,595 |
| Paris, France | 123.02 | 11,142,303 |
| Sofia, Bulgaria | 122.03 | 1,286,789 |
| Medellin, Colombia | 121.78 | 4,067,758 |
| Montevideo, Uruguay | 119.58 | 1,767,243 |
| Yerevan, Armenia | 119.46 | 1,092,028 |
| San Juan, Puerto Rico | 118.97 | 2,442,512 |
| Florianopolis, Brazil | 118.92 | 1,277,547 |
| Milan, Italy | 118.57 | 3,149,223 |
| Kuala Lumpur, Malaysia | 117.7 | 8,419,566 |
| Bucharest, Romania | 117.58 | 1,785,294 |
| Kuwait City, Kuwait | 116.64 | 3,238,523 |
| Athens, Greece | 115.69 | 3,153,781 |
| Quito, Ecuador | 115.33 | 1,928,296 |
| Thessaloniki, Greece | 115.32 | 813,793 |
| San Jose, Costa Rica | 115.02 | 1,441,324 |
| Chennai, India | 114.51 | 11,503,293 |
| Amman, Jordan | 114.37 | 2,209,584 |
| Ahmedabad, India | 113.04 | 8,450,228 |
| Hyderabad, India | 112.53 | 10,534,418 |
| Tbilisi, Georgia | 112.19 | 1,080,349 |
| Panama City, Panama | 110.94 | 1,937,963 |
| Rome, Italy | 109.98 | 4,297,877 |
| Belgrade, Serbia | 109.82 | 1,405,192 |
| Kharkiv, Ukraine | 109.51 | 1,423,343 |
| Shenzhen, China | 109.11 | 12,831,330 |
| Baku, Azerbaijan | 109.1 | 2,401,108 |
| Moscow, Russia | 108.32 | 12,640,818 |
| Minsk, Belarus | 107.79 | 2,048,574 |
| Porto Alegre, Brazil | 107.74 | 4,185,488 |
| Belo Horizonte, Brazil | 107.2 | 6,194,292 |
| Kiev (Kyiv), Ukraine | 106.88 | 3,010,209 |
| Odessa (Odesa), Ukraine | 106.41 | 1,007,989 |
| Lahore, Pakistan | 106.01 | 13,541,764 |
| Hong Kong, Hong Kong | 103.85 | 7,643,256 |
| Santiago, Chile | 103.1 | 6,856,939 |
| Skopje, North Macedonia | 101.02 | 605,996 |
| Kolkata, India | 99.37 | 15,133,888 |
| Buenos Aires, Argentina | 99.23 | 15,369,919 |
| Saint Petersburg, Russia | 97.91 | 5,535,556 |
| Dnipro, Ukraine | 97.76 | 946,574 |
| Istanbul, Turkey | 96.13 | 15,636,243 |
| Guatemala City, Guatemala | 95.46 | 3,036,405 |
| Yekaterinburg, Russia | 94.29 | 1,521,136 |
| Hanoi, Vietnam | 93.75 | 5,067,352 |
| Mumbai, India | 89.39 | 20,961,472 |
| Bogota, Colombia | 88.27 | 11,344,312 |
| Tirana, Albania | 88.09 | 511,559 |
| Mexico City, Mexico | 85.94 | 22,085,140 |
| Almaty, Kazakhstan | 84.53 | 1,958,135 |
| Recife, Brazil | 83.22 | 4,220,458 |
| Nairobi, Kenya | 81.75 | 5,118,844 |
| Novosibirsk, Russia | 81.71 | 1,686,236 |
| Cairo, Egypt | 81.6 | 21,750,020 |
| Karachi, Pakistan | 79.91 | 16,839,950 |
| Bangkok, Thailand | 79.74 | 10,899,698 |
| Sao Paulo, Brazil | 78.54 | 22,429,800 |
| Kathmandu, Nepal | 78.08 | 1,521,057 |
| Lima, Peru | 77.67 | 11,044,607 |
| Delhi, India | 77.27 | 32,065,760 |
| Shanghai, China | 76.62 | 28,516,904 |
| Jakarta, Indonesia | 74.13 | 11,074,811 |
| Rio de Janeiro, Brazil | 70.28 | 13,634,274 |
| Caracas, Venezuela | 69.32 | 2,956,813 |
| Colombo, Sri Lanka | 66.85 | 625,637 |
| Beirut, Lebanon | 66.54 | 2,433,155 |
| Ho Chi Minh City, Vietnam | 66.41 | 9,077,158 |
| Beijing, China | 58.96 | 21,333,332 |
| Tehran, Iran | 56.28 | 9,381,546 |
| Dhaka, Bangladesh | 56.18 | 22,478,116 |
| Lagos, Nigeria | 48.22 | 15,387,639 |
| Manila, Philippines | 46.08 | 14,406,059 |
It’s worth noting that the negative correlation between the quality of life and population size only appeared in cities above the median population of 2.4 million people, indicating that the size of a city doesn’t appear to impact quality of life until a certain tipping point. Then, above the median, there’s a blatant downward trend.
However, Tokyo is an anomaly—its quality of life is much higher than it’s metropolitan population would predict.
Zooming in on Tokyo
Despite being the world’s largest urban area, Tokyo compares favorably compared to other top megacities across the index. When ranked among the top five megacities, it places in first for Purchasing Power, Safety, Traffic Commute Time, Cost of Living, Healthcare, and Pollution.
What’s so special about Tokyo? One major thing going for the Japanese city is its immaculate public transport system. The city’s transport is so efficient, the city’s rail service once issued a public apology after a train left the station 25 seconds earlier than its scheduled departure.
Another factor that makes Tokyo so livable is its relatively affordable housing, at least compared to other big cities like New York and Hong Kong. This is partly because of the city’s flexible land zoning system, which makes it relatively easy for developers to build housing and mix-use communities.
As our world becomes increasingly more urbanized, and cities around the world continue to increase in size, will they be able to emulate Tokyo’s growth? And if not, what other city design trends and innovations can cities utilize to raise quality of live?

This article was published as a part of Visual Capitalist's Creator Program, which features data-driven visuals from some of our favorite Creators around the world.


Demographics
The Countries That Have Become Sadder Since 2010
Tracking Gallup survey data for more than a decade reveals some countries are witnessing big happiness declines, reflecting their shifting socio-economic conditions.


The Countries That Have Become Sadder Since 2010
This was originally posted on our Voronoi app. Download the app for free on iOS or Android and discover incredible data-driven charts from a variety of trusted sources.
Can happiness be quantified?
Some approaches that try to answer this question make a distinction between two differing components of happiness: a daily experience part, and a more general life evaluation (which includes how people think about their life as a whole).
The World Happiness Report—first launched in 2012—has been making a serious go at quantifying happiness, by examining Gallup poll data that asks respondents in nearly every country to evaluate their life on a 0–10 scale. From this they extrapolate a single “happiness score” out of 10 to compare how happy (or unhappy) countries are.
More than a decade later, the 2024 World Happiness Report continues the mission. Its latest findings also include how some countries have become sadder in the intervening years.
Which Countries Have Become Unhappier Since 2010?
Afghanistan is the unhappiest country in the world right now, and is also 60% unhappier than over a decade ago, indicating how much life has worsened since 2010.
In 2021, the Taliban officially returned to power in Afghanistan, after nearly two decades of American occupation in the country. The Islamic fundamentalist group has made life harder, especially for women, who are restricted from pursuing higher education, travel, and work.
On a broader scale, the Afghan economy has suffered post-Taliban takeover, with various consequent effects: mass unemployment, a drop in income, malnutrition, and a crumbling healthcare system.
| Rank | Country | Happiness Score Loss (2010–24) | 2024 Happiness Score (out of 10) |
|---|---|---|---|
| 1 | 🇦🇫 Afghanistan | -2.6 | 1.7 |
| 2 | 🇱🇧 Lebanon | -2.3 | 2.7 |
| 3 | 🇯🇴 Jordan | -1.5 | 4.2 |
| 4 | 🇻🇪 Venezuela | -1.3 | 5.6 |
| 5 | 🇲🇼 Malawi | -1.2 | 3.4 |
| 6 | 🇿🇲 Zambia | -1.2 | 3.5 |
| 7 | 🇧🇼 Botswana | -1.2 | 3.4 |
| 8 | 🇾🇪 Yemen | -1.0 | 3.6 |
| 9 | 🇪🇬 Egypt | -1.0 | 4.0 |
| 10 | 🇮🇳 India | -0.9 | 4.1 |
| 11 | 🇧🇩 Bangladesh | -0.9 | 3.9 |
| 12 | 🇨🇩 DRC | -0.7 | 3.3 |
| 13 | 🇹🇳 Tunisia | -0.7 | 4.4 |
| 14 | 🇨🇦 Canada | -0.6 | 6.9 |
| 15 | 🇺🇸 U.S. | -0.6 | 6.7 |
| 16 | 🇨🇴 Colombia | -0.5 | 5.7 |
| 17 | 🇵🇦 Panama | -0.5 | 6.4 |
| 18 | 🇵🇰 Pakistan | -0.5 | 4.7 |
| 19 | 🇿🇼 Zimbabwe | -0.5 | 3.3 |
| 20 | 🇮🇪 Ireland | -0.5 | 6.8 |
| N/A | 🌍 World | +0.1 | 5.5 |
Nine countries in total saw their happiness score drop by a full point or more, on the 0–10 scale.
Noticeably, many of them have seen years of social and economic upheaval. Lebanon, for example, has been grappling with decades of corruption, and a severe liquidity crisis since 2019 that has resulted in a banking system collapse, sending poverty levels skyrocketing.
In Jordan, unprecedented population growth—from refugees leaving Iraq and Syria—has aggravated unemployment rates. A somewhat abrupt change in the line of succession has also raised concerns about political stability in the country.

-

 Markets1 week ago
U.S. Debt Interest Payments Reach $1 Trillion
-

 Business2 weeks ago
Charted: Big Four Market Share by S&P 500 Audits
-

 Real Estate2 weeks ago
Ranked: The Most Valuable Housing Markets in America
-

 Money2 weeks ago
Which States Have the Highest Minimum Wage in America?
-

 AI2 weeks ago
Ranked: Semiconductor Companies by Industry Revenue Share
-

 Markets2 weeks ago
Ranked: The World’s Top Flight Routes, by Revenue
-

 Demographics2 weeks ago
Population Projections: The World’s 6 Largest Countries in 2075
-

 Markets2 weeks ago
The Top 10 States by Real GDP Growth in 2023