Misc
Cognitive Biases: Three Common Types Illustrated
Article/Editing:
In a world of information overload, we can fall victim to all sorts of cognitive biases. Since they can lead us to generate false conclusions, it’s particularly important to understand what these biases are and how they work, as the consequences can become quite drastic.
Confirmation bias, sampling bias, and brilliance bias are three examples that can affect our ability to critically engage with information. Jono Hey of Sketchplanations walks us through these cognitive bias examples, to help us better understand how they influence our day-to-day lives.
Confirmation Bias
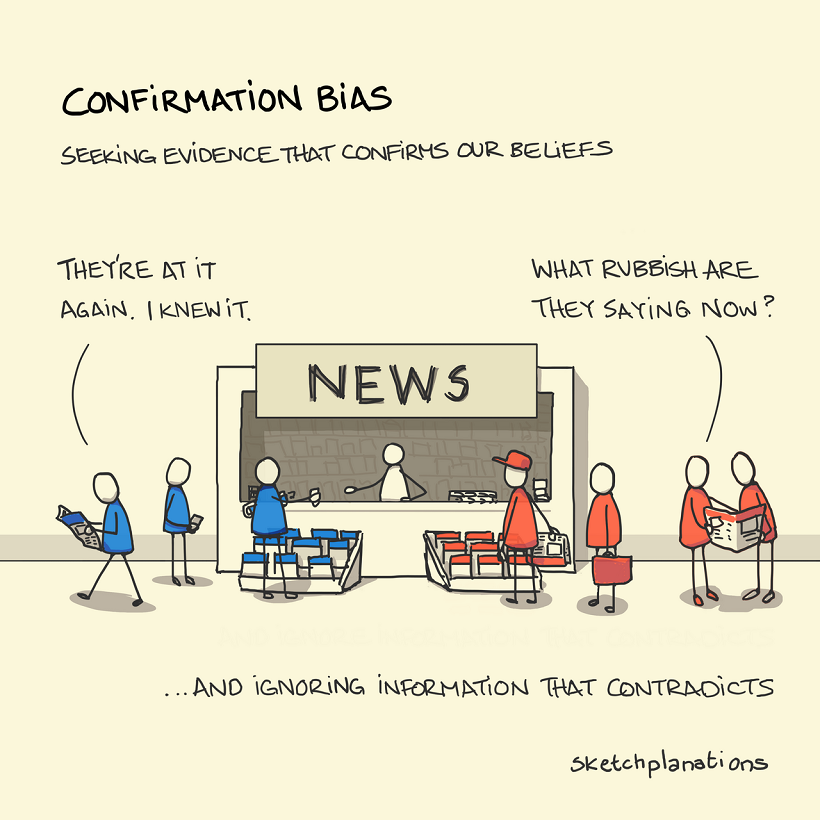
One of the most-commonly encountered and understood, you’re likely to have already heard about confirmation bias. This cognitive bias affects the way we test and evaluate hypotheses every day.
In simple terms, confirmation bias is the tendency to seek out or interpret evidence in such a way that supports our own strongly-held beliefs or expectations. This means that, given access to the same set of data and information, different people can come to wildly differing conclusions.
Feeding into confirmation bias can lead us to make ill-informed choices or even reinforce negative stereotypes. For this reason, it is important to remember to seek out information that both confirms and contradicts your presumptions about a certain topic.
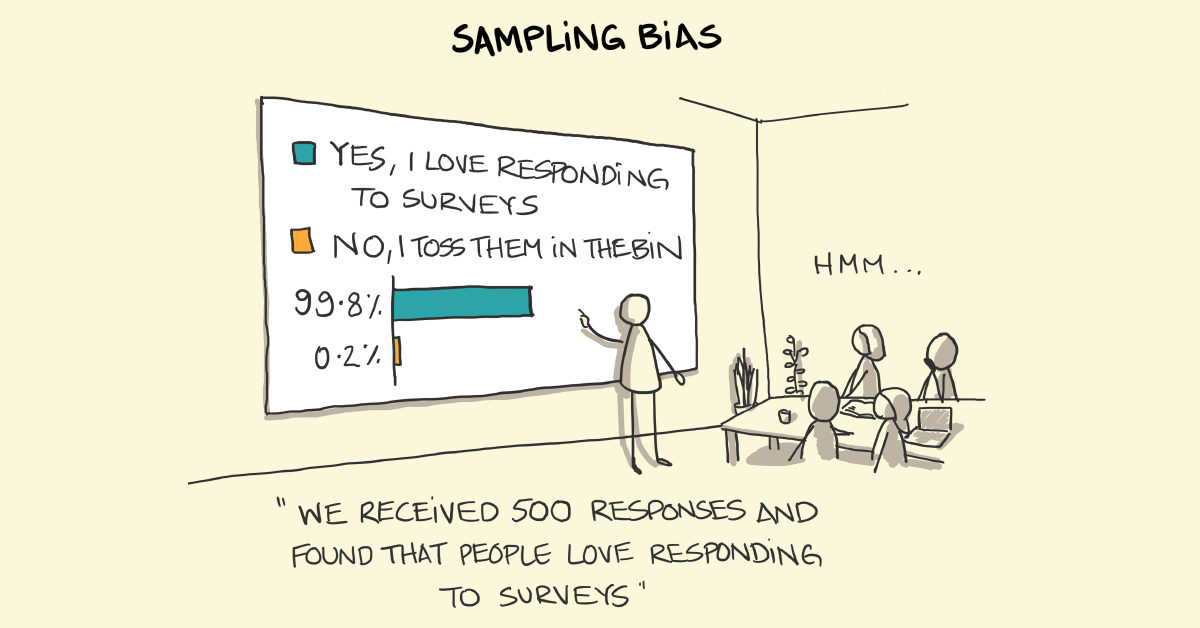
Sampling Bias
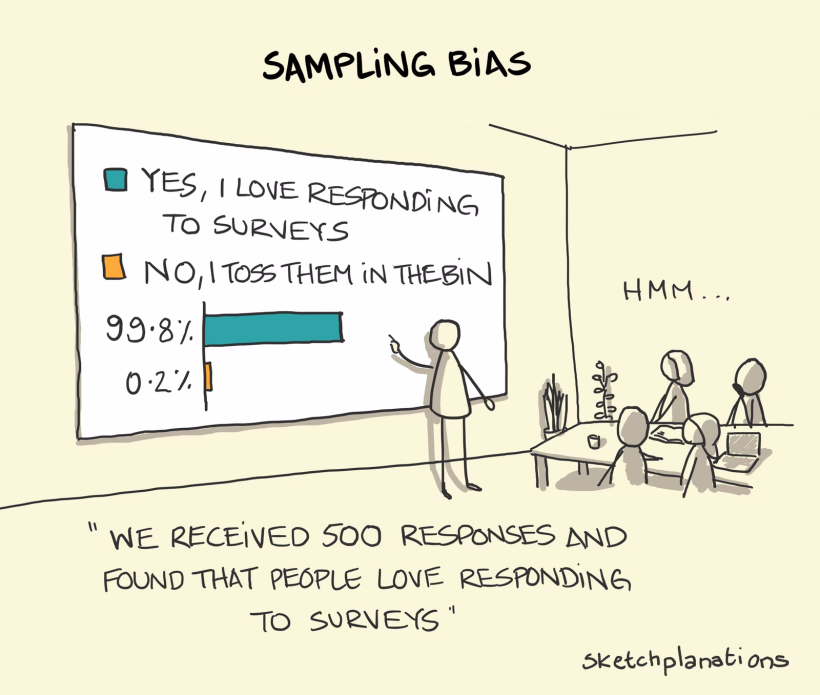
Sampling bias is a kind of bias that allows us to come to faulty conclusions based on inaccurate sample groups or data. Generally, the cause of sample bias is in poor study design and data collection.
When polling individuals for survey questions, it is important to get a representative picture of an entire population. But this can prove surprisingly difficult when the people generating the study are also prone to human flaws, including cognitive biases.
A common example involves conducting a survey on which political party is likely to win an election. If the study is run by a professor who only polls college students, since they are around and therefore easier to collect information from, the poll will not accurately reflect the opinions of the general population.
To avoid sampling bias, it is important to randomize data collection to ensure responses are not skewed towards individuals with similar characteristics.
Brilliance Bias
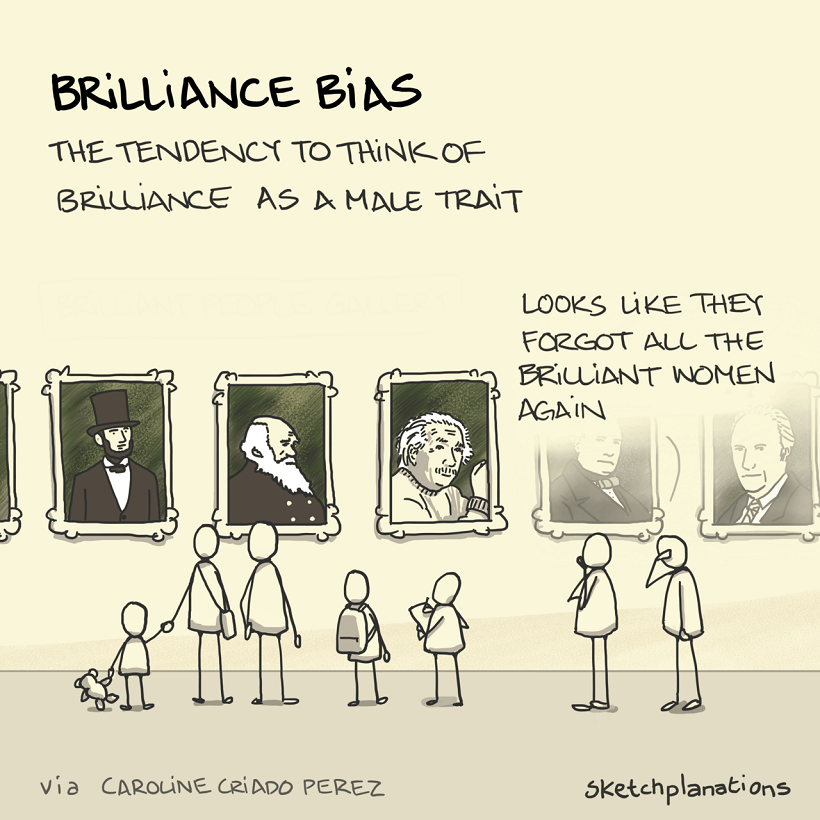
Brilliance bias is another common cognitive bias that makes us more likely to think of genius as a masculine trait. This is in part due to the lack of female representation in both traditional academic and executive positions.
In fact, The Journal of Experimental Social Psychology published an in-depth study on brilliance bias in 2020. It suggests that a likely source of this bias is in the uneven distribution of men and women across careers typically associated with higher level intelligence.
While this distribution is a remnant of historical factors that limited access to education and career choices for women in the past, its presence has made us (wrongly) conclude that women are less brilliant instead. Naturally, as the cycle perpetuates the uneven distribution of women in these careers, it only reinforces this bias.
Other Cognitive Bias Examples
These few examples from Jono Hey give a good overview of some of the biases we face when trying to understand the data given to us, but they are just the tip of the iceberg.
It is important to be cognizant of these biases in an era where we are constantly engaging with information, especially if we want to combat some of the harmful consequences they entail.

This article was published as a part of Visual Capitalist's Creator Program, which features data-driven visuals from some of our favorite Creators around the world.


Misc
How Hard Is It to Get Into an Ivy League School?
We detail the admission rates and average annual cost for Ivy League schools, as well as the median SAT scores required to be accepted.


How Hard Is It to Get Into an Ivy League School?
This was originally posted on our Voronoi app. Download the app for free on iOS or Android and discover incredible data-driven charts from a variety of trusted sources.
Ivy League institutions are renowned worldwide for their academic excellence and long-standing traditions. But how hard is it to get into one of the top universities in the U.S.?
In this graphic, we detail the admission rates and average annual cost for Ivy League schools, as well as the median SAT scores required to be accepted. The data comes from the National Center for Education Statistics and was compiled by 24/7 Wall St.
Note that “average annual cost” represents the net price a student pays after subtracting the average value of grants and/or scholarships received.
Harvard is the Most Selective
The SAT is a standardized test commonly used for college admissions in the United States. It’s taken by high school juniors and seniors to assess their readiness for college-level academic work.
When comparing SAT scores, Harvard and Dartmouth are among the most challenging universities to gain admission to. The median SAT scores for their students are 760 for reading and writing and 790 for math. Still, Harvard has half the admission rate (3.2%) compared to Dartmouth (6.4%).
| School | Admission rate (%) | SAT Score: Reading & Writing | SAT Score: Math | Avg Annual Cost* |
|---|---|---|---|---|
| Harvard University | 3.2 | 760 | 790 | $13,259 |
| Columbia University | 3.9 | 750 | 780 | $12,836 |
| Yale University | 4.6 | 760 | 780 | $16,341 |
| Brown University | 5.1 | 760 | 780 | $26,308 |
| Princeton University | 5.7 | 760 | 780 | $11,080 |
| Dartmouth College | 6.4 | 760 | 790 | $33,023 |
| University of Pennsylvania | 6.5 | 750 | 790 | $14,851 |
| Cornell University | 7.5 | 750 | 780 | $29,011 |
*Costs after receiving federal financial aid.
Additionally, Dartmouth has the highest average annual cost at $33,000. Princeton has the lowest at $11,100.
While student debt has surged in the United States in recent years, hitting $1.73 trillion in 2023, the worth of obtaining a degree from any of the schools listed surpasses mere academics. This is evidenced by the substantial incomes earned by former students.
Harvard grads, for example, have the highest average starting salary in the country, at $91,700.

-

 Green2 weeks ago
Ranked: Top Countries by Total Forest Loss Since 2001
-

 Travel1 week ago
Ranked: The World’s Top Flight Routes, by Revenue
-

 Technology2 weeks ago
Ranked: Semiconductor Companies by Industry Revenue Share
-

 Money2 weeks ago
Which States Have the Highest Minimum Wage in America?
-

 Real Estate2 weeks ago
Ranked: The Most Valuable Housing Markets in America
-

 Markets2 weeks ago
Charted: Big Four Market Share by S&P 500 Audits
-

 AI2 weeks ago
The Stock Performance of U.S. Chipmakers So Far in 2024
-

 Automotive2 weeks ago
Almost Every EV Stock is Down After Q1 2024