Economy
Charting and Mapping China’s Exports Since 2001
Article/Editing:
Charting and Mapping China’s Exports Since 2001
Between the dawn of the Roman Empire and the first factory built in the Industrial Revolution, China was one of the most powerful economies on the planet, with a gross domestic product that made up roughly 30% of the global economy.
By the 1970s, the country’s economy had regressed to a shadow of its historic self, with a per-capita income equal to one-third of sub-Saharan Africa. But over the next four decades, China’s rapid industrial transformation made it the manufacturing powerhouse of the world, and exports rapidly ballooned.
Which markets are receiving all of these exports? This graphic from Ehsan Soltani uses data from the World Trade Organization and the customs office of China to track the biggest destinations of China’s merchandise exports—defined as goods that leave the territory of a country—since the 2000s.
China’s Top Export Markets from 2001‒2022
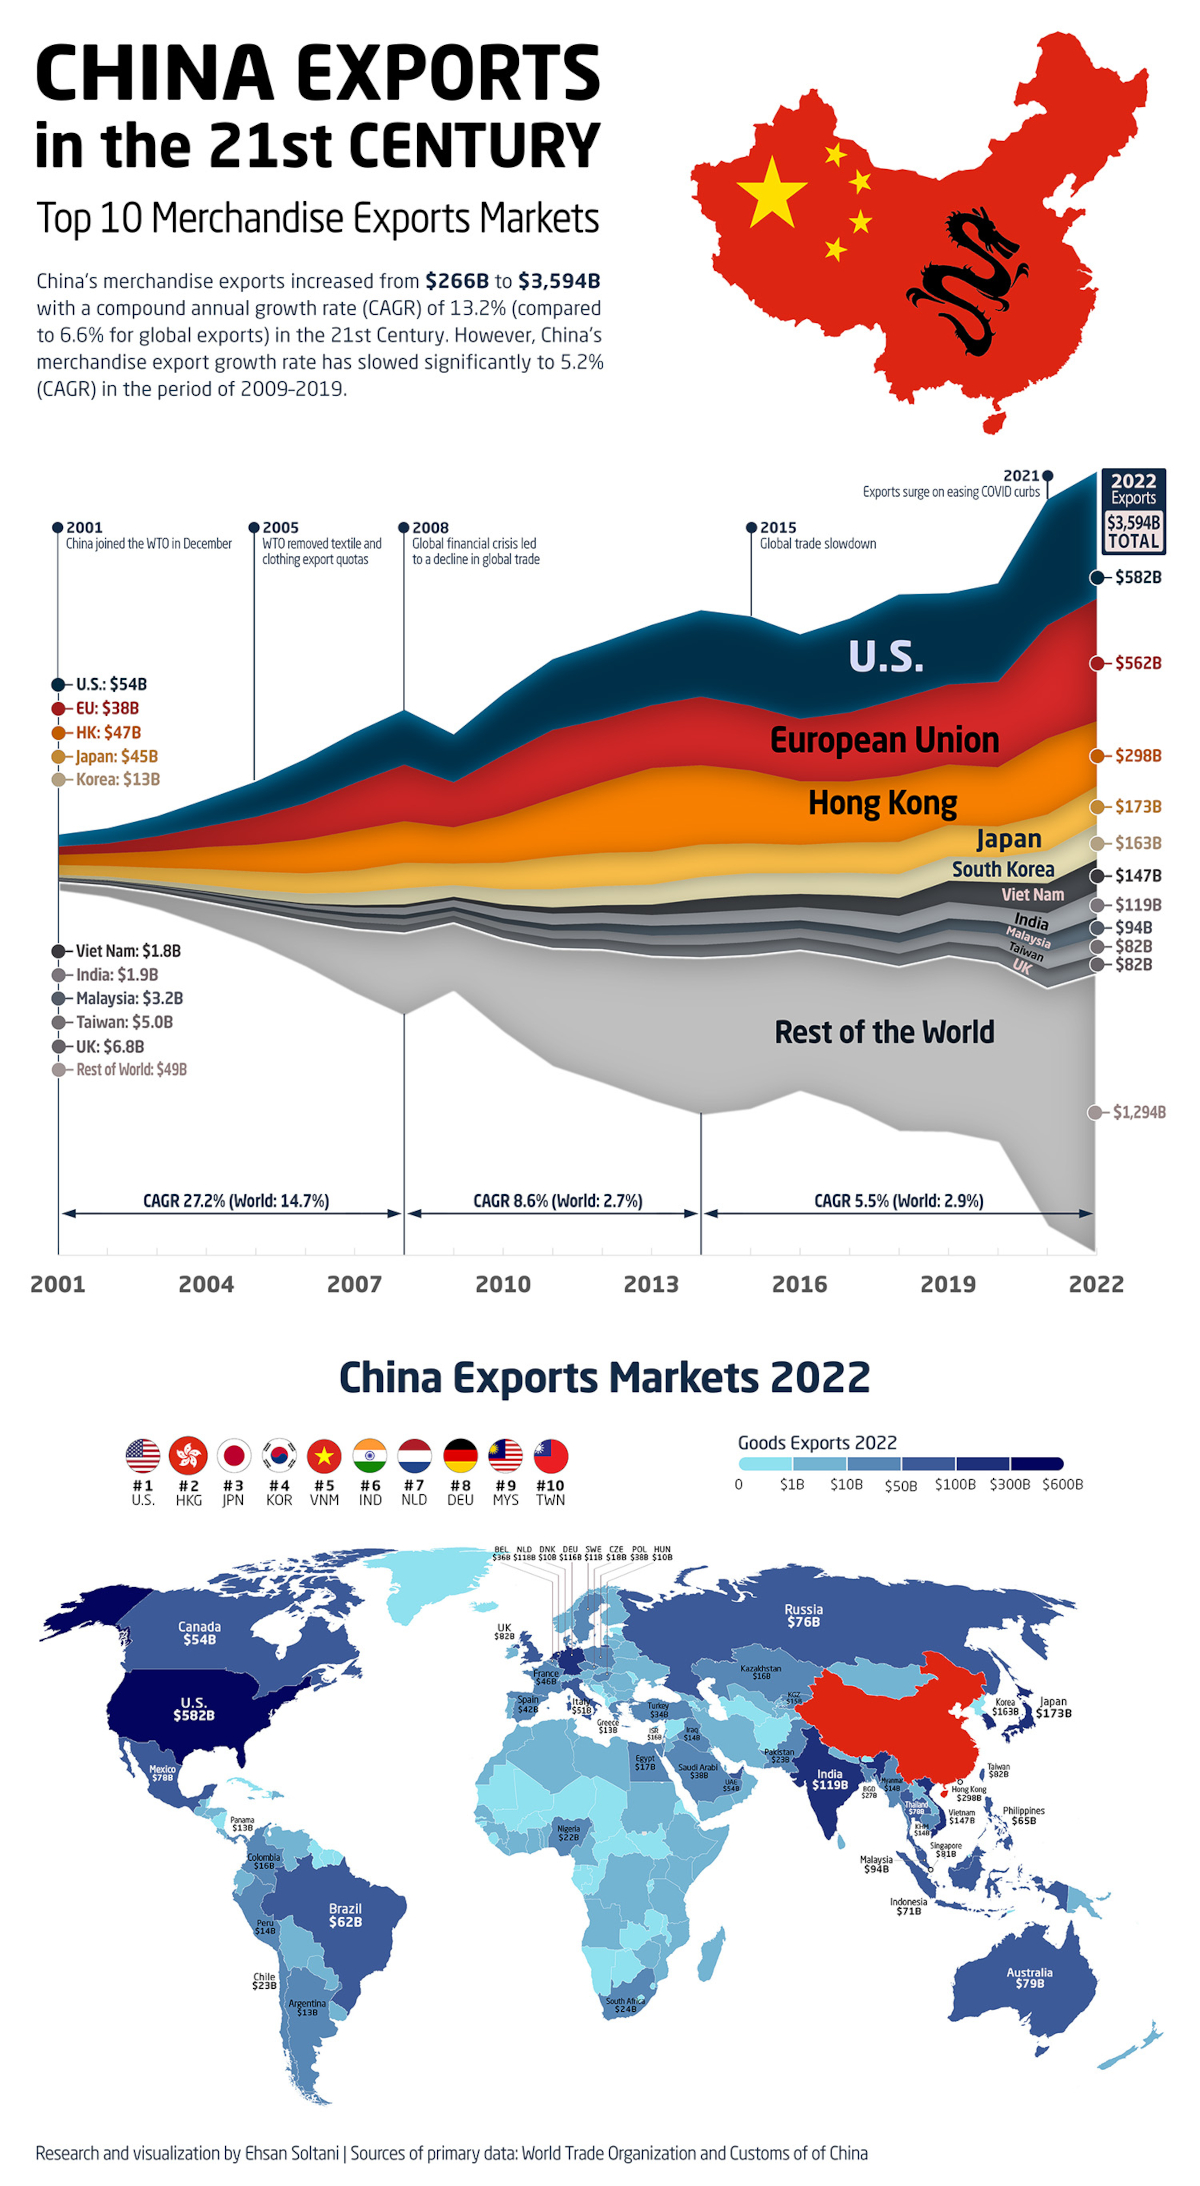
In 2001, when China joined the World Trade Organization, the value of its merchandise exports stood at $266 billion. Over the next seven years, the country’s exports grew uninterrupted until the 2008 financial crisis caused a sharp decline in global trade.
This cycle would repeat again with consecutive growth until 2015 (another global trade slowdown), followed by slowed growth until 2020 (the onset of the COVID-19 pandemic).
But merchandise exports skyrocketed by 30% in 2021, and by the end of 2022 had grown to an estimated $3.6 trillion per year. That means China’s exports alone are bigger than the entire economies of countries like the UK, India, and France.
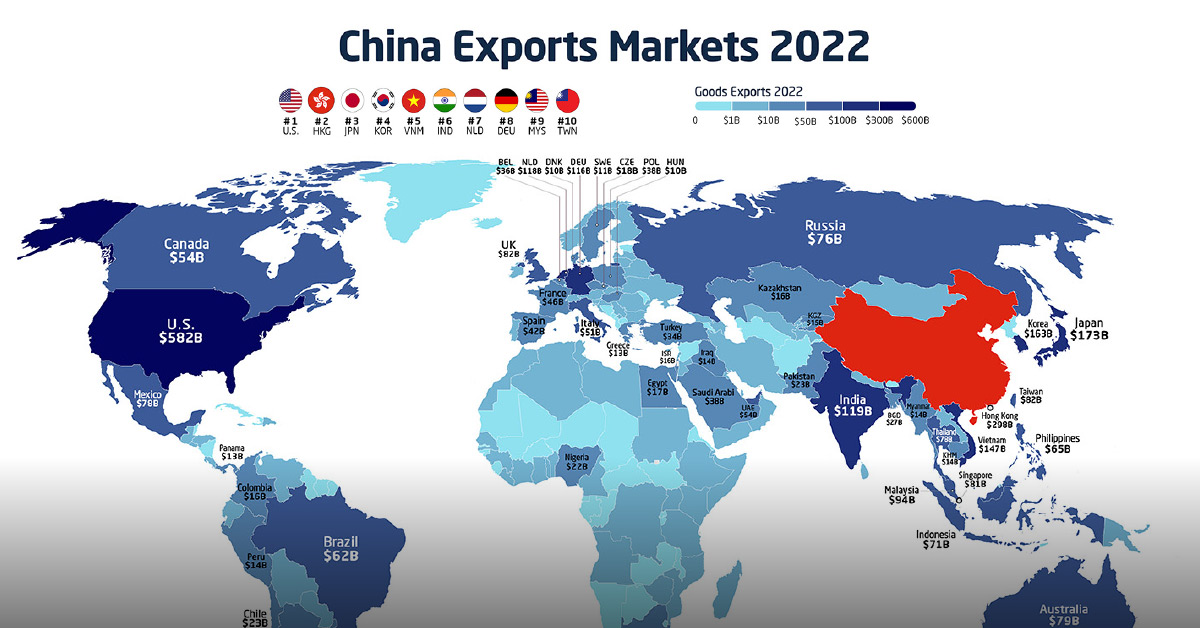
Which countries were receiving most of these merchandise exports? Here are China’s top export markets from 2022 and their change since 2001:
| China's Export Market | 2001 | 2022 | Change (%) |
|---|---|---|---|
| 🇺🇸 U.S. | $54,355M | $581,783M | 970% |
| 🇪🇺 EU | $37,922M | $562,000M | 1,382% |
| 🇭🇰 Hong Kong | $46,541M | $297,538M | 539% |
| 🇯🇵 Japan | $44,941M | $172,927M | 285% |
| 🇰🇷 South Korea | $12,519M | $162,621M | 1,199% |
| 🇻🇳 Viet Nam | $1,798M | $146,960M | 8,074% |
| 🇮🇳 India | $1,896M | $118,502M | 6,150% |
| 🇲🇾 Malaysia | $3,221M | $93,711M | 2,809% |
| 🇹🇼 Taiwan | $5,001M | $81,587M | 1,531% |
| 🇬🇧 UK | $6,781M | $81,545M | 1,103% |
| 🌎 Rest of the World | $48,847M | $1,294,427M | 2,550% |
| Total | $263,822M | $3,593,601M | 1,261% |
Despite Trump-era tariffs and a growing geopolitical rift over the last few years, the U.S. has been the biggest market for China’s exports for the last two decades. In 2022, the country received nearly $582 billion in goods from China.
Close behind, the 27 member states of the European Union rank as the second biggest market for exported Chinese goods at $562 billion. The largest individual country was the Netherlands, which accounted for $118 billion or just under 21% of Chinese merchandise exports to the EU.
How do other individual countries compare? Below is the full list of China’s export markets in 2022 by countries and territories:
| Country / Territory | China Exports (2022) |
|---|---|
| U.S. | $581,783M |
| Hong Kong | $297,538M |
| Japan | $172,927M |
| South Korea | $162,621M |
| Viet Nam | $146,960M |
| India | $118,502M |
| Netherlands | $117,731M |
| Germany | $116,227M |
| Malaysia | $93,711M |
| Taiwan | $81,587M |
| UK | $81,545M |
| Singapore | $81,168M |
| Australia | $78,827M |
| Thailand | $78,480M |
| Mexico | $77,535M |
| Russia | $76,123M |
| Indonesia | $71,318M |
| Philippines | $64,679M |
| Brazil | $61,970M |
| U.A.E | $53,862M |
| Canada | $53,705M |
| Italy | $50,908M |
| France | $45,663M |
| Spain | $41,750M |
| Poland | $38,163M |
| Saudi Arabia | $37,990M |
| Belgium | $35,635M |
| Türkiye | $34,034M |
| Bangladesh | $26,808M |
| South Africa | $24,196M |
| Pakistan | $23,089M |
| Chile | $22,520M |
| Nigeria | $22,300M |
| Czech Republic | $18,227M |
| Egypt | $17,170M |
| Israel | $16,481M |
| Kazakhstan | $16,355M |
| Colombia | $15,600M |
| Kyrgyzstan | $15,421M |
| Cambodia | $14,184M |
| Iraq | $13,989M |
| Myanmar | $13,616M |
| Peru | $13,532M |
| Greece | $12,988M |
| Argentina | $12,769M |
| Panama | $12,647M |
| Sweden | $11,396M |
| Hungary | $10,473M |
| Denmark | $10,192M |
| Iran | $9,440M |
| New Zealand | $9,175M |
| Kenya | $8,249M |
| Ghana | $7,926M |
| Tanzania | $7,775M |
| Switzerland | $7,619M |
| Liberia | $7,520M |
| Uzbekistan | $7,504M |
| Romania | $7,397M |
| Slovenia | $6,861M |
| Ecuador | $6,288M |
| Algeria | $6,276M |
| Portugal | $5,978M |
| Morocco | $5,741M |
| Ireland | $5,726M |
| Jordan | $5,707M |
| Norway | $5,191M |
| Austria | $5,119M |
| Congo, DR | $5,118M |
| Kuwait | $4,970M |
| Finland | $4,553M |
| Slovakia | $4,436M |
| Guatemala | $4,366M |
| Dominican Republic | $4,319M |
| Macao | $4,277M |
| Oman | $4,205M |
| Angola | $4,097M |
| Senegal | $4,068M |
| Qatar | $3,989M |
| Sri Lanka | $3,755M |
| Cote d'Ivoire | $3,491M |
| Marshall Islands | $3,468M |
| Ukraine | $3,300M |
| Mozambique | $3,292M |
| Belarus | $3,275M |
| Djibouti | $3,262M |
| Togo | $3,177M |
| Cameroon | $3,167M |
| Venezuela | $3,009M |
| Uruguay | $2,983M |
| Mongolia | $2,887M |
| Bulgaria | $2,852M |
| Yemen | $2,798M |
| Lebanon | $2,516M |
| Libya | $2,373M |
| Costa Rica | $2,369M |
| Lao | $2,340M |
| Guinea | $2,283M |
| Croatia | $2,266M |
| Tajikistan | $2,217M |
| Ethiopia | $2,217M |
| Serbia | $2,177M |
| Sudan | $2,034M |
| Malta | $1,974M |
| Paraguay | $1,895M |
| Tunisia | $1,880M |
| Lithuania | $1,790M |
| Bahrian | $1,772M |
| Benin | $1,691M |
| El Salvador | $1,659M |
| Nepal | $1,655M |
| Honduras | $1,560M |
| Madagascar | $1,455M |
| Papua New Guinea | $1,426M |
| Georgia | $1,252M |
| Cyprus | $1,168M |
| Azerbaijan | $1,136M |
| Zimbabwe | $1,125M |
| Uganda | $1,077M |
| Bolivia | $1,067M |
| Somalia | $1,047M |
| Jamaica | $1,039M |
| Latvia | $1,025M |
| Zambia | $980M |
| Republic of Congo | $976M |
| Mauritius | $974M |
| Puerto Rico | $973M |
| Estonia | $947M |
| Mauritania | $941M |
| North Korea | $894M |
| Turkmenistan | $868M |
| Brunei | $831M |
| Nicaragua | $724M |
| Albania | $704M |
| Niger | $676M |
| Haiti | $635M |
| Gabon | $583M |
| Mali | $581M |
| Guyana | $577M |
| Sierra Leone | $573M |
| Namibia | $557M |
| Afghanistan | $553M |
| Trinidad and Tobago | $544M |
| Luxembourg | $526M |
| Burkina Faso | $504M |
| Fiji | $503M |
| Armenia | $480M |
| Gambia | $454M |
| Maldives | $451M |
| Syria | $425M |
| Cuba | $414M |
| Rwanda | $407M |
| Bahamas | $397M |
| Belize | $328M |
| Suriname | $321M |
| Iceland | $311M |
| Timor-Leste | $290M |
| Chad | $282M |
| Malawi | $281M |
| Reunion | $250M |
| North Macedonia | $235M |
| Equatorial Guinea | $231M |
| Botswana | $221M |
| Montenegro | $219M |
| Moldova | $207M |
| Solomon Islands | $196M |
| Bosnia and Hercegovina | $185M |
| New Caledonia | $169M |
| Bhutan | $166M |
| Barbados | $161M |
| Palestine | $158M |
| South Sudan | $157M |
| French Polynesia | $154M |
| Eritrea | $148M |
| Samoa | $124M |
| Burundi | $120M |
| Virgin Islands,British | $109M |
| Antigua and Barbuda | $105M |
| Vanuatu | $96M |
| Seychelles | $96M |
| Cape Verde | $93M |
| Bermuda | $83M |
| Swaziland | $82M |
| Guadeloupe | $68M |
| Comoros | $67M |
| Liechtenstein | $64M |
| Aruba | $64M |
| Curacao | $61M |
| Lesotho | $60M |
| Mayotte | $59M |
| Tonga | $57M |
| Guinea-Bissau | $57M |
| Cayman Islands | $55M |
| Palau | $54M |
| Central African Republic | $52M |
| Martinique | $48M |
| Kiribati | $43M |
| French Guiana | $39M |
| Saint Lucia | $36M |
| Dominica | $34M |
| Tuvalu | $33M |
| Micronesia,FS | $30M |
| Netherlands Antilles | $26M |
| Grenada | $23M |
| Andorra | $22M |
| St.Vincent&Grenadines | $22M |
| Gibraltar | $18M |
| Sao Tome and Principe | $15M |
| St.Kitts&Nevis | $15M |
| Nauru | $13M |
| Monaco | $12M |
| Cook Islands | $12M |
| Turks&Caicos Islands | $10M |
| San Marino | $10M |
| Saint Martin Islands | $5M |
| Canary Islands | $2M |
| Faroe Islands | $2M |
| Wallis and Futuna | $2M |
| Norfolk Island | $2M |
| Western Sahara | $1M |
| Greenland | $1M |
| Society Islands | $1M |
Will China’s Exports Continue to Grow?
Like the broader global economy, the Chinese economy is starting to re-adjust.
For one, the country is beginning to rebalance exports from its manufacturing-heavy mix to a more even allocation of both manufacturing and services. Secondly, the economy’s overall reliance on exports has decreased significantly from its highs in the mid-2000s, with an aim to increase domestic consumption and have a more self-sufficient economy overall.
That’s not to say that Chinese dominance on the world export stage is expected to waver. With far-reaching economic policies like the One Belt, One Road initiative and the RCEP trade agreement between 15 countries in Asia and Oceania, there are plenty of future growth avenues for Chinese exports.
As the country faces an unprecedented internal demographic shift in the coming decades, perhaps China’s robust export sector will be key to continued economic growth.

This article was published as a part of Visual Capitalist's Creator Program, which features data-driven visuals from some of our favorite Creators around the world.


Markets
Ranked: The Largest U.S. Corporations by Number of Employees
We visualized the top U.S. companies by employees, revealing the massive scale of retailers like Walmart, Target, and Home Depot.


The Largest U.S. Corporations by Number of Employees
This was originally posted on our Voronoi app. Download the app for free on Apple or Android and discover incredible data-driven charts from a variety of trusted sources.
Revenue and profit are common measures for measuring the size of a business, but what about employee headcount?
To see how big companies have become from a human perspective, we’ve visualized the top U.S. companies by employees. These figures come from companiesmarketcap.com, and were accessed in March 2024. Note that this ranking includes publicly-traded companies only.
Data and Highlights
The data we used to create this list of largest U.S. corporations by number of employees can be found in the table below.
| Company | Sector | Number of Employees |
|---|---|---|
| Walmart | Consumer Staples | 2,100,000 |
| Amazon | Consumer Discretionary | 1,500,000 |
| UPS | Industrials | 500,000 |
| Home Depot | Consumer Discretionary | 470,000 |
| Concentrix | Information Technology | 440,000 |
| Target | Consumer Staples | 440,000 |
| Kroger | Consumer Staples | 430,000 |
| UnitedHealth | Health Care | 400,000 |
| Berkshire Hathaway | Financials | 383,000 |
| Starbucks | Consumer Discretionary | 381,000 |
| Marriott International | Consumer Discretionary | 377,000 |
| Cognizant | Information Technology | 346,600 |
Retail and Logistics Top the List
Companies like Walmart, Target, and Kroger have a massive headcount due to having many locations spread across the country, which require everything from cashiers to IT professionals.
Moving goods around the world is also highly labor intensive, explaining why UPS has half a million employees globally.
Below the Radar?
Two companies that rank among the largest U.S. corporations by employees which may be less familiar to the public include Concentrix and Cognizant. Both of these companies are B2B brands, meaning they primarily work with other companies rather than consumers. This contrasts with brands like Amazon or Home Depot, which are much more visible among average consumers.
A Note on Berkshire Hathaway
Warren Buffett’s company doesn’t directly employ 383,000 people. This headcount actually includes the employees of the firm’s many subsidiaries, such as GEICO (insurance), Dairy Queen (retail), and Duracell (batteries).
If you’re curious to see how Buffett’s empire has grown over the years, check out this animated graphic that visualizes the growth of Berkshire Hathaway’s portfolio from 1994 to 2022.

-

 Green2 weeks ago
Ranked: Top Countries by Total Forest Loss Since 2001
-

 Travel1 week ago
Ranked: The World’s Top Flight Routes, by Revenue
-

 Technology1 week ago
Ranked: Semiconductor Companies by Industry Revenue Share
-

 Money2 weeks ago
Which States Have the Highest Minimum Wage in America?
-

 Real Estate2 weeks ago
Ranked: The Most Valuable Housing Markets in America
-

 Markets2 weeks ago
Charted: Big Four Market Share by S&P 500 Audits
-

 AI2 weeks ago
The Stock Performance of U.S. Chipmakers So Far in 2024
-

 Automotive2 weeks ago
Almost Every EV Stock is Down After Q1 2024