Markets
Charted: The Global Decline in Consumer Confidence
Article/Editing:
Charting the Global Decline in Consumer Confidence
Our plans to buy new things, travel, invest, and save money, all rely on one crucial factor—our ability to pay for it.
This ability in turn is dependent on not just our current savings, but our expected income and confidence in the economy, i.e. consumer confidence.
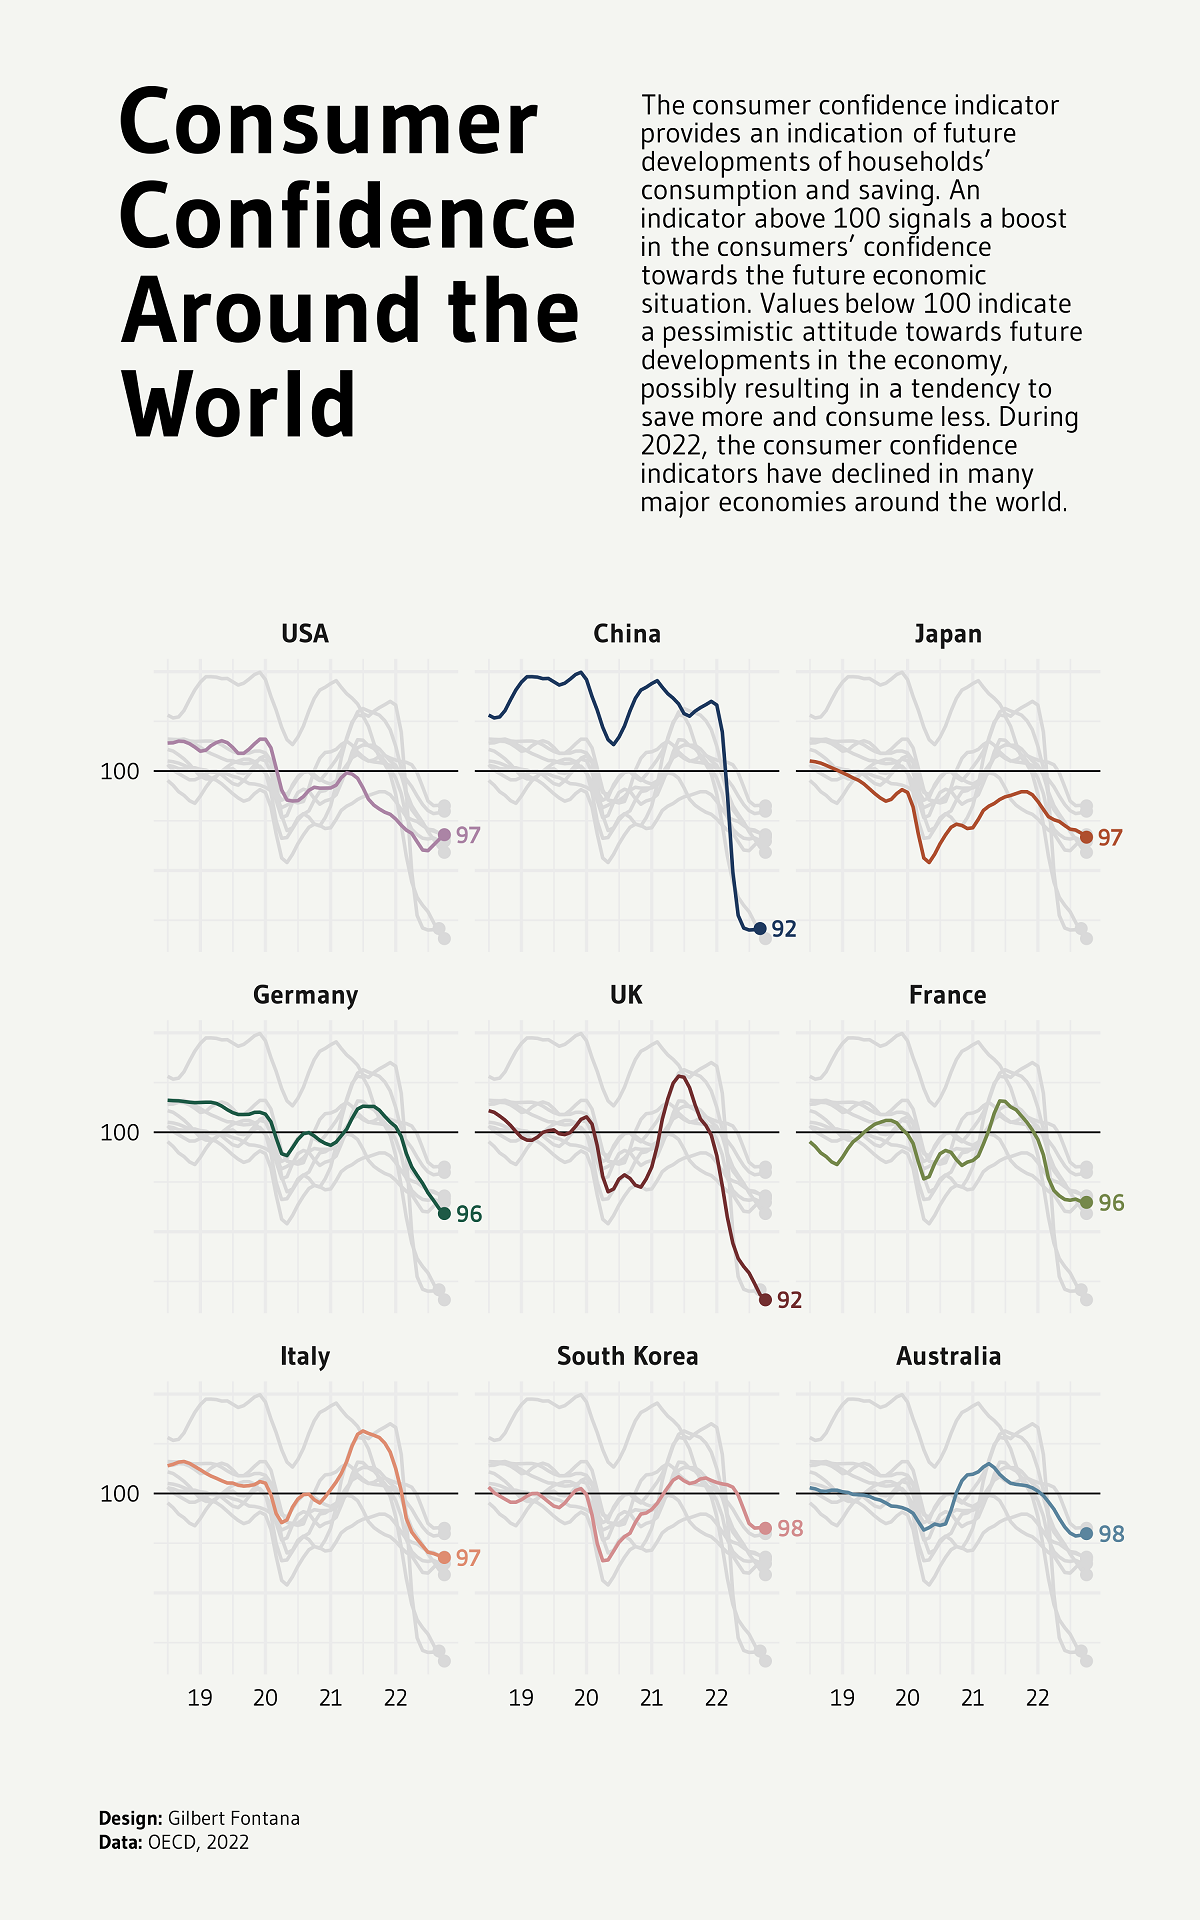
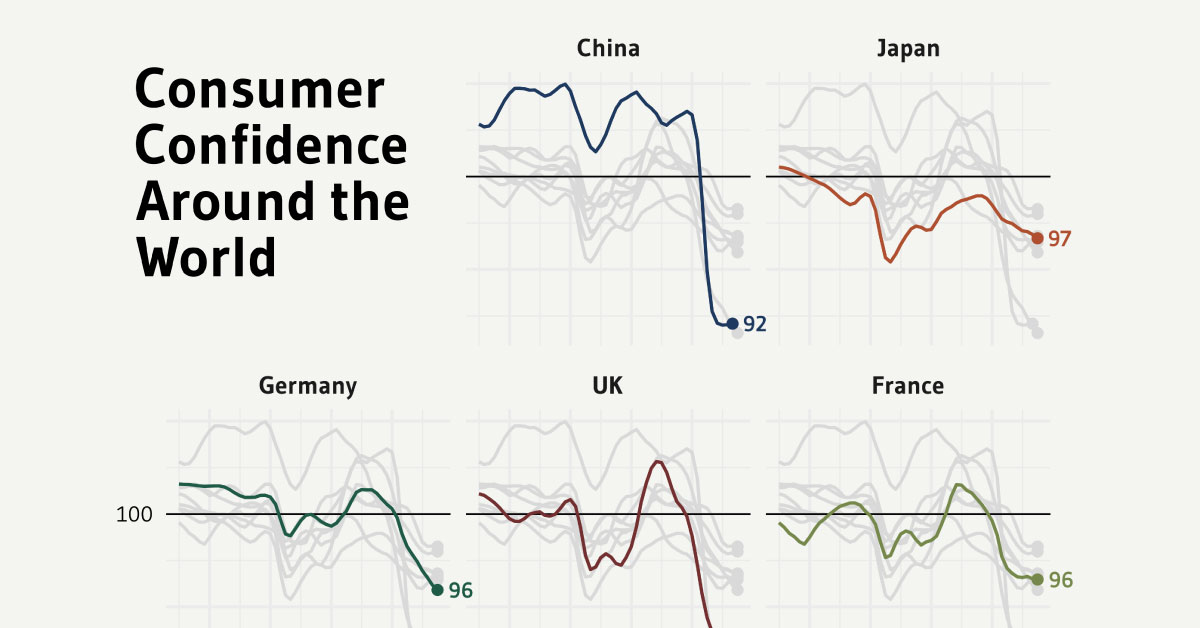
This graphic by Gilbert Fontana uses OECD data from 2019‒2022 to chart the rise and fall of consumer confidence in nine major economies.
What is Consumer Confidence?
Measured at a base value of 100, the Consumer Confidence Index takes consumers’ expectations and sentiments about their financial futures into account to indicate household consumption and saving patterns in the future.
An indicator above 100 means that there is a boost in people’s confidence towards economic prospects. This means that they are less likely to save and more inclined to spend money in the near future.
On the other hand, a value below 100 indicates that consumers are pessimistic about their economic standing in the future. This can result in them saving more and spending less.
Inflation, job losses, and expectations of a not-so-bright financial future can shake this confidence, making consumers think twice about their consumption.
Global Consumers are Becoming Pessimistic
After falling down and quickly recovering during the COVID-19 pandemic in 2020, consumer confidence seems to be trending downwards across the globe.
| Country | Consumer Confidence (Oct 2021) | Consumer Confidence (Oct 2022) |
|---|---|---|
| 🇫🇷 France | 100.8 | 96.5 |
| 🇩🇪 Germany | 101.1 | 95.9 |
| 🇮🇹 Italy | 102.8 | 96.8 |
| 🇯🇵 Japan | 99.0 | 96.7 |
| 🇬🇧 UK | 100.7 | 91.6 |
| 🇺🇸 U.S. | 98.1 | 96.8 |
| 🇨🇳 China | 103.2 | 92.1* (Sept 2022) |
| 🇦🇺 Australia | 100.4 | 98.0 |
| 🇰🇷 South Korea | 100.7 | 98.3 |
The UK was hit the worst as its Consumer Confidence Index (CCI) dropped down to 92 in 2022, from 100.6 in 2021. Just behind is China, which also fell to 92 in 2022 despite sitting at 103 two years prior.
The remaining countries had CCIs between 96‒98, including France, Germany, and the U.S.
Even with the most optimistic populations and a CCI of 98, South Korea and Australia, were below the ideal 100 mark and indicated pessimism.
The main culprits of this declining confidence in global economic markets including expectations of rising inflation—especially for food and gas—as well as high interest rates, the threats of a looming recession, and layoffs in major sectors.

This article was published as a part of Visual Capitalist's Creator Program, which features data-driven visuals from some of our favorite Creators around the world.


Markets
U.S. Debt Interest Payments Reach $1 Trillion
U.S. debt interest payments have surged past the $1 trillion dollar mark, amid high interest rates and an ever-expanding debt burden.


U.S. Debt Interest Payments Reach $1 Trillion
This was originally posted on our Voronoi app. Download the app for free on iOS or Android and discover incredible data-driven charts from a variety of trusted sources.
The cost of paying for America’s national debt crossed the $1 trillion dollar mark in 2023, driven by high interest rates and a record $34 trillion mountain of debt.
Over the last decade, U.S. debt interest payments have more than doubled amid vast government spending during the pandemic crisis. As debt payments continue to soar, the Congressional Budget Office (CBO) reported that debt servicing costs surpassed defense spending for the first time ever this year.
This graphic shows the sharp rise in U.S. debt payments, based on data from the Federal Reserve.
A $1 Trillion Interest Bill, and Growing
Below, we show how U.S. debt interest payments have risen at a faster pace than at another time in modern history:
| Date | Interest Payments | U.S. National Debt |
|---|---|---|
| 2023 | $1.0T | $34.0T |
| 2022 | $830B | $31.4T |
| 2021 | $612B | $29.6T |
| 2020 | $518B | $27.7T |
| 2019 | $564B | $23.2T |
| 2018 | $571B | $22.0T |
| 2017 | $493B | $20.5T |
| 2016 | $460B | $20.0T |
| 2015 | $435B | $18.9T |
| 2014 | $442B | $18.1T |
| 2013 | $425B | $17.2T |
| 2012 | $417B | $16.4T |
| 2011 | $433B | $15.2T |
| 2010 | $400B | $14.0T |
| 2009 | $354B | $12.3T |
| 2008 | $380B | $10.7T |
| 2007 | $414B | $9.2T |
| 2006 | $387B | $8.7T |
| 2005 | $355B | $8.2T |
| 2004 | $318B | $7.6T |
| 2003 | $294B | $7.0T |
| 2002 | $298B | $6.4T |
| 2001 | $318B | $5.9T |
| 2000 | $353B | $5.7T |
| 1999 | $353B | $5.8T |
| 1998 | $360B | $5.6T |
| 1997 | $368B | $5.5T |
| 1996 | $362B | $5.3T |
| 1995 | $357B | $5.0T |
| 1994 | $334B | $4.8T |
| 1993 | $311B | $4.5T |
| 1992 | $306B | $4.2T |
| 1991 | $308B | $3.8T |
| 1990 | $298B | $3.4T |
| 1989 | $275B | $3.0T |
| 1988 | $254B | $2.7T |
| 1987 | $240B | $2.4T |
| 1986 | $225B | $2.2T |
| 1985 | $219B | $1.9T |
| 1984 | $205B | $1.7T |
| 1983 | $176B | $1.4T |
| 1982 | $157B | $1.2T |
| 1981 | $142B | $1.0T |
| 1980 | $113B | $930.2B |
| 1979 | $96B | $845.1B |
| 1978 | $84B | $789.2B |
| 1977 | $69B | $718.9B |
| 1976 | $61B | $653.5B |
| 1975 | $55B | $576.6B |
| 1974 | $50B | $492.7B |
| 1973 | $45B | $469.1B |
| 1972 | $39B | $448.5B |
| 1971 | $36B | $424.1B |
| 1970 | $35B | $389.2B |
| 1969 | $30B | $368.2B |
| 1968 | $25B | $358.0B |
| 1967 | $23B | $344.7B |
| 1966 | $21B | $329.3B |
Interest payments represent seasonally adjusted annual rate at the end of Q4.
At current rates, the U.S. national debt is growing by a remarkable $1 trillion about every 100 days, equal to roughly $3.6 trillion per year.
As the national debt has ballooned, debt payments even exceeded Medicaid outlays in 2023—one of the government’s largest expenditures. On average, the U.S. spent more than $2 billion per day on interest costs last year. Going further, the U.S. government is projected to spend a historic $12.4 trillion on interest payments over the next decade, averaging about $37,100 per American.
Exacerbating matters is that the U.S. is running a steep deficit, which stood at $1.1 trillion for the first six months of fiscal 2024. This has accelerated due to the 43% increase in debt servicing costs along with a $31 billion dollar increase in defense spending from a year earlier. Additionally, a $30 billion increase in funding for the Federal Deposit Insurance Corporation in light of the regional banking crisis last year was a major contributor to the deficit increase.
Overall, the CBO forecasts that roughly 75% of the federal deficit’s increase will be due to interest costs by 2034.

-

 Real Estate2 weeks ago
Visualizing America’s Shortage of Affordable Homes
-

 Technology1 week ago
Ranked: Semiconductor Companies by Industry Revenue Share
-

 Money2 weeks ago
Which States Have the Highest Minimum Wage in America?
-

 Real Estate2 weeks ago
Ranked: The Most Valuable Housing Markets in America
-

 Business2 weeks ago
Charted: Big Four Market Share by S&P 500 Audits
-

 AI2 weeks ago
The Stock Performance of U.S. Chipmakers So Far in 2024
-

 Misc2 weeks ago
Almost Every EV Stock is Down After Q1 2024
-

 Money2 weeks ago
Where Does One U.S. Tax Dollar Go?