United States
Charted: Rising Mass Shootings in America
Article/Editing:
Charted: Rising Mass Shootings in America
The United States of America has a new fatal epidemic on its hands. But it’s not a new virus or disease; it’s the skyrocketing number of mass shootings.
On January 21, 2023, a gunman opened fire on a group celebrating the Lunar New Year in California, killing 10 and injuring 10 others.
This graphic by Pablo Alvarez used data from the Gun Violence Archive to track the number of mass shootings in the U.S. over the past eight years and highlight the states that have witnessed the worst of it.
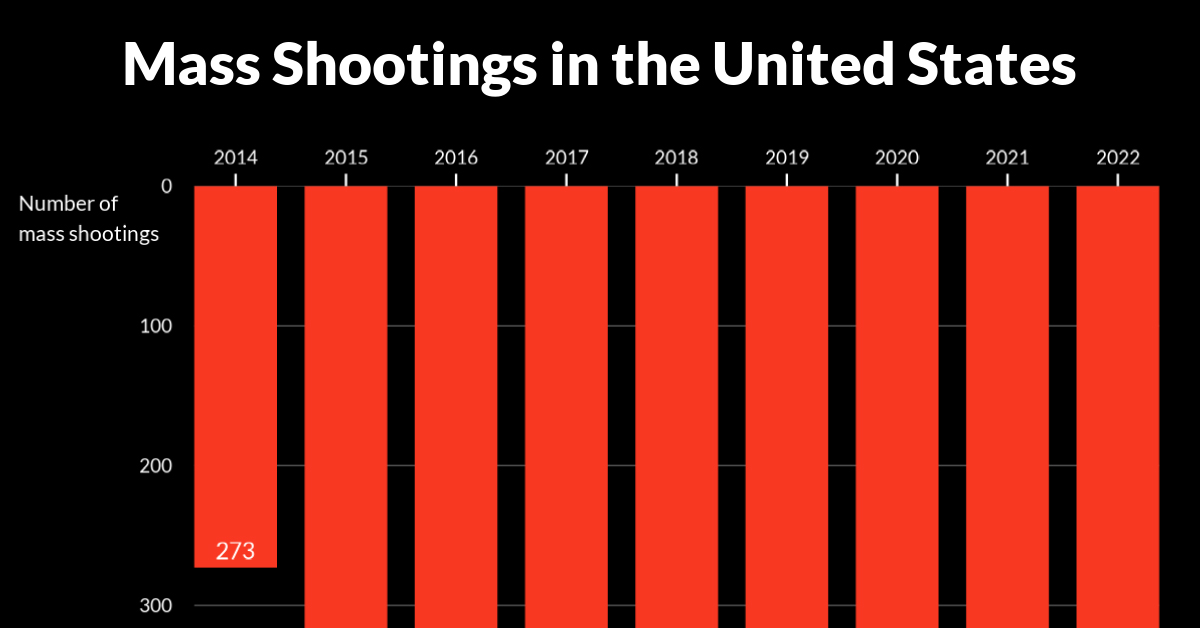
U.S. Mass Shootings From 2014‒2022
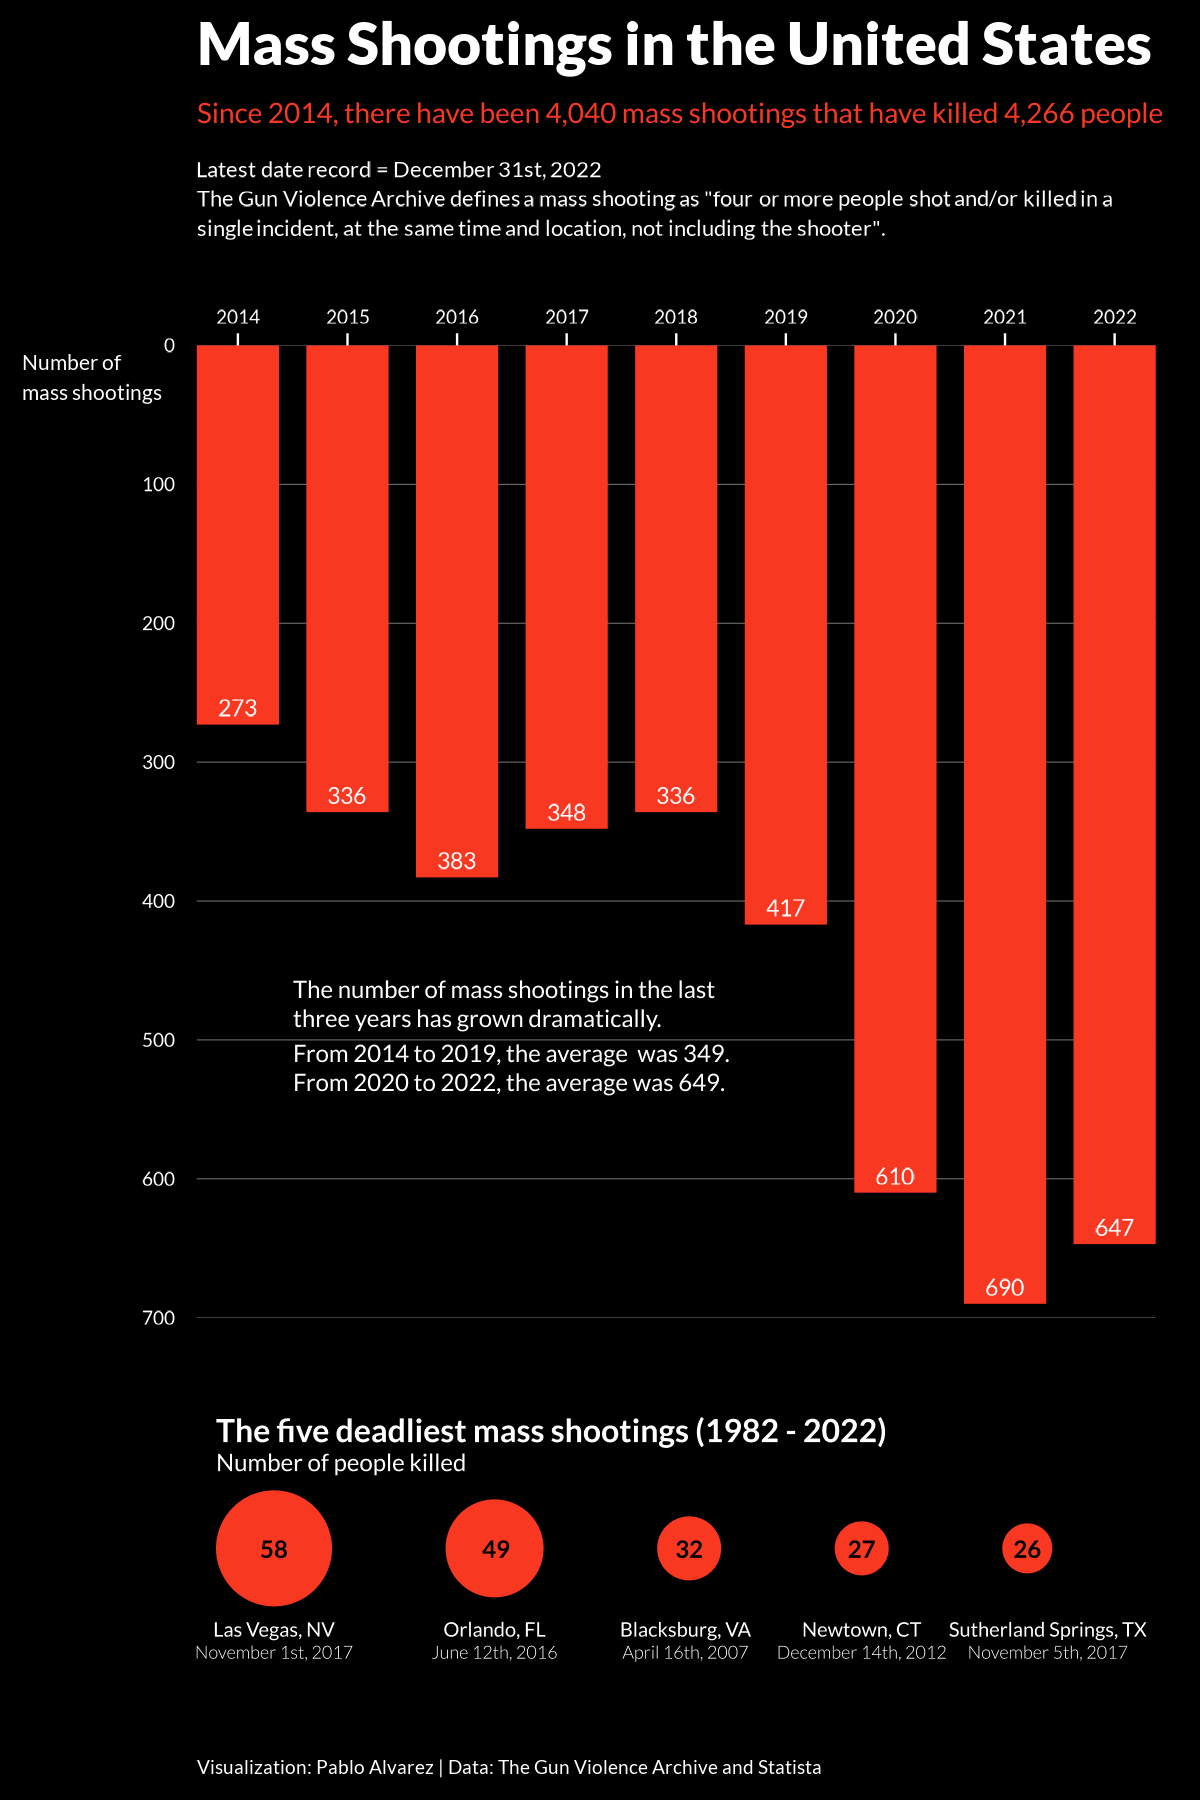
While gun violence has been a hot topic in the U.S. for many years, mass shootings are now visibly on the rise. In fact, they have almost doubled post-pandemic.
According to the Gun Violence Archive, mass shootings comprise incidents where four or more people (not including the shooter) are shot at the same time and in the same location.
| Year | Number of Mass Shootings | Killed | Injured |
|---|---|---|---|
| 2022 | 647 | 673 | 2700 |
| 2021 | 690 | 704 | 2827 |
| 2020 | 610 | 513 | 2540 |
| 2019 | 417 | 465 | 1712 |
| 2018 | 336 | 372 | 1330 |
| 2017 | 348 | 441 | 1807 |
| 2016 | 383 | 453 | 1539 |
| 2015 | 336 | 369 | 1337 |
| 2014 | 273 | 275 | 1086 |
Between 2020 and 2022, the U.S. saw 1,947 mass shootings. These tragic incidents killed 1890 people and left over 8,000 others injured.
Las Vegas witnessed the deadliest mass shooting in modern U.S. history on October 1, 2017, when a gunman opened fire on a crowd of 22,000 people attending a country music festival. The incident took 58 lives and injured over 500 people.
A year before this tragedy, 49 people lost their lives in the mass shooting at Orlando’s Pulse nightclub, with more than 50 additional people wounded. In fact, many of the deadliest mass shootings in U.S. history have occurred in the 21st century, and especially over the last 10 years.

This article was published as a part of Visual Capitalist's Creator Program, which features data-driven visuals from some of our favorite Creators around the world.


United States
Ranked: The Largest U.S. Corporations by Number of Employees
We visualized the top U.S. companies by employees, revealing the massive scale of retailers like Walmart, Target, and Home Depot.


The Largest U.S. Corporations by Number of Employees
This was originally posted on our Voronoi app. Download the app for free on Apple or Android and discover incredible data-driven charts from a variety of trusted sources.
Revenue and profit are common measures for measuring the size of a business, but what about employee headcount?
To see how big companies have become from a human perspective, we’ve visualized the top U.S. companies by employees. These figures come from companiesmarketcap.com, and were accessed in March 2024. Note that this ranking includes publicly-traded companies only.
Data and Highlights
The data we used to create this list of largest U.S. corporations by number of employees can be found in the table below.
| Company | Sector | Number of Employees |
|---|---|---|
| Walmart | Consumer Staples | 2,100,000 |
| Amazon | Consumer Discretionary | 1,500,000 |
| UPS | Industrials | 500,000 |
| Home Depot | Consumer Discretionary | 470,000 |
| Concentrix | Information Technology | 440,000 |
| Target | Consumer Staples | 440,000 |
| Kroger | Consumer Staples | 430,000 |
| UnitedHealth | Health Care | 400,000 |
| Berkshire Hathaway | Financials | 383,000 |
| Starbucks | Consumer Discretionary | 381,000 |
| Marriott International | Consumer Discretionary | 377,000 |
| Cognizant | Information Technology | 346,600 |
Retail and Logistics Top the List
Companies like Walmart, Target, and Kroger have a massive headcount due to having many locations spread across the country, which require everything from cashiers to IT professionals.
Moving goods around the world is also highly labor intensive, explaining why UPS has half a million employees globally.
Below the Radar?
Two companies that rank among the largest U.S. corporations by employees which may be less familiar to the public include Concentrix and Cognizant. Both of these companies are B2B brands, meaning they primarily work with other companies rather than consumers. This contrasts with brands like Amazon or Home Depot, which are much more visible among average consumers.
A Note on Berkshire Hathaway
Warren Buffett’s company doesn’t directly employ 383,000 people. This headcount actually includes the employees of the firm’s many subsidiaries, such as GEICO (insurance), Dairy Queen (retail), and Duracell (batteries).
If you’re curious to see how Buffett’s empire has grown over the years, check out this animated graphic that visualizes the growth of Berkshire Hathaway’s portfolio from 1994 to 2022.

-

 Markets1 week ago
U.S. Debt Interest Payments Reach $1 Trillion
-

 Business2 weeks ago
Charted: Big Four Market Share by S&P 500 Audits
-

 Markets2 weeks ago
Ranked: The Most Valuable Housing Markets in America
-

 Money2 weeks ago
Which States Have the Highest Minimum Wage in America?
-

 AI2 weeks ago
Ranked: Semiconductor Companies by Industry Revenue Share
-

 Markets2 weeks ago
Ranked: The World’s Top Flight Routes, by Revenue
-

 Demographics2 weeks ago
Population Projections: The World’s 6 Largest Countries in 2075
-

 Markets2 weeks ago
The Top 10 States by Real GDP Growth in 2023