Politics
Charted: How Latin America Drove U.S. Immigration from 1970–2019
Article/Editing:
Charted: How LatAm Drove U.S. Immigration from 1970–2019
LatAm, otherwise known as Latin America, has been one of the biggest sources of immigration to the U.S. over the last one hundred years.
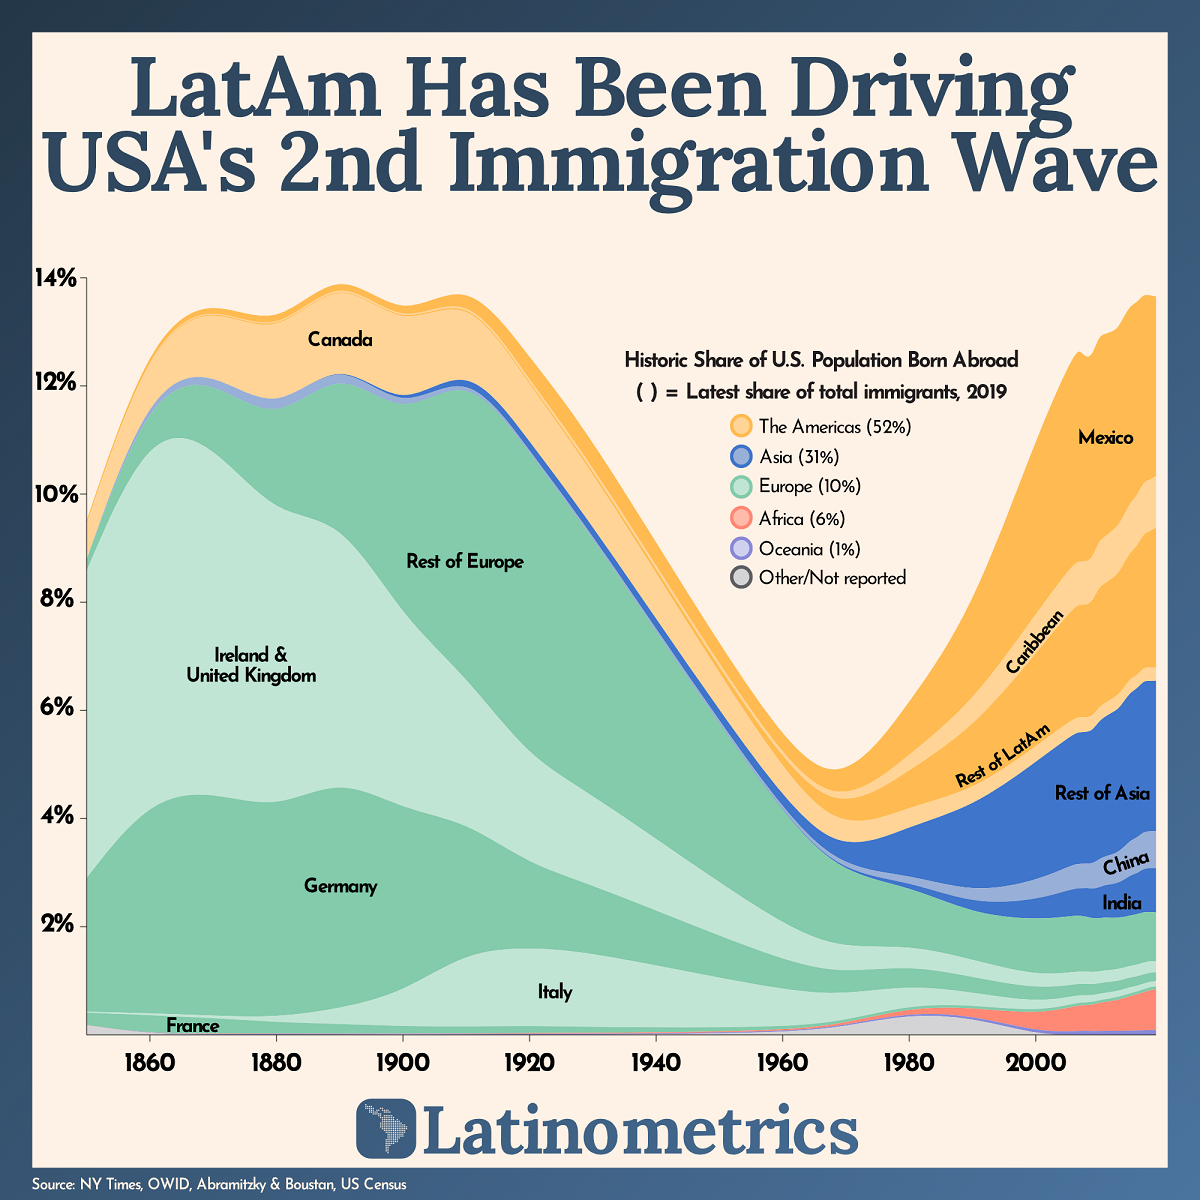
Since the 1970s, the region has driven the second wave of U.S. immigration and helped shape the country’s future immeasurably. This is especially clear when looking at Census data listing where people were born.
This chart from Latinometrics looks at the history of U.S. immigration considering both documented and undocumented immigration since 1850.
Historical U.S. Immigration
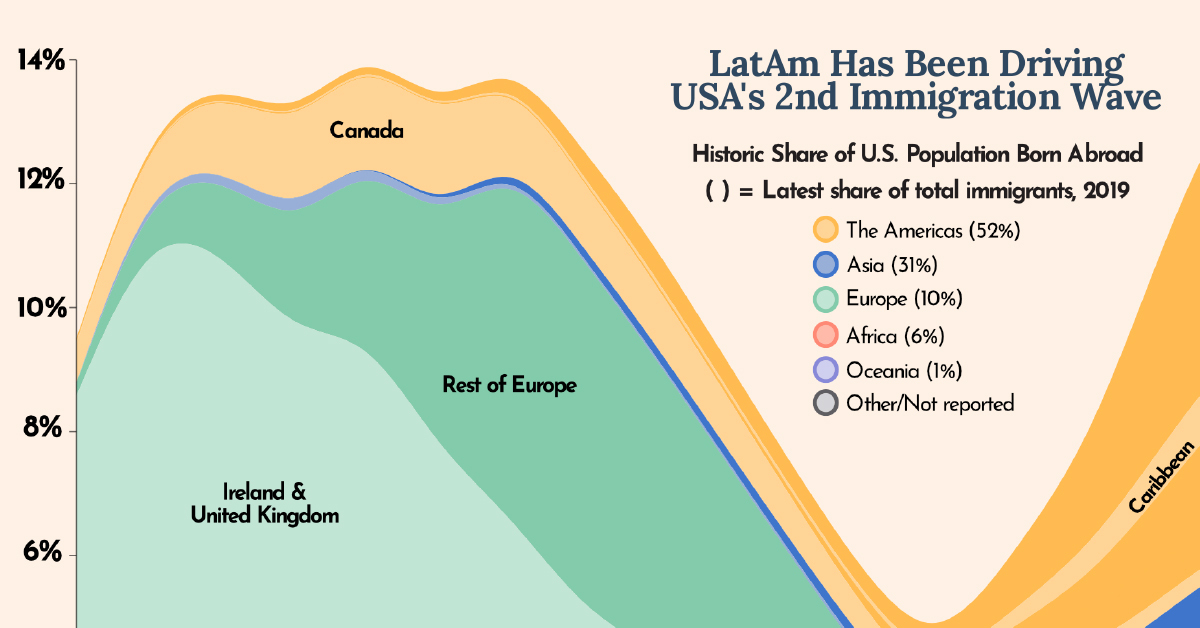
For most of its early history, Europeans drove immigration to the United States.
The UK, Ireland, and Germany were especially big sources of American immigrants well into the 20th century. But around the 1960-70s this began to shift, with LatAm countries marking the next wave of U.S. immigration.
ℹ️ LatAm includes all Central American, Caribbean, and South American countries.
Here’s a sample of the history of U.S. immigration using select years and regions:
| Region/Country | 1850 | 1900 | 1960 | 2000 | 2010 | 2015 | 2019 |
|---|---|---|---|---|---|---|---|
| 🇲🇽 Mexico | 13.3K | 103.4K | 575.9K | 9.2M | 11.7M | 11.6M | 10.9M |
| Rest of Asia | 377 | 36.7K | 379.0K | 6.2M | 7.9M | 8.8M | 9.2M |
| Rest of Latin America | 1.7K | 19.7K | 217.6K | 4.8M | 6.9M | 7.5M | 8.5M |
| Caribbean | 5.8K | 14.4K | 114.8K | 2.1M | 2.6M | 3.0M | 3.1M |
| Rest of Europe | 49.5K | 2.8M | 3.7M | 2.9M | 3.0M | 3.0M | 3.0M |
| 🇮🇳 India | - | 2.0K | 12.3K | 1.0M | 1.8M | 2.4M | 2.7M |
| Africa | 551 | 2.5K | 35.4K | 881.3K | 1.6M | 2.1M | 2.5M |
| 🇨🇳 China, excluding Hong Kong and Taiwan | 758 | 81.5K | 99.7K | 988.9K | 1.6M | 2.1M | 2.3M |
| 🇨🇦 Canada | 14.8K | 1.2M | 952.5K | 820.8K | 798.6K | 830.6K | 797.2K |
| 🇬🇧 United Kingdom | 1.3M | 2.8M | 1.2M | 677.8K | 669.8K | 683.5K | 677.9K |
| 🇩🇪 Germany | 583.8K | 2.7M | 989.8K | 706.7K | 604.6K | 585.3K | 537.7K |
| 🇮🇹 Italy | 3.7K | 484.0K | 1.3M | 473.3K | 365.0K | 352.5K | 314.9K |
| Oceania | 588 | 8.8K | 34.7K | 168.0K | 216.7K | 238.7K | 300.2K |
| 🇫🇷 France | 54.1K | 104.2K | 111.6K | 151.2K | 148.0K | 173.6K | 171.5K |
| Share of U.S. Population Made up of Immigrants | 9.8% | 13.3% | 5.7% | 11.0% | 12.9% | 13.5% | 13.7% |
LatAm Immigration
As of 2019, 22.6 million foreign-born people in the U.S. were originally from LatAm countries, with 10.9 million from Mexico alone.
Additionally, in 2021 Mexican citizens received the highest number of U.S. immigrant visas in the world at almost 40,600. Immigrant visas are the first step in the process to U.S. green cards and citizenship.
And though Asian countries are beginning to make up the majority of U.S. immigrant applicants and permits, other LatAm countries also ranked high in issued permits in 2021:
- 🇩🇴 Dominican Republic: 17.9K
- 🇸🇻 El Salvador: 7.8K
- 🇪🇨 Ecuador: 5.1K
- 🇨🇴 Colombia: 4.8K
Furthermore, there is also undocumented immigration to consider. According to 2019 figures from Brookings, there are between 10.5-12 million undocumented migrants living in the U.S.—making up just over 3% of the population.
Here’s a look at the top five countries in terms of undocumented immigration to the U.S. in 2019, most of which are LatAm countries:
| Country | Number of Immigrants | % of Total Undocumented Population |
|---|---|---|
| 🇲🇽 Mexico | 5,313,000 | 48% |
| 🇸🇻 El Salvador | 741,000 | 7% |
| 🇬🇹 Guatemala | 724,000 | 7% |
| 🇮🇳 India | 553,000 | 5% |
| 🇭🇳 Honduras | 490,000 | 4% |
The Future of U.S. Immigration
In the last few years, more and more Asian countries are seeing their citizens leave for the United States. In addition, the knock-on effects of the COVID-19 pandemic and the Russo-Ukrainian War (as well as other global events and crises) could shift U.S. immigration even further away from LatAm.
Currently, the U.S. is only permitting small numbers of legal immigrants to enter the country each year, numbering in only the hundreds of thousands. But as birth rates decline, the growth in the foreign-born population will continue to be a much-discussed and important topic for the country’s demographics in the coming years.

This article was published as a part of Visual Capitalist's Creator Program, which features data-driven visuals from some of our favorite Creators around the world.


War
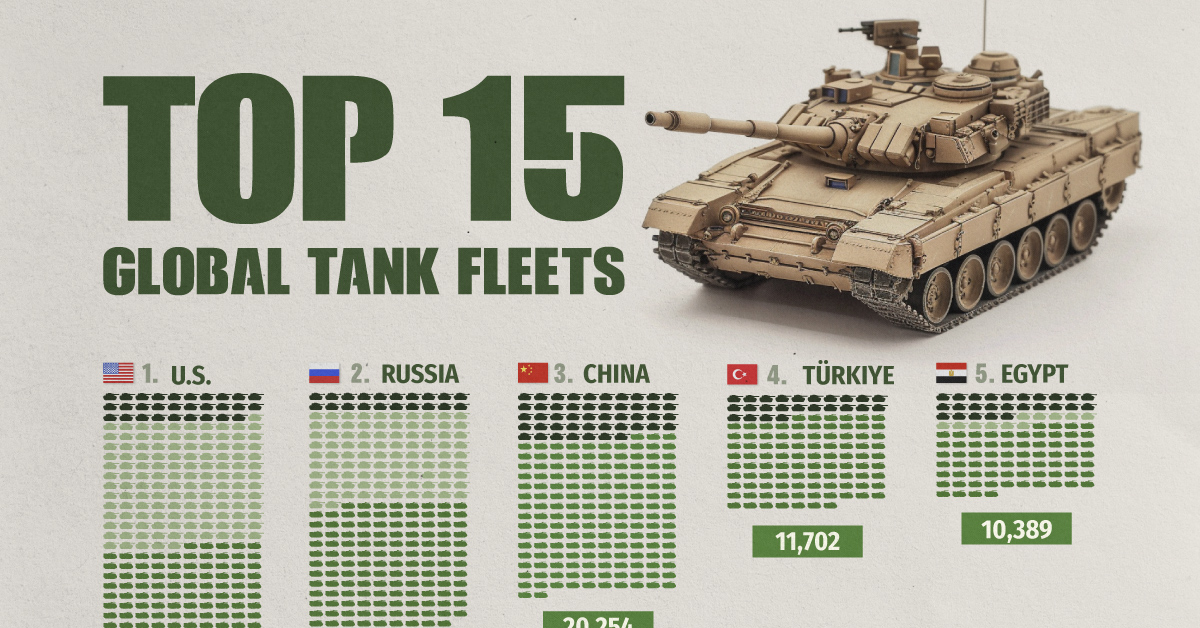
Visualized: Top 15 Global Tank Fleets
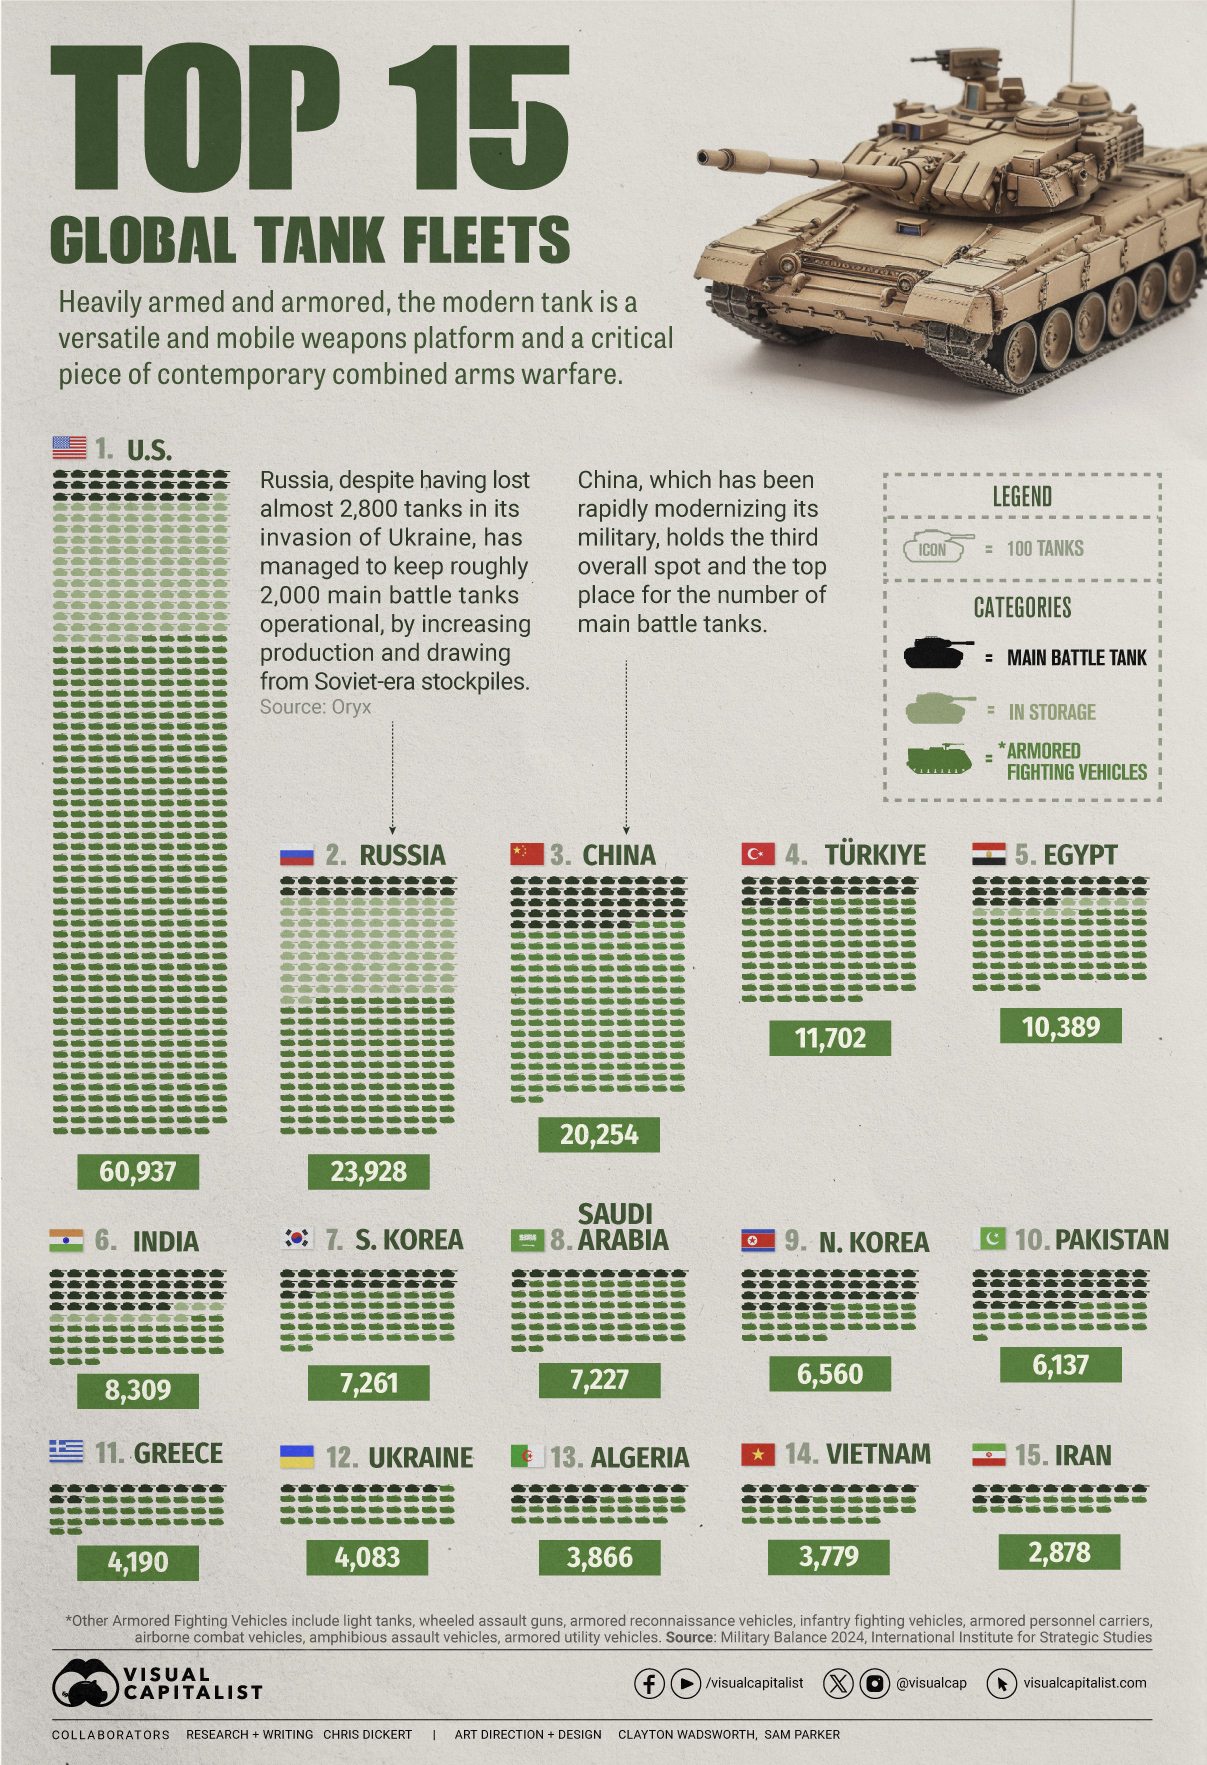
Heavily armed and armored, the modern tank is a versatile and mobile weapons platform, and a critical piece of contemporary warfare.
The Top 15 Global Tank Fleets
This was originally posted on our Voronoi app. Download the app for free on iOS or Android and discover incredible data-driven charts from a variety of trusted sources.
Heavily armed and armored, the modern tank is a versatile and mobile weapons platform, and a critical piece of contemporary warfare.
This visualization shows the top 15 global tank fleets, using data from the 2024 Military Balance report from the International Institute for Strategic Studies (IISS).
Let’s take an in-depth look at the top three fleets:
1. United States
As the world’s pre-eminent military power, it’s perhaps no surprise that the United States also has the largest tank fleet, by a wide margin.
In total, they have just over 45,000 armored fighting vehicles in operation, along with 2,640 main battle tanks (MBTs), and 12,800 vehicles in storage, of which 2,000 are main battle tanks.
| Category | Vehicles | Global rank |
|---|---|---|
| Main battle tanks | 2,640 | 4 |
| Armored reconnaissance | 1,745 | 1 |
| Infantry fighting vehicles | 3,262 | 3 |
| Armored personnel carriers | 10,644 | 1 |
| Amphibious assault vehicles | 1,401 | 1 |
| Armored utility vehicles | 28,445 | 1 |
| Storage | 12,800 | 1 |
| Total | 60,937 | 1 |
The U.S. is internalizing the lessons from the ongoing invasion of Ukraine, where Western-supplied anti-tank weapons and massed Ukrainian artillery have been cutting Russian tanks to pieces. As a result, the U.S. recently canceled an upgrade of the M1 Abrams in favor of a more ambitious upgrade.
Meanwhile, the U.S. is nervously eyeing a more confident China and a potential clash over Taiwan, where air and naval forces will be critical. However, a recent war game showed that Taiwanese mechanized ground forces, kitted out with American-made tanks and armored fighting vehicles, were critical in keeping the island autonomous.
2. Russia
According to Oryx, a Dutch open-source intelligence defense website, at time of writing, Russia has lost almost 2,800 main battle tanks since invading Ukraine. Considering that in the 2022 edition of the Military Balance, Russia was estimated to have 2,927 MBTs in operation, those are some hefty losses.
Russia has been able to maintain about 2,000 MBTs in the field, in part, by increasing domestic production. Many defense plants have been taken over by state-owned Rostec and now operate around the clock. Russia is also now spending a full third of their budget on defense, equivalent to about 7.5% of GDP.
At the same time, they’ve also been drawing down their Soviet-era stockpiles, which are modernized before being sent to the front. Just how long they can keep this up is an open question; their stockpiles are large, but not limitless. Here is what their storage levels look like:
| Category | 2023 | 2024 | YOY change |
|---|---|---|---|
| Main battle tanks | 5,000 | 4,000 | -20.0% |
| Armored reconnaissance | 1,000 | 100 | -90.0% |
| Infantry fighting vehicles | 4,000 | 2,800 | -30.0% |
| Armored personnel carriers | 6,000 | 2,300 | -61.7% |
| Total | 16,000 | 9,200 | -42.5% |
3. China
China holds the third overall spot and top place globally for the number of main battle tanks in operation. Untypically, the People’s Liberation Army has no armored vehicles in storage, which perhaps isn’t surprising when you consider that China has been rapidly modernizing its military and that stockpiles usually contain older models.
China also has one of the world’s largest fleets of armored fighting vehicles, second only to the United States. Breaking down that headline number, we can also see that they have the largest number of light tanks, wheeled guns, and infantry fighting vehicles.
| Category | Vehicles | Global rank |
|---|---|---|
| Main battle tanks | 4,700 | 1 |
| Light tanks | 1,330 | 1 |
| Wheeled guns | 1,250 | 1 |
| Infantry fighting vehicles | 8,200 | 1 |
| Armored personnel carriers | 3,604 | 5 |
| Airborne combat vehicles | 180 | 2 |
| Amphibious assault vehicles | 990 | 2 |
| Total | 20,254 | 3 |
This is equipment that would be integral if China were to make an attempt to reunify Taiwan with the mainland by force, where lightly armored mechanized units need to move with speed to occupy the island before Western allies can enter the fray. It’s worth noting that China also has one of the world’s largest fleets of amphibious assault vehicles.
End of the Tank?
Many commentators at the outset of Russia’s invasion of Ukraine, were quick to predict the end of the tank, however, to paraphrase Mark Twain, reports of the tank’s demise are greatly exaggerated.
With the U.S. and China both developing remote and autonomous armored vehicles, tanks could be quite different in the future, but there is nothing else that matches them for firepower, mobility, and survivability on the modern battlefield today.

-

 Markets1 week ago
U.S. Debt Interest Payments Reach $1 Trillion
-

 Business2 weeks ago
Charted: Big Four Market Share by S&P 500 Audits
-

 Real Estate2 weeks ago
Ranked: The Most Valuable Housing Markets in America
-

 Money2 weeks ago
Which States Have the Highest Minimum Wage in America?
-

 AI2 weeks ago
Ranked: Semiconductor Companies by Industry Revenue Share
-

 Markets2 weeks ago
Ranked: The World’s Top Flight Routes, by Revenue
-

 Demographics2 weeks ago
Population Projections: The World’s 6 Largest Countries in 2075
-

 Markets2 weeks ago
The Top 10 States by Real GDP Growth in 2023