Markets
Visualizing Countries Grouped by Their Largest Trading Partner (1960-2020)
Article/Editing:
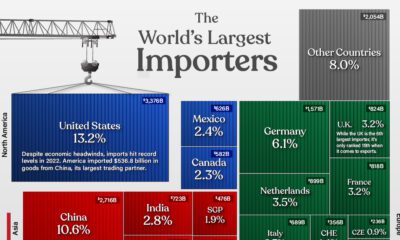
Amidst supply chain issues and inflated shipping costs, global trade continued to grow last year, reaching an estimated $28 trillion in 2021—a 23% increase compared to the year prior.
Which countries are the central nodes of the global trade network? While China is currently the world’s largest trading partner, this hasn’t always been the case.
This series of graphics by Anders Sundell outlines the history of the world’s biggest trade hubs, showing how the landscape has evolved since 1960. Using netgraphs, each visual connects countries to their primary trading partner, using data that includes both imports and exports.
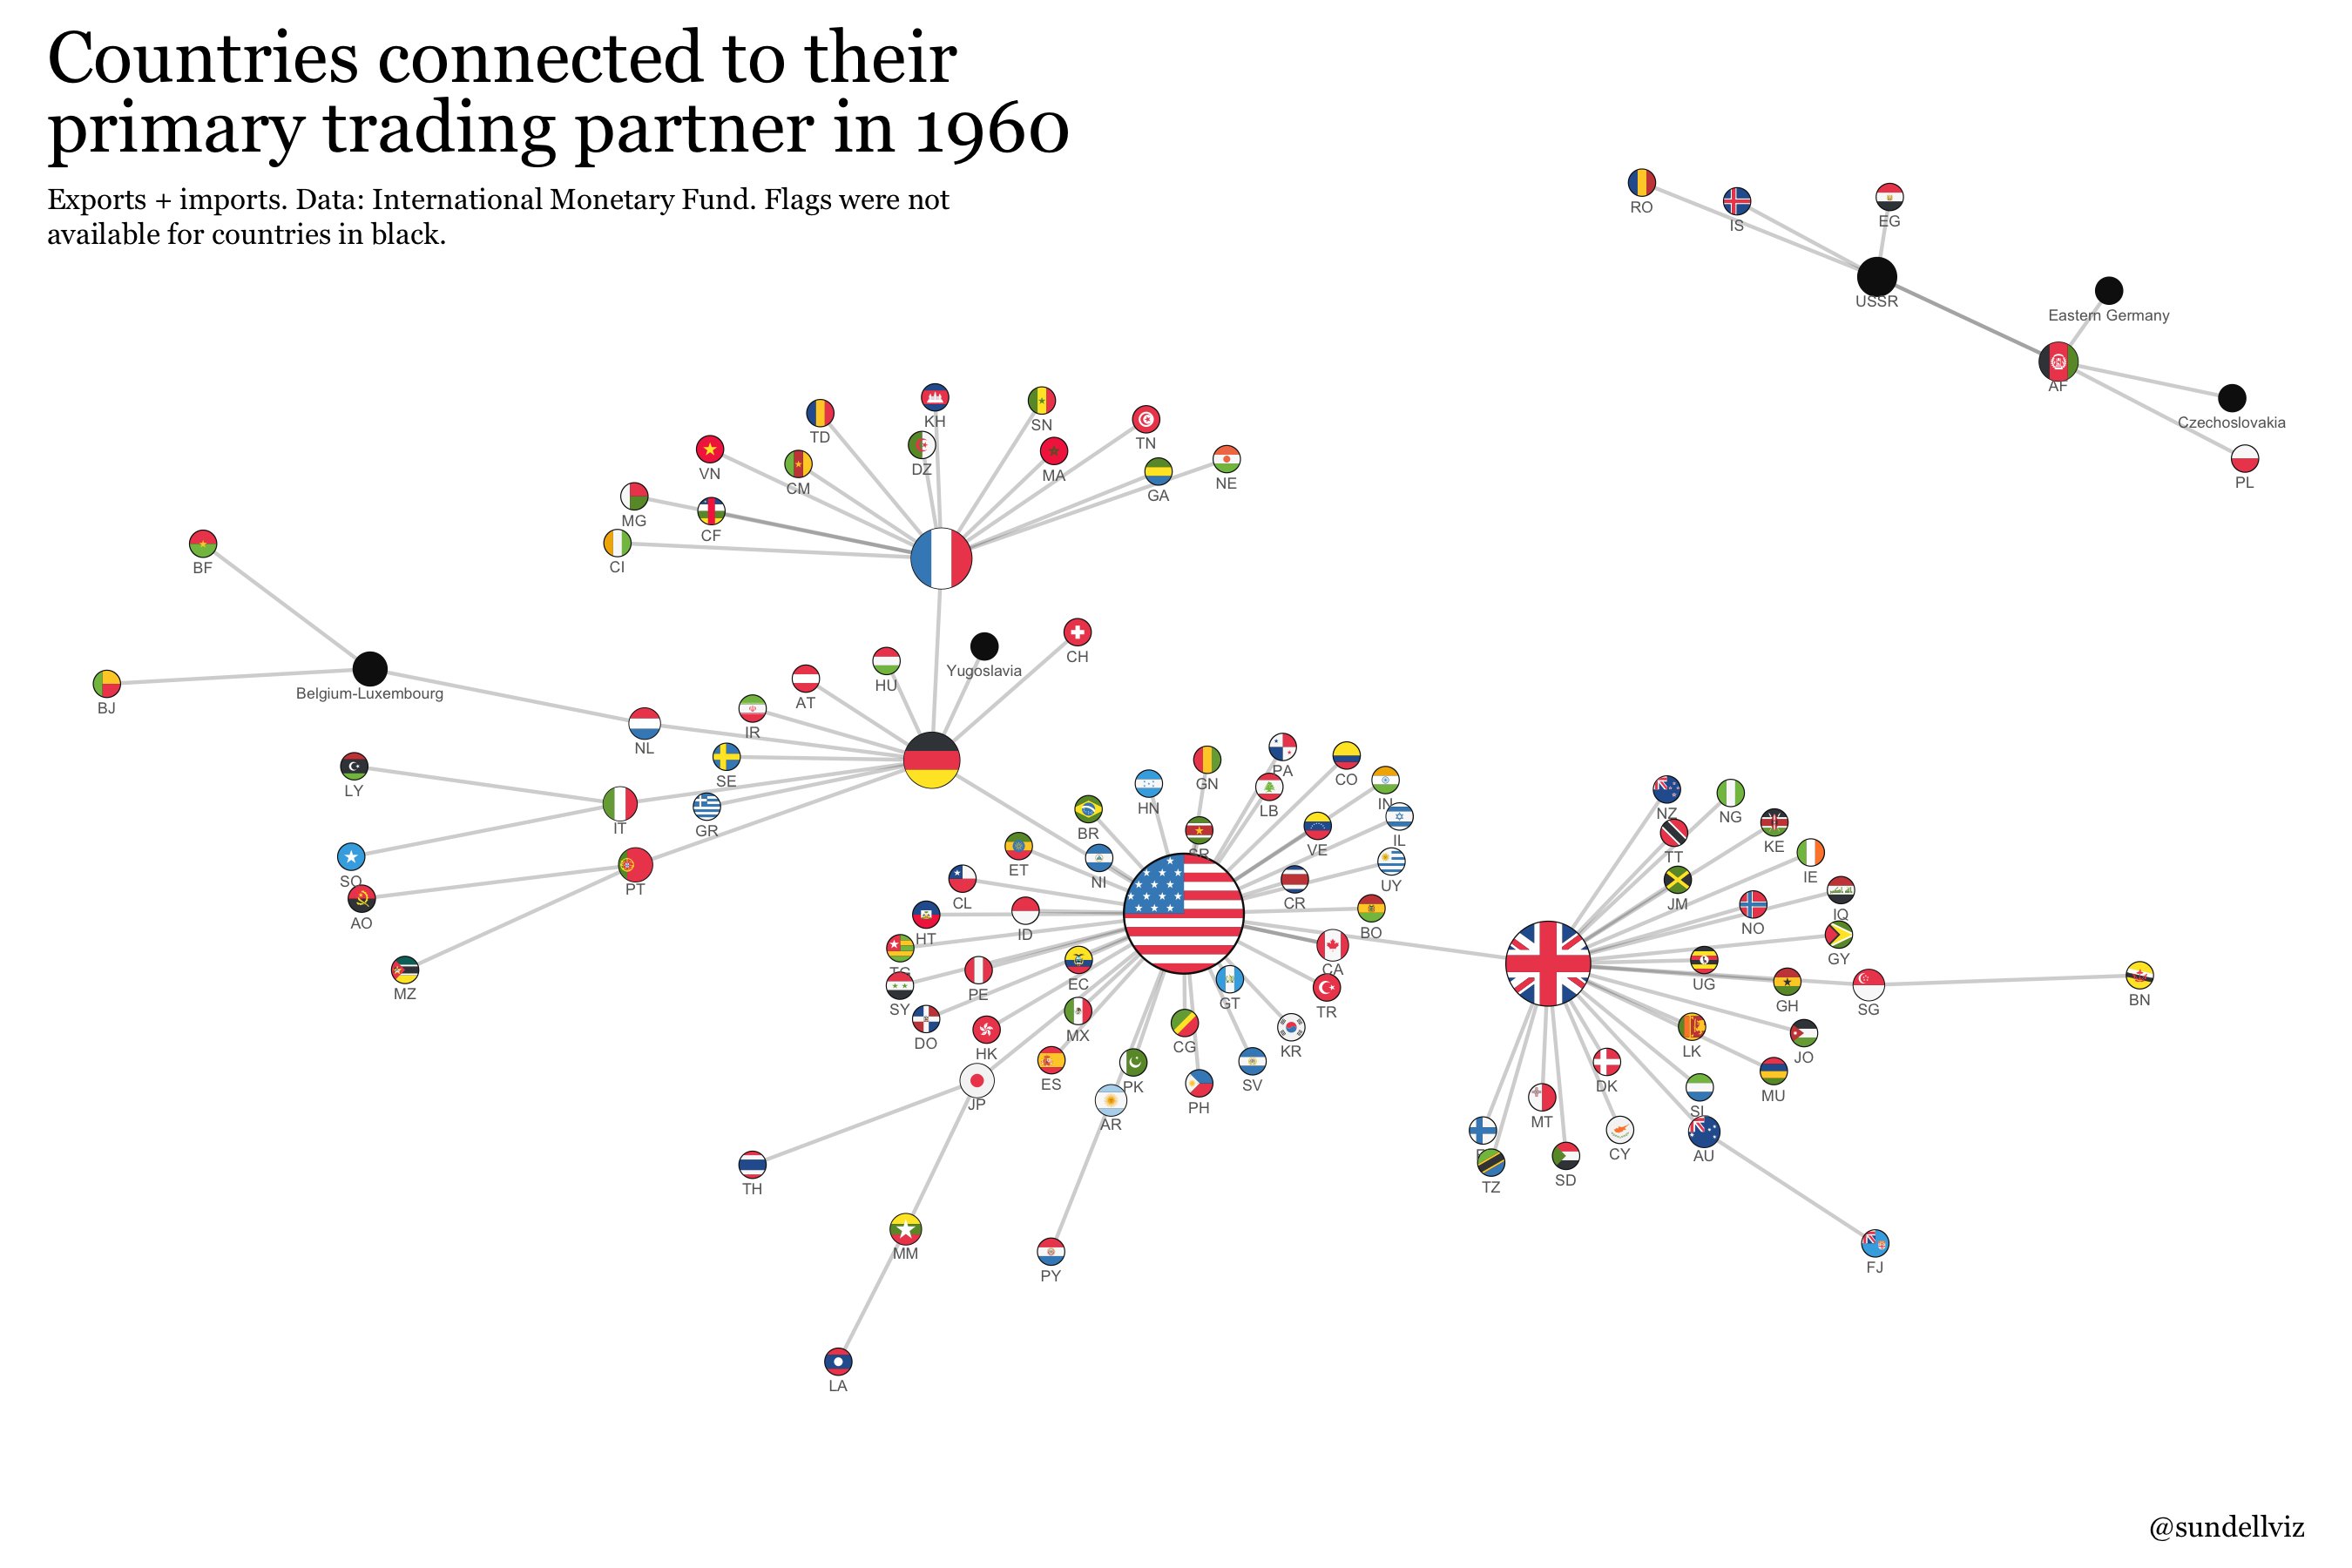
1960: A Period of U.S. Trade Dominance
International trade has existed for millennia, and had previously been accomplished through famous trade routes like the Silk Road, which transported luxury goods from China to Europe since the first century BCE.
However, our story begins in the 1960s—just before containerization spread from the United States around the world, transforming global trade forever.
View the full-size infographic
In the 1960s, the U.S. was experiencing its post-war economic boom. Consumer spending was driving swift economic growth, and a rising middle class led to increased demand for luxury goods like TVs and cars. In response to this rising demand, U.S. factories that had been essential to the war effort swooped in quickly, and domestic production began to thrive.
Around the same time, legislation that encouraged international trade was being passed through Congress. In 1962, President John F. Kennedy signed the Trade Expansion Act into law, allowing the American government to negotiate massive tariff cuts with other countries. This ultimately led to the Kennedy Round two years later, which was a series of trade negotiations that resulted in lower tariffs and reduced barriers on exports for developing countries.
Across the pond, Europe was going through its own series of changes in the 1960s. While Britain was the most important player in trade in Europe at the time, the country was also struggling to recover from the financial burden of the two world wars.
Simultaneously, European countries were also banding together in an attempt to balance power and eliminate hegemony within Europe. In 1960, the European Free Trade Association (EFTA) was created, creating free trade agreements between Austria, Denmark, Norway, Portugal, Sweden, Switzerland, and the United Kingdom.
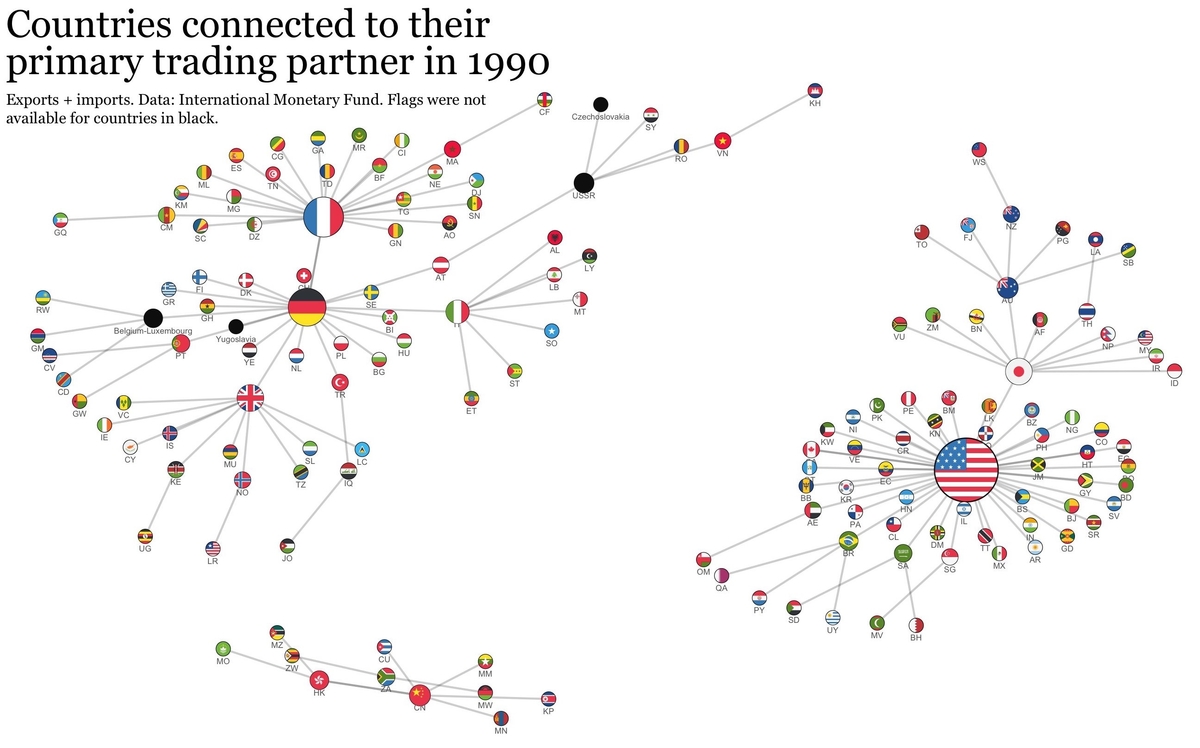
1990: The Emergence of China
By 1990, the world’s international trade landscape was on the cusp of dramatic change.
View the full-size infographic
For starters, Britain’s global trade dominance had dwindled further, and a newly united Germany had stepped up to pick up the slack. Germany’s automobile industry started to expand rapidly around this time. In 1990, Germany exported 2.6 million cars worldwide, which was fewer than Japan shipped that year, but still enough to make Germany one of the most important trade hubs at the time.
1990 was also around the same time that China was starting to emerge as a global leader. The country’s economy had been picking up steam over the previous decade, thanks to a series of reforms brought on by then-leader Deng Xiaoping that were created to encourage foreign investment and boost international trade.
This new focus on economic growth in China spurred the rapid expansion of free trade zones in the country, which granted certain areas special liberties on importing and exporting goods.
Throughout the 1990s, China’s economic prosperity continued, and its role in international trade became increasingly significant. Finally, at the end of the decade, China became a member of the World Trade Organization, giving the country an unparalleled opportunity to establish itself further as a major global trading partner.
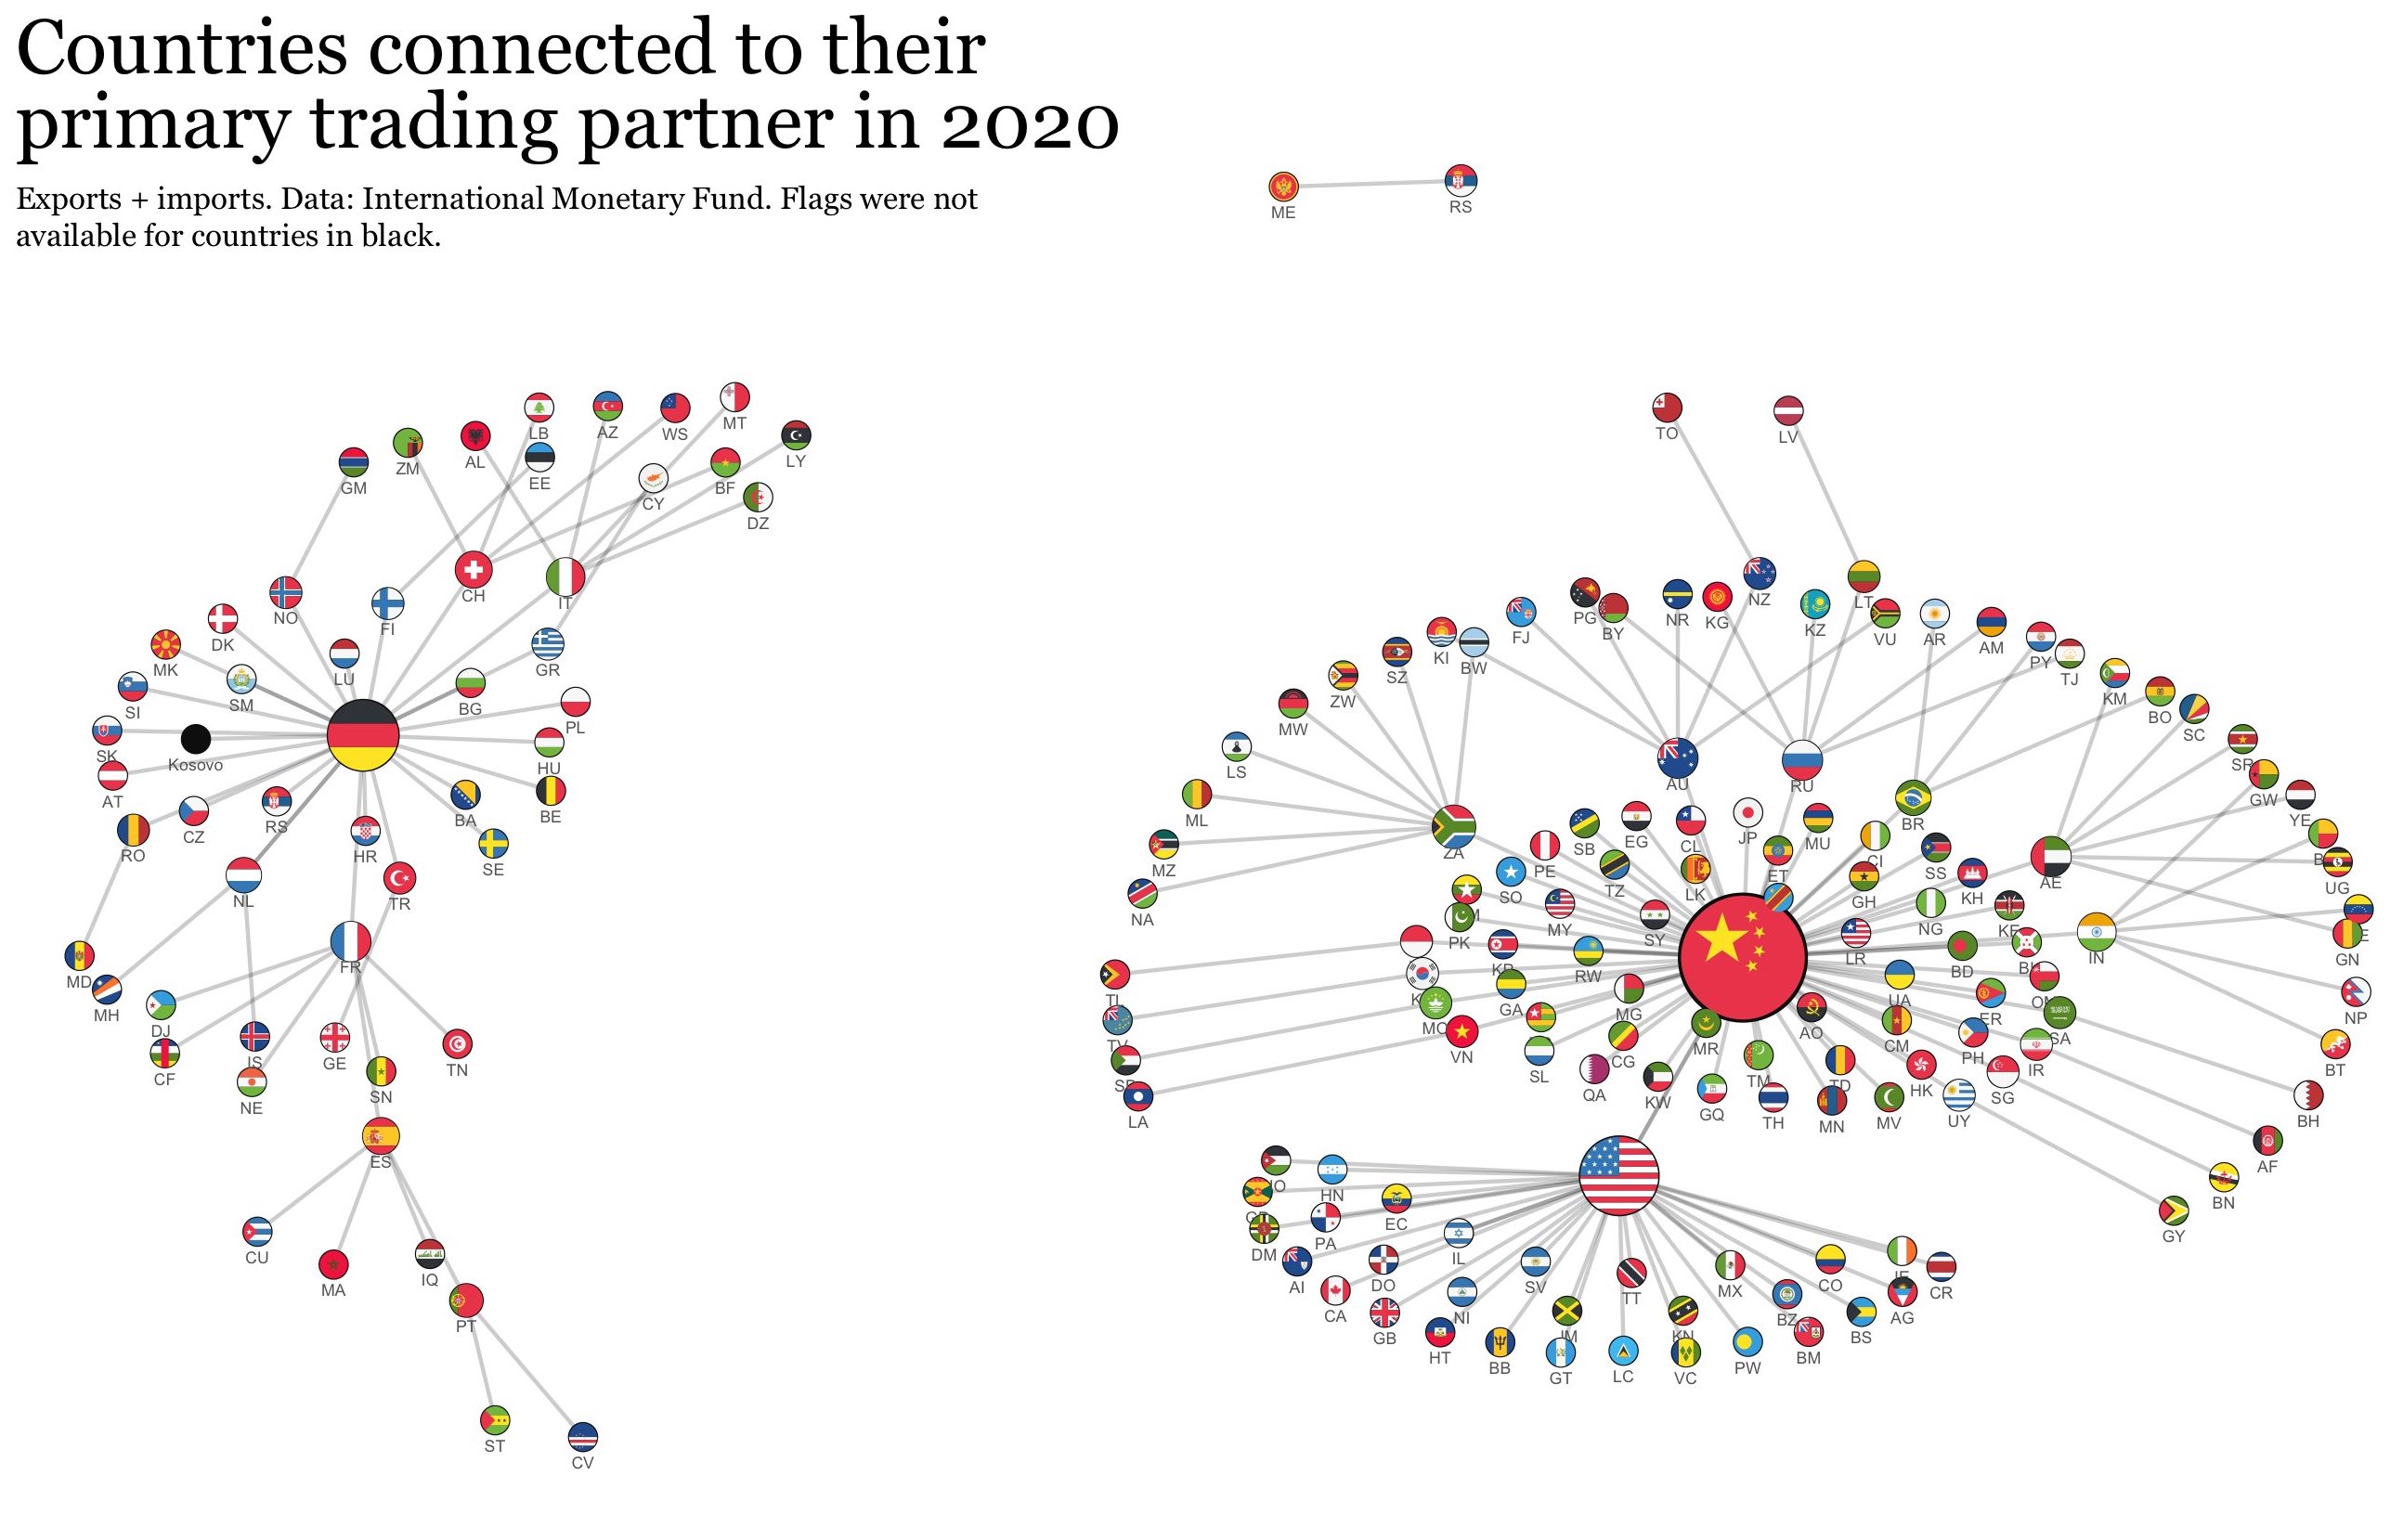
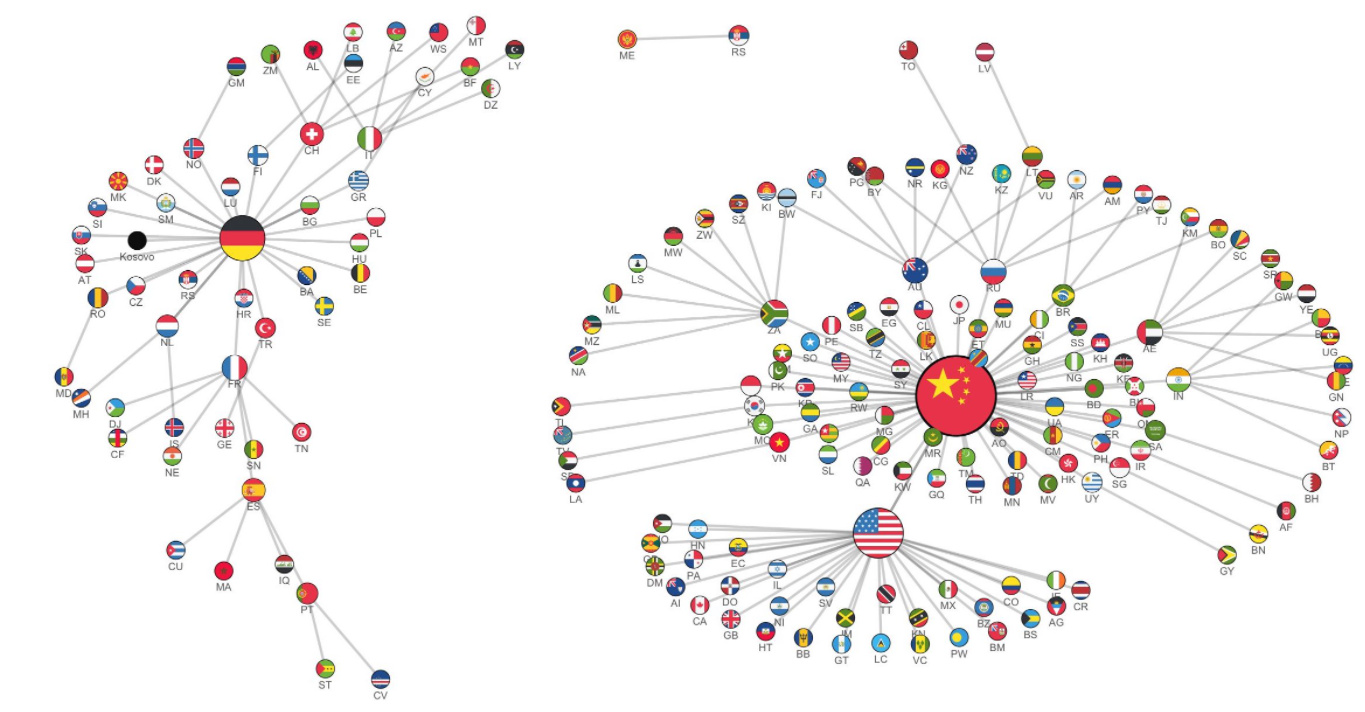
2020: A New World Order
By 2020, China had overtaken the U.S. as the world’s biggest trade partner. But as the country’s influence grew, so did tensions between the U.S. and China.
View the full-size infographic
In 2018, the Trump administration set tariffs on more than $360 billion in goods, in an effort to encourage Americans to purchase domestic products. In response, China set its own tariffs on more than $110 billion worth of U.S. goods.
The conflict is still ongoing, and so far, there’s no clear winner in sight. The tariffs and trade barriers have hurt both countries, and with bilateral trade sputtering, many are left wondering if the peak of globalization is well behind us.

This article was published as a part of Visual Capitalist's Creator Program, which features data-driven visuals from some of our favorite Creators around the world.


Markets
U.S. Debt Interest Payments Reach $1 Trillion
U.S. debt interest payments have surged past the $1 trillion dollar mark, amid high interest rates and an ever-expanding debt burden.


U.S. Debt Interest Payments Reach $1 Trillion
This was originally posted on our Voronoi app. Download the app for free on iOS or Android and discover incredible data-driven charts from a variety of trusted sources.
The cost of paying for America’s national debt crossed the $1 trillion dollar mark in 2023, driven by high interest rates and a record $34 trillion mountain of debt.
Over the last decade, U.S. debt interest payments have more than doubled amid vast government spending during the pandemic crisis. As debt payments continue to soar, the Congressional Budget Office (CBO) reported that debt servicing costs surpassed defense spending for the first time ever this year.
This graphic shows the sharp rise in U.S. debt payments, based on data from the Federal Reserve.
A $1 Trillion Interest Bill, and Growing
Below, we show how U.S. debt interest payments have risen at a faster pace than at another time in modern history:
| Date | Interest Payments | U.S. National Debt |
|---|---|---|
| 2023 | $1.0T | $34.0T |
| 2022 | $830B | $31.4T |
| 2021 | $612B | $29.6T |
| 2020 | $518B | $27.7T |
| 2019 | $564B | $23.2T |
| 2018 | $571B | $22.0T |
| 2017 | $493B | $20.5T |
| 2016 | $460B | $20.0T |
| 2015 | $435B | $18.9T |
| 2014 | $442B | $18.1T |
| 2013 | $425B | $17.2T |
| 2012 | $417B | $16.4T |
| 2011 | $433B | $15.2T |
| 2010 | $400B | $14.0T |
| 2009 | $354B | $12.3T |
| 2008 | $380B | $10.7T |
| 2007 | $414B | $9.2T |
| 2006 | $387B | $8.7T |
| 2005 | $355B | $8.2T |
| 2004 | $318B | $7.6T |
| 2003 | $294B | $7.0T |
| 2002 | $298B | $6.4T |
| 2001 | $318B | $5.9T |
| 2000 | $353B | $5.7T |
| 1999 | $353B | $5.8T |
| 1998 | $360B | $5.6T |
| 1997 | $368B | $5.5T |
| 1996 | $362B | $5.3T |
| 1995 | $357B | $5.0T |
| 1994 | $334B | $4.8T |
| 1993 | $311B | $4.5T |
| 1992 | $306B | $4.2T |
| 1991 | $308B | $3.8T |
| 1990 | $298B | $3.4T |
| 1989 | $275B | $3.0T |
| 1988 | $254B | $2.7T |
| 1987 | $240B | $2.4T |
| 1986 | $225B | $2.2T |
| 1985 | $219B | $1.9T |
| 1984 | $205B | $1.7T |
| 1983 | $176B | $1.4T |
| 1982 | $157B | $1.2T |
| 1981 | $142B | $1.0T |
| 1980 | $113B | $930.2B |
| 1979 | $96B | $845.1B |
| 1978 | $84B | $789.2B |
| 1977 | $69B | $718.9B |
| 1976 | $61B | $653.5B |
| 1975 | $55B | $576.6B |
| 1974 | $50B | $492.7B |
| 1973 | $45B | $469.1B |
| 1972 | $39B | $448.5B |
| 1971 | $36B | $424.1B |
| 1970 | $35B | $389.2B |
| 1969 | $30B | $368.2B |
| 1968 | $25B | $358.0B |
| 1967 | $23B | $344.7B |
| 1966 | $21B | $329.3B |
Interest payments represent seasonally adjusted annual rate at the end of Q4.
At current rates, the U.S. national debt is growing by a remarkable $1 trillion about every 100 days, equal to roughly $3.6 trillion per year.
As the national debt has ballooned, debt payments even exceeded Medicaid outlays in 2023—one of the government’s largest expenditures. On average, the U.S. spent more than $2 billion per day on interest costs last year. Going further, the U.S. government is projected to spend a historic $12.4 trillion on interest payments over the next decade, averaging about $37,100 per American.
Exacerbating matters is that the U.S. is running a steep deficit, which stood at $1.1 trillion for the first six months of fiscal 2024. This has accelerated due to the 43% increase in debt servicing costs along with a $31 billion dollar increase in defense spending from a year earlier. Additionally, a $30 billion increase in funding for the Federal Deposit Insurance Corporation in light of the regional banking crisis last year was a major contributor to the deficit increase.
Overall, the CBO forecasts that roughly 75% of the federal deficit’s increase will be due to interest costs by 2034.

-

 Real Estate2 weeks ago
Visualizing America’s Shortage of Affordable Homes
-

 Technology1 week ago
Ranked: Semiconductor Companies by Industry Revenue Share
-

 Money1 week ago
Which States Have the Highest Minimum Wage in America?
-

 Real Estate1 week ago
Ranked: The Most Valuable Housing Markets in America
-

 Business2 weeks ago
Charted: Big Four Market Share by S&P 500 Audits
-

 AI2 weeks ago
The Stock Performance of U.S. Chipmakers So Far in 2024
-

 Misc2 weeks ago
Almost Every EV Stock is Down After Q1 2024
-

 Money2 weeks ago
Where Does One U.S. Tax Dollar Go?