Markets
Animation: Berkshire Hathaway’s Holdings Since 1994
Article/Editing:
Visualizing Berkshire Hathaway’s Holdings Since 1994
If you’re a long-time follower of Visual Capitalist, then you probably know that we’re big fans of Warren Buffett.
We’ve written numerous articles about the world-famous investor, covering everything from his early years to his most famous quotes. As one of the wealthiest and most influential investors in the world, he’s an important market player to keep track of.
As our latest addition to the Warren Buffett archives, this animated video by Sjoerd Tilmans highlights three decades of Warren Buffett’s investments. It shows what his holding company, Berkshire Hathaway, has been invested in since 1994, using data from the company’s financial reports.
A Rocky Start: The Early Years of Berkshire Hathaway
Before becoming the multinational conglomerate that it is today, Berkshire Hathaway was once a massive (yet struggling) textile company in Rhode Island.
Buffett first invested in the company in the late 1950s, when the company’s shares were declining. By 1964, things still hadn’t picked up for the company, and Buffett was ready to cut his losses and move on.
But when industrialist Seabury Stanton, the CEO of Berkshire Hathaway at the time, offered to buy Buffett out for less than the price he’d originally promised, things got interesting. Buffett was so furious by the offer that instead of selling his shares, he bought more, eventually taking control of the company and letting Stanton go.
The textile company never recovered, and Berkshire Hathaway eventually became Buffett’s holding company for other investments. He estimates that his investment in Berkshire Hathaway ultimately cost him $200 billion.
A Brighter Future: Berkshire Hathaway Now
Despite its tumultuous past, Berkshire Hathaway is now associated with tremendous financial success. In 2021, the conglomerate generated over $276 billion in total revenue.
And Buffett has about a 38% stake in the company, which means he’s one of the wealthiest people on the planet. As of today’s publication date, his net worth sits at $93.3 billion.
In the long run, Berkshire Hathaway has outperformed the market by a landslide. Here’s a look at the holding company’s compounded annual gain, and overall gain, compared to the S&P 500:
| Berkshire Hathaway | S&P 500 | |
|---|---|---|
| Compounded Annual Gain (1965-2021) | 20.1% | 10.5% |
| Overall Gain (1964-2021) | 3,641,613% | 30,209% |
Note: These figures are from Berkshire Hathaway’s (BH) Annual Report. BH’s market value is after-tax, and S&P 500 is pre-tax, including dividends.
According to the conglomerate’s website, it owns 62 different companies outright, including big names like GEICO, Dairy Queen, Kraft Heinz, and Duracell, and also has large investments in companies like Apple, Wells Fargo, and Coca-Cola.
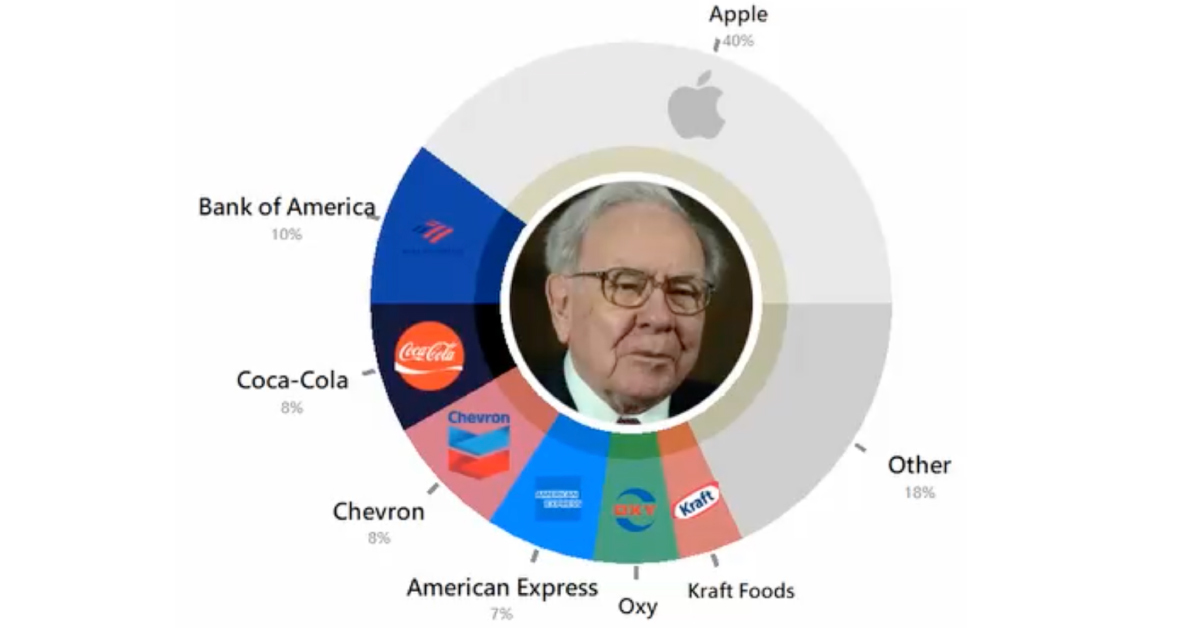
However, as the graphic above indicates, the exact composition of its portfolio has certainly evolved over the years. As of June 2022, here’s a breakdown of Berkshire Hathaway Holdings:
| Company | Value (Millions) | % of Portfolio |
|---|---|---|
| Apple | $122,337 | 40% |
| American Express | $21,016 | 7% |
| Bank of America | $31,444 | 10% |
| Coca-Cola | $25,164 | 8% |
| Chevron | $23,373 | 8% |
| Kraft Foods | $12,419 | 4% |
| Other | $71,559 | 23% |
It’s a well-balanced portfolio of big tech, banks, and consumer goods. Despite being 92 years old, Buffett remains the chairman and CEO of the conglomerate.
As for future succession plans, Greg Abel has been selected as the successor to Buffett as CEO, while the the Guardian has reported that Buffett’s oldest son Howard is expected to take over as non-executive chair when his father is no longer in charge.

This article was published as a part of Visual Capitalist's Creator Program, which features data-driven visuals from some of our favorite Creators around the world.


Economy
Economic Growth Forecasts for G7 and BRICS Countries in 2024
The IMF has released its economic growth forecasts for 2024. How do the G7 and BRICS countries compare?


G7 & BRICS Real GDP Growth Forecasts for 2024
The International Monetary Fund’s (IMF) has released its real gross domestic product (GDP) growth forecasts for 2024, and while global growth is projected to stay steady at 3.2%, various major nations are seeing declining forecasts.
This chart visualizes the 2024 real GDP growth forecasts using data from the IMF’s 2024 World Economic Outlook for G7 and BRICS member nations along with Saudi Arabia, which is still considering an invitation to join the bloc.
Get the Key Insights of the IMF’s World Economic Outlook
Want a visual breakdown of the insights from the IMF’s 2024 World Economic Outlook report?
This visual is part of a special dispatch of the key takeaways exclusively for VC+ members.
Get the full dispatch of charts by signing up to VC+.
Mixed Economic Growth Prospects for Major Nations in 2024
Economic growth projections by the IMF for major nations are mixed, with the majority of G7 and BRICS countries forecasted to have slower growth in 2024 compared to 2023.
Only three BRICS-invited or member countries, Saudi Arabia, the UAE, and South Africa, have higher projected real GDP growth rates in 2024 than last year.
| Group | Country | Real GDP Growth (2023) | Real GDP Growth (2024P) |
|---|---|---|---|
| G7 | 🇺🇸 U.S. | 2.5% | 2.7% |
| G7 | 🇨🇦 Canada | 1.1% | 1.2% |
| G7 | 🇯🇵 Japan | 1.9% | 0.9% |
| G7 | 🇫🇷 France | 0.9% | 0.7% |
| G7 | 🇮🇹 Italy | 0.9% | 0.7% |
| G7 | 🇬🇧 UK | 0.1% | 0.5% |
| G7 | 🇩🇪 Germany | -0.3% | 0.2% |
| BRICS | 🇮🇳 India | 7.8% | 6.8% |
| BRICS | 🇨🇳 China | 5.2% | 4.6% |
| BRICS | 🇦🇪 UAE | 3.4% | 3.5% |
| BRICS | 🇮🇷 Iran | 4.7% | 3.3% |
| BRICS | 🇷🇺 Russia | 3.6% | 3.2% |
| BRICS | 🇪🇬 Egypt | 3.8% | 3.0% |
| BRICS-invited | 🇸🇦 Saudi Arabia | -0.8% | 2.6% |
| BRICS | 🇧🇷 Brazil | 2.9% | 2.2% |
| BRICS | 🇿🇦 South Africa | 0.6% | 0.9% |
| BRICS | 🇪🇹 Ethiopia | 7.2% | 6.2% |
| 🌍 World | 3.2% | 3.2% |
China and India are forecasted to maintain relatively high growth rates in 2024 at 4.6% and 6.8% respectively, but compared to the previous year, China is growing 0.6 percentage points slower while India is an entire percentage point slower.
On the other hand, four G7 nations are set to grow faster than last year, which includes Germany making its comeback from its negative real GDP growth of -0.3% in 2023.
Faster Growth for BRICS than G7 Nations
Despite mostly lower growth forecasts in 2024 compared to 2023, BRICS nations still have a significantly higher average growth forecast at 3.6% compared to the G7 average of 1%.
While the G7 countries’ combined GDP is around $15 trillion greater than the BRICS nations, with continued higher growth rates and the potential to add more members, BRICS looks likely to overtake the G7 in economic size within two decades.
BRICS Expansion Stutters Before October 2024 Summit
BRICS’ recent expansion has stuttered slightly, as Argentina’s newly-elected president Javier Milei declined its invitation and Saudi Arabia clarified that the country is still considering its invitation and has not joined BRICS yet.
Even with these initial growing pains, South Africa’s Foreign Minister Naledi Pandor told reporters in February that 34 different countries have submitted applications to join the growing BRICS bloc.
Any changes to the group are likely to be announced leading up to or at the 2024 BRICS summit which takes place October 22-24 in Kazan, Russia.
Get the Full Analysis of the IMF’s Outlook on VC+
This visual is part of an exclusive special dispatch for VC+ members which breaks down the key takeaways from the IMF’s 2024 World Economic Outlook.
For the full set of charts and analysis, sign up for VC+.

-

 Markets1 week ago
U.S. Debt Interest Payments Reach $1 Trillion
-

 Markets2 weeks ago
Ranked: The Most Valuable Housing Markets in America
-

 Money2 weeks ago
Which States Have the Highest Minimum Wage in America?
-

 AI2 weeks ago
Ranked: Semiconductor Companies by Industry Revenue Share
-

 Markets2 weeks ago
Ranked: The World’s Top Flight Routes, by Revenue
-

 Countries2 weeks ago
Population Projections: The World’s 6 Largest Countries in 2075
-

 Markets2 weeks ago
The Top 10 States by Real GDP Growth in 2023
-

 Money2 weeks ago
The Smallest Gender Wage Gaps in OECD Countries