Technology
Apple’s Colossal Market Cap as it Hits $3 Trillion
Article/Editing:
Apple’s Colossal Market Cap in Context
In January of 2019, Apple’s market capitalization stood at $700 billion.
While this was perceived as a colossal figure at the time, when we fast forward to today, that valuation seems a lot more modest. Since then, Apple has surged to touch a $3 trillion valuation on January 3rd, 2022.
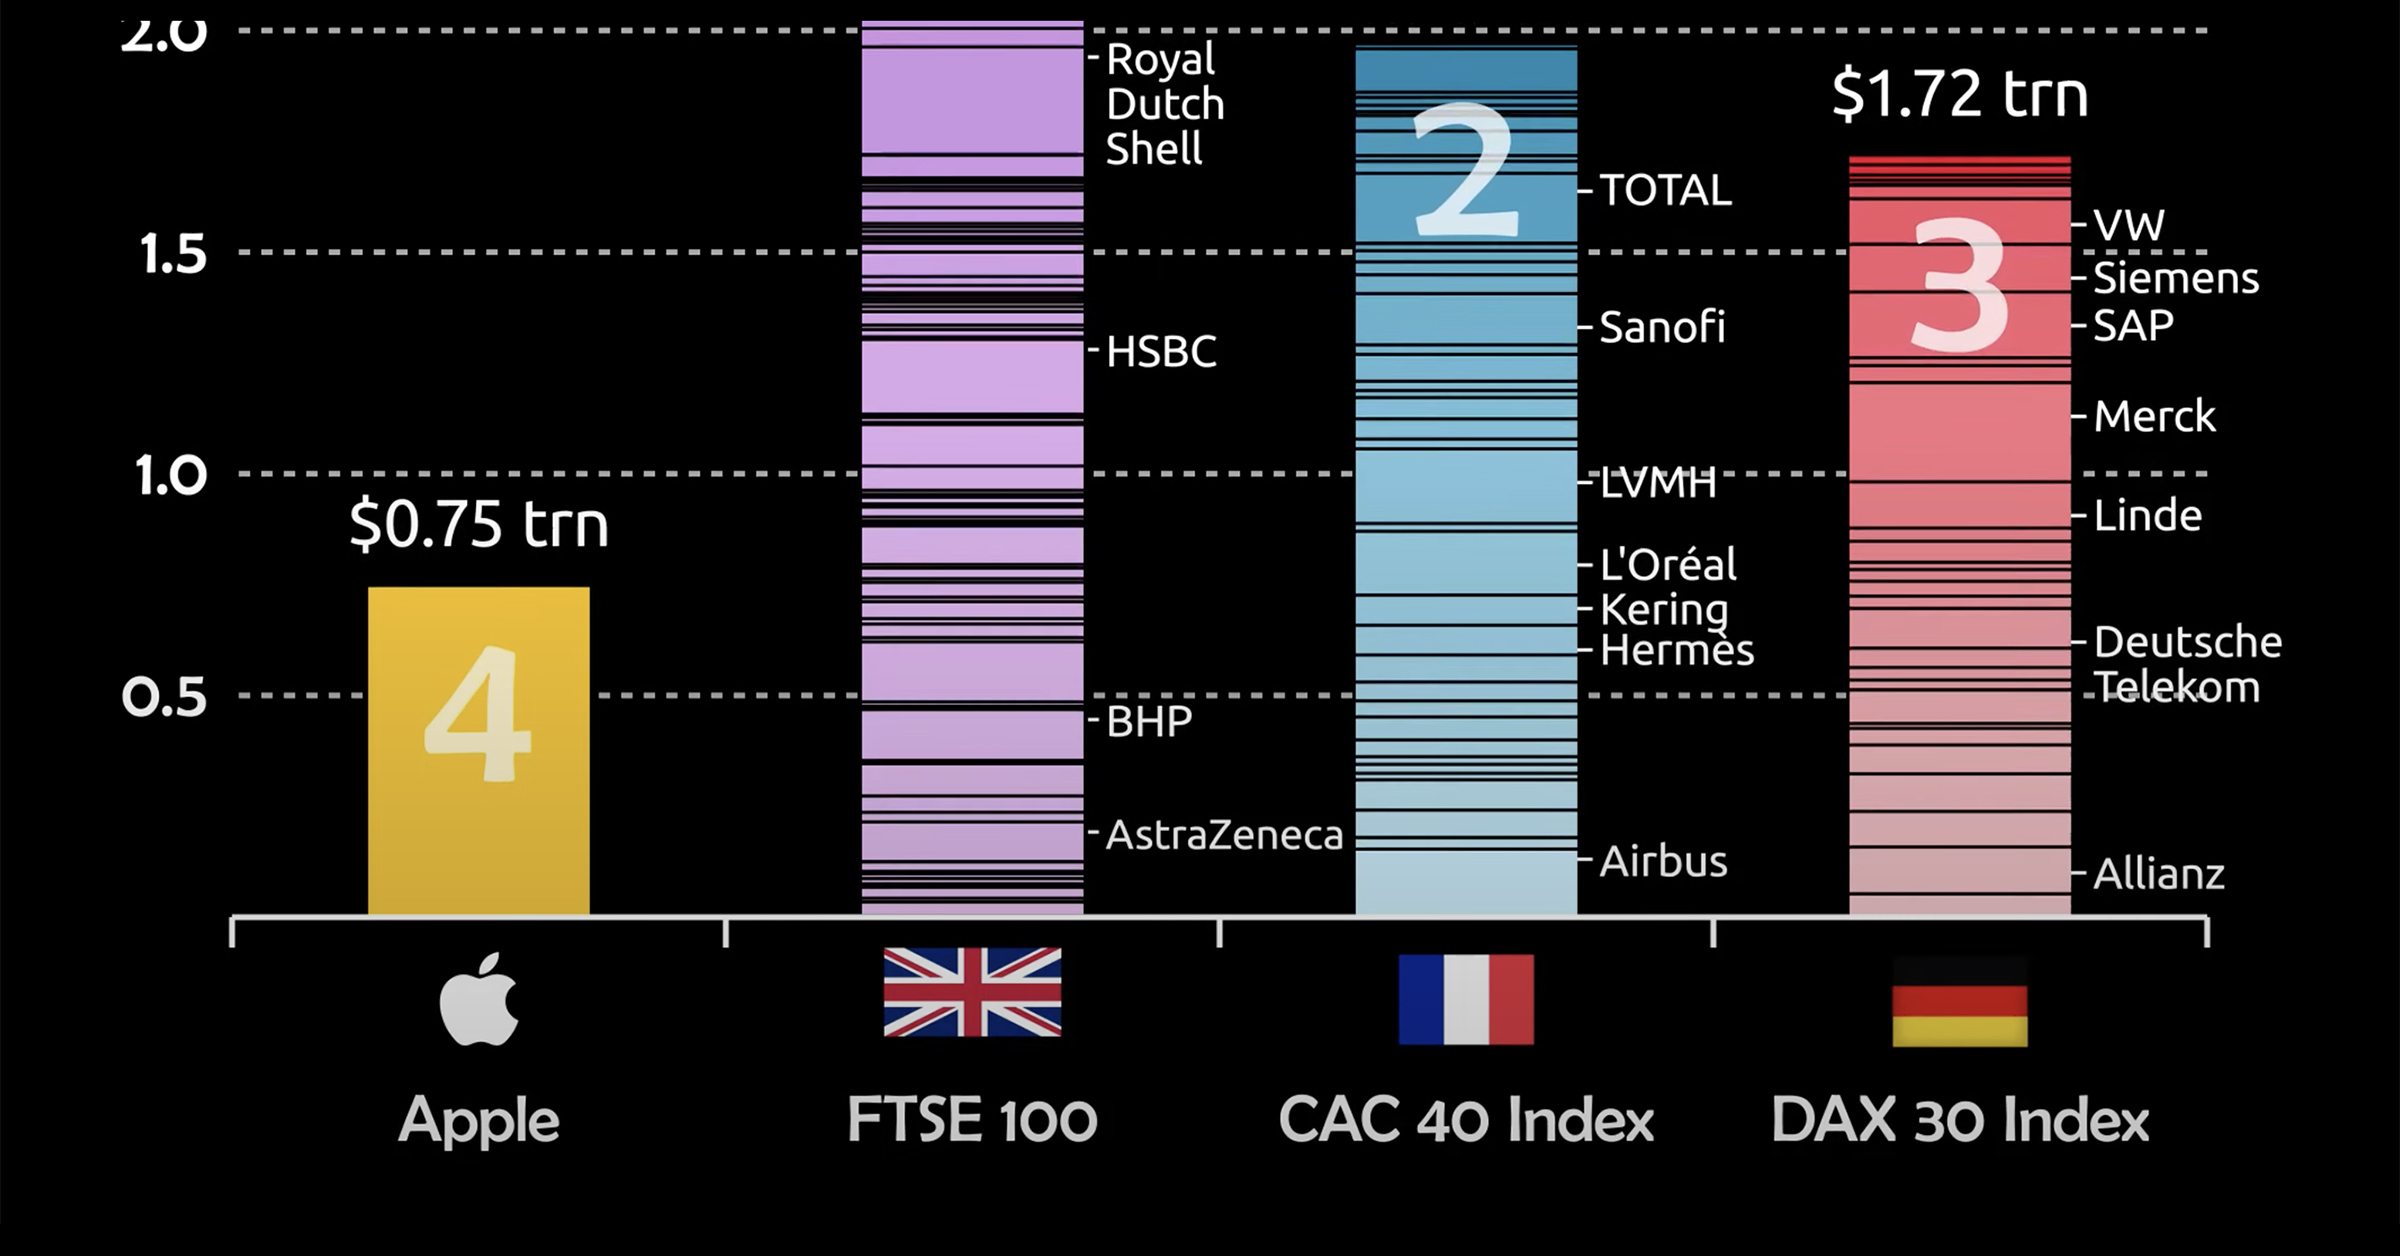
To gauge just how monstrous of a figure this is, consider that Apple is no longer comparable to just companies, but to countries and even entire stock indexes. This animation from James Eagle ranks the growth in Apple’s market cap alongside top indexes from the UK, France, and Germany.
Let’s take a closer look.
Apple Takes On Europe
The three indexes Apple is compared to are heavyweights in their own right.
The FTSE 100 consists of giants like HSBC and vaccine producer AstraZeneca, while the CAC 40 Index is home to LVMH, which made Bernard Arnault the richest man in the world for a period of time last year.
Nonetheless, Apple’s market cap exceeds that of the 100 companies in the FTSE, as well as the 40 in each of the CAC and DAX indexes.
| Stock/Index | Market Cap ($T) | Country of Origin |
|---|---|---|
| Apple | $3.00T | 🇺🇸 |
| FTSE 100 | $2.90T | 🇬🇧 |
| CAC 40 Index | $2.76T | 🇫🇷 |
| DAX 40 (Dax 30) Index* | $2.50T | 🇩🇪 |
*Germany’s flagship DAX Index expanded from 30 to 40 constituents in September 2021.
It’s important to note, that while Apple’s growth is stellar, European companies have simultaneously seen a decline in their share of the overall global stock market, which helps make these comparisons even more eye-catching.
For example, before 2005, publicly-traded European companies represented almost 30% of global stock market capitalization, but those figures have been cut in half to just 15% today.
Here are some other approaches to measure Apple’s dominance.
Apple’s Revenue Per Minute vs Other Tech Giants
Stepping away from market capitalization, another unique way to measure Apple’s success is in how much sales they generate on a per minute basis. In doing so, we see that they generate a massive $848,090 per minute.
Here’s how Apple revenue per minute compares to other Big Tech giants:
| Company | Revenue Per Minute |
|---|---|
| Amazon | $955,517 |
| Apple | $848,090 |
| Alphabet (Google) | $433,014 |
| Microsoft | $327,823 |
| $213,628 | |
| Tesla | $81,766 |
| Netflix | $50,566 |
Furthermore, Apple’s profits aren’t too shabby either: their $20.5 billion in net income last quarter equates to $156,000 in profits per minute.
How Apple Compares To Countries
Lastly, we can compare Apple’s market cap to the GDP of countries.
| Country (excluding Apple) | Total Value ($T) |
|---|---|
| Apple | $3.0T |
| Italy | $2.0T |
| Brazil | $1.8T |
| Canada | $1.7T |
| Russia | $1.7T |
| South Korea | $1.6T |
| Australia | $1.4T |
| Spain | $1.4T |
| Mexico | $1.3T |
| Indonesia | $1.1T |
What might be most impressive here is that Apple’s market cap eclipses the GDP of major developed economies, such as Canada and Australia. That means the company is more valuable than the entire economic production of these countries in a calendar year.
That’s some serious scale.

This article was published as a part of Visual Capitalist's Creator Program, which features data-driven visuals from some of our favorite Creators around the world.


Technology
Ranked: Semiconductor Companies by Industry Revenue Share
Nvidia is coming for Intel’s crown. Samsung is losing ground. AI is transforming the space. We break down revenue for semiconductor companies.


Semiconductor Companies by Industry Revenue Share
This was originally posted on our Voronoi app. Download the app for free on Apple or Android and discover incredible data-driven charts from a variety of trusted sources.
Did you know that some computer chips are now retailing for the price of a new BMW?
As computers invade nearly every sphere of life, so too have the chips that power them, raising the revenues of the businesses dedicated to designing them.
But how did various chipmakers measure against each other last year?
We rank the biggest semiconductor companies by their percentage share of the industry’s revenues in 2023, using data from Omdia research.
Which Chip Company Made the Most Money in 2023?
Market leader and industry-defining veteran Intel still holds the crown for the most revenue in the sector, crossing $50 billion in 2023, or 10% of the broader industry’s topline.
All is not well at Intel, however, with the company’s stock price down over 20% year-to-date after it revealed billion-dollar losses in its foundry business.
| Rank | Company | 2023 Revenue | % of Industry Revenue |
|---|---|---|---|
| 1 | Intel | $51B | 9.4% |
| 2 | NVIDIA | $49B | 9.0% |
| 3 | Samsung Electronics | $44B | 8.1% |
| 4 | Qualcomm | $31B | 5.7% |
| 5 | Broadcom | $28B | 5.2% |
| 6 | SK Hynix | $24B | 4.4% |
| 7 | AMD | $22B | 4.1% |
| 8 | Apple | $19B | 3.4% |
| 9 | Infineon Tech | $17B | 3.2% |
| 10 | STMicroelectronics | $17B | 3.2% |
| 11 | Texas Instruments | $17B | 3.1% |
| 12 | Micron Technology | $16B | 2.9% |
| 13 | MediaTek | $14B | 2.6% |
| 14 | NXP | $13B | 2.4% |
| 15 | Analog Devices | $12B | 2.2% |
| 16 | Renesas Electronics Corporation | $11B | 1.9% |
| 17 | Sony Semiconductor Solutions Corporation | $10B | 1.9% |
| 18 | Microchip Technology | $8B | 1.5% |
| 19 | Onsemi | $8B | 1.4% |
| 20 | KIOXIA Corporation | $7B | 1.3% |
| N/A | Others | $126B | 23.2% |
| N/A | Total | $545B | 100% |
Note: Figures are rounded. Totals and percentages may not sum to 100.
Meanwhile, Nvidia is very close to overtaking Intel, after declaring $49 billion of topline revenue for 2023. This is more than double its 2022 revenue ($21 billion), increasing its share of industry revenues to 9%.
Nvidia’s meteoric rise has gotten a huge thumbs-up from investors. It became a trillion dollar stock last year, and broke the single-day gain record for market capitalization this year.
Other chipmakers haven’t been as successful. Out of the top 20 semiconductor companies by revenue, 12 did not match their 2022 revenues, including big names like Intel, Samsung, and AMD.
The Many Different Types of Chipmakers
All of these companies may belong to the same industry, but they don’t focus on the same niche.
According to Investopedia, there are four major types of chips, depending on their functionality: microprocessors, memory chips, standard chips, and complex systems on a chip.
Nvidia’s core business was once GPUs for computers (graphics processing units), but in recent years this has drastically shifted towards microprocessors for analytics and AI.
These specialized chips seem to be where the majority of growth is occurring within the sector. For example, companies that are largely in the memory segment—Samsung, SK Hynix, and Micron Technology—saw peak revenues in the mid-2010s.

-

 Technology2 weeks ago
Ranked: The Most Popular Smartphone Brands in the U.S.
-

 Automotive1 week ago
Almost Every EV Stock is Down After Q1 2024
-

 Money1 week ago
Where Does One U.S. Tax Dollar Go?
-

 Green2 weeks ago
Ranked: Top Countries by Total Forest Loss Since 2001
-

 Real Estate2 weeks ago
Visualizing America’s Shortage of Affordable Homes
-

 Maps2 weeks ago
Mapped: Average Wages Across Europe
-

 Mining2 weeks ago
Charted: The Value Gap Between the Gold Price and Gold Miners
-

 Demographics2 weeks ago
Visualizing the Size of the Global Senior Population