Countries
Animated Map: Where Are the Largest Cities Throughout History?
Article/Editing:
Mapping the Largest Cities Throughout History
For much of human history, most people did not live in cities.
Cities—settlements that are densely populated and self-administered—require many specific prerequisites to come into existence. The most crucial, especially for much of human history, is an abundance of food.
Surplus food production leads to denser populations and allows for people to specialize in other skills that are not associated with basic human survival.
But that also means that cities usually consume more primary goods than they produce. And their size requires a host of many other services—such as transport and sanitation—that are traditionally expensive to maintain. So maintaining large urban centers, and especially the world’s largest cities, was a monumental task.
Mapper and history YouTuber Ollie Bye has visualized the seven largest cities in the world since 3,000 BCE. His video covers cities with a minimum population of 10,000 and hints at historical events which led to the establishment, growth, and eventual fall of cities.
The World’s Largest City Throughout History
With any historical data, accuracy is always a concern, and urban populations were rough and infrequent estimates up until the Industrial Revolution.
Bye has used a variety of data sources—including the UN and many research papers—to create the dataset used in the video.
In some places he also had to rely on his own estimates and criteria to keep the data reasonable and consistent:
- In early history, some cities didn’t have given population estimates for long periods of time, and had to be equalized or estimated through other sources. For example, Babylon had a population estimate at 1,600 BCE (60,000) and at 1,200 BCE (75,000) but none in the 400 years between.
- Cities that only briefly climbed above a population of 10,000, or that would have made the largest cities ranking for only a couple of years (and based on uncertain estimates), were not included.
Here’s a look at the largest city starting from the year 3,000 BCE, with populations listed in millions during the last year of each city’s “reign.” Cities are also listed with the flags of current-day countries in the same location.
| Time Period | Largest City | Population (Millions) | Country |
|---|---|---|---|
| 3000-2501 BCE | Uruk | 0.08 | Iraq 🇮🇶 |
| 2500-2251 BCE | Lagash | 0.06 | Iraq 🇮🇶 |
| 2250-2001 BCE | Girsu | 0.08 | Iraq 🇮🇶 |
| 2000-1751 BCE | Isin | 0.04 | Iraq 🇮🇶 |
| 1750-1251 BCE | Babylon | 0.06 | Iraq 🇮🇶 |
| 1250-1001 BCE | Pi-Ramesses | 0.16 | Egypt 🇪🇬 |
| 1000-601 BCE | Thebes | 0.12 | Egypt 🇪🇬 |
| 600-301 BCE | Babylon | 0.20 | Iraq 🇮🇶 |
| 300-201 BCE | Carthage | 0.40 | Tunisia 🇹🇳 |
| 200 BCE-270 CE | Alexandria | 0.60 | Egypt 🇪🇬 |
| 271-350 CE | Rome | 0.39 | Italy 🇮🇹 |
| 351-500 CE | Constantinople | 0.49 | Turkey 🇹🇷 |
| 501-640 CE | Ctesiphon | 0.50 | Iraq 🇮🇶 |
| 641-644 CE | Constantinople | 0.40 | Turkey 🇹🇷 |
| 645-795 CE | Chang'an | 0.59 | China 🇨🇳 |
| 796-963 CE | Baghdad | 1.10 | Iraq 🇮🇶 |
| 964-975 CE | Constantinople | 0.32 | Turkey 🇹🇷 |
| 976-984 CE | Córdoba | 0.33 | Spain 🇪🇸 |
| 985-1144 CE | Bian | 0.44 | China 🇨🇳 |
| 1145-1199 CE | Constantinople | 0.24 | Turkey 🇹🇷 |
| 1200-1275 CE | Lin'an | 0.36 | China 🇨🇳 |
| 1276-1278 CE | Cairo | 0.37 | Egypt 🇪🇬 |
| 1279-1315 CE | Hangzhou | 0.43 | China 🇨🇳 |
| 1316-1348 CE | Cairo | 0.50 | Egypt 🇪🇬 |
| 1349-1353 CE | Hangzhou | 0.43 | China 🇨🇳 |
| 1344-1380 CE | Cairo | 0.35 | Egypt 🇪🇬 |
| 1381-1394 CE | Vijayanagara | 0.36 | India 🇮🇳 |
| 1395-1426 CE | Yingtian | 0.50 | China 🇨🇳 |
| 1427-1441 CE | Vijayanagara | 0.44 | India 🇮🇳 |
| 1442-1612 CE | Beijing | 0.70 | China 🇨🇳 |
| 1613-1678 CE | Constatinople | 0.74 | Turkey 🇹🇷 |
| 1679-1720 CE | Dhaka | 0.78 | Bangladesh 🇧🇩 |
| 1721-1826 CE | Beijing | 1.30 | China 🇨🇳 |
| 1827-1918 CE | London | 7.40 | UK 🇬🇧 |
| 1919-1954 CE | New York | 13.20 | U.S. 🇺🇸 |
| 1955-Present | Tokyo | 37.30 | Japan 🇯🇵 |
Ancient Cities in the Fertile Crescent
Considered the “cradle of civilization,” the Fertile Crescent in the Middle East was home to all seven of the largest cities in the world in 3,000 BCE.
The Sumerian city of Uruk (modern-day Iraq), allegedly home to the legendary king Gilgamesh, topped the list with 40,000 people. It was followed by Memphis (Egypt) with 20,000 inhabitants.
For the next 1,700 years, other Mesopotamian cities in modern-day Iraq and Syria held pole positions, growing steadily and shuffling between themselves as the largest.
2,250 BCE marked the first time a different Asian city—Mohenjo-Daro (modern-day Pakistan) from the Indus Valley Civilization—found a spot at #4 with 40,000 people.
The table below is a quick snapshot of the seven largest cities in the world for from 3,000 BCE to 200 CE. Again, populations are listed in millions.
| Rank | 3000 BCE | 2250 BCE | 1250 BCE | 200 CE |
|---|---|---|---|---|
| 1 | Uruk (0.04) 🇮🇶 | Girsu (0.08) 🇮🇶 | Pi-Ramesses (0.16) 🇪🇬 | Alexandria (0.60) 🇪🇬 |
| 2 | Memphis (0.02) 🇪🇬 | Mari (0.05) 🇸🇾 | Yin (0.12) 🇨🇳 | Pataliputra (0.35) 🇮🇳 |
| 3 | Umma (0.02) 🇮🇶 | Umma (0.04) 🇮🇶 | Thebes (0.08) 🇪🇬 | Carthage (0.20) 🇹🇳 |
| 4 | Nagar (0.02) 🇸🇾 | Mohenjo-daro (0.04) 🇵🇰 | Sapinuwa (0.07) 🇹🇷 | Luoyang (0.20) 🇨🇳 |
| 5 | Lagash (0.02) 🇮🇶 | Akkad (0.03) 🇮🇶 | Babylon (0.07) 🇮🇶 | Seleucia (0.20) 🇮🇶 |
| 6 | Larak (0.01) 🇮🇶 | Uruk (0.03) 🇮🇶 | Hattusa (0.06) 🇹🇷 | Pergamon (0.20) 🇹🇷 |
| 7 | Eridu (0.01) 🇮🇶 | Memphis (0.03) 🇪🇬 | Uruk (0.03) 🇮🇶 | Taxila (0.10) 🇵🇰 |
It wasn’t until 1,250 BCE that the top two spots were taken by cities in different regions: Pi-Ramesses (Egypt) and Yin (China), both with more than 100,000 residents.
Egyptian cities would continue to be the most populous for the next millennium—briefly interrupted by Carthage and Babylon—until the start of the Common Era. By 30 CE, Alexandria was the largest city in the world, but the top 10 had representatives from the Middle East, Northern Africa, and Asia.
All Roads Lead to Rome
One city in Europe meanwhile, was also beginning to see steady growth—Rome.
It took until halfway through the 3rd century C.E. for Rome to become the most populous city, followed closely still by Alexandria (Egypt). Meanwhile in Iraq, Ctesiphon, the capital of the Sasanian empire was growing rapidly.
| Rank | 271 CE | 351 CE | 501 CE | 645 CE |
|---|---|---|---|---|
| 1 | Rome (0.39) 🇮🇹 | Constantinople (0.29) 🇹🇷 | Ctesiphon (0.41) 🇮🇶 | Chang'an (0.38) 🇨🇳 |
| 2 | Alexandria (0.37) 🇪🇬 | Ctesiphon (0.25) 🇮🇶 | Constantinople (0.40) 🇹🇷 | Constantinople (0.32) 🇹🇷 |
| 3 | Luoyang (0.20) 🇨🇳 | Rome (0.24) 🇮🇹 | Luoyang (0.20) 🇨🇳 | Kanyakubja (0.24) 🇮🇳 |
| 4 | Vaishali (0.17) 🇮🇳 | Pataliputra (0.22) 🇮🇳 | Teotihuacan (0.15) 🇲🇽 | Luoyang (0.21) 🇨🇳 |
| 5 | Carthage (0.16) 🇹🇳 | Luoyang (0.20) 🇨🇳 | Jiankang (0.15) 🇨🇳 | El Pilar (0.17) 🇧🇿 |
| 6 | Teotihuacan (0.14) 🇲🇽 | Vaishali (0.16) 🇮🇳 | Caracol (0.14) 🇧🇿 | Ctesiphon (0.41) 🇮🇶 |
| 7 | Antioch (0.12) 🇹🇷 | Teotihuacan (0.15) 🇲🇽 | Chang'an (0.10) 🇨🇳 | Teotihuacan (0.15) 🇲🇽 |
Towards the end of the 3rd century, the Roman empire was divided into two, with Constantinople becoming the new capital for the Eastern half. Consequently, it had outgrown Rome by 353 and become the world’s most populous city, and for the next few centuries would reclaim this title time and time again.
The Largest Cities Reach 1 Million
In the 9th century, Baghdad became the first city to have 1 million residents (though historians also estimate Rome and the Chinese city of Chang’an may have achieved that figure earlier).
It would be nearly nine centuries until a city had one million inhabitants again, and Baghdad’s reign didn’t last long. By the 10th century, Bian, the capital of the Northern Song dynasty in China, had become the largest city in the world, with Baghdad suffering from relocations and shifting political power to other cities in the region.
| Rank | 850 CE | 985 CE | 1316 CE | 1381 CE |
|---|---|---|---|---|
| 1 | Baghdad (1.00) 🇮🇶 | Bian (0.35) 🇨🇳 | Cairo (0.44) 🇪🇬 | Vijayanagara (0.36) 🇮🇳 |
| 2 | Chang'an (0.60) 🇨🇳 | Córdoba (0.33) 🇪🇸 | Hangzhou (0.43) 🇨🇳 | Cairo (0.35) 🇪🇬 |
| 3 | Constantinople (0.27) 🇹🇷 | Constantinople (0.32) 🇹🇷 | Dadu (0.40) 🇨🇳 | Paris (0.29) 🇫🇷 |
| 4 | Kanyakubja (0.21) 🇮🇳 | Angkor (0.18) 🇰🇭 | Paris (0.25) 🇫🇷 | Yingtian (0.27) 🇨🇳 |
| 5 | Luoyang (0.20) 🇨🇳 | Baghdad (0.17) 🇮🇶 | Kamakura (0.20) 🇯🇵 | Hangzhou (0.23) 🇨🇳 |
| 6 | Bian (0.17) 🇨🇳 | Kyoto (0.15) 🇯🇵 | Guangzhou (0.15) 🇨🇳 | Beiping (0.15) 🇨🇳 |
| 7 | Córdoba (0.16) 🇪🇸 | Cairo (0.12) 🇪🇬 | Fez (0.14) 🇲🇦 | Tabriz (0.14) 🇮🇷 |
From the 12th century onwards, Mongol invasions in the Middle East and Central Asia severely limited population growth in the region. European cities too were ravaged in the 14th century, but by plagues instead of marauders.
For the next few hundred years, Cairo (Egypt), Hangzhou (China), and Vijayanagara (India) would top the list until Beijing took (and mostly held onto) the top spot through the 19th century.
Industrial Revolution and Rapid Urbanization
The start of the Industrial Revolution in the UK—spreading to the rest of Europe and later on the U.S.—led to hitherto unseen levels of urban population growth.
Factories needed labor, which caused mass emigration from the rural countryside to urban centers of growth.
In 1827, London passed Beijing to become the largest city in the world with 1.3 million residents. Over the next 100 years, its population increased nearly 7 times, remaining the most populous city until the end of World War I, by which time it was overtaken by New York.
| Rank | 1442 | 1851 | 1919 | 1955 |
|---|---|---|---|---|
| 1 | Beijing (0.51) 🇨🇳 | London (2.2) 🇬🇧 | New York (7.6) 🇺🇸 | Tokyo (13.7) 🇯🇵 |
| 2 | Vijayanagara (0.44) 🇮🇳 | Beijing (1.6) 🇨🇳 | London (7.4) 🇬🇧 | New York (13.2) 🇺🇸 |
| 3 | Cairo (0.37) 🇪🇬 | Paris (1.3) 🇫🇷 | Paris (4.7) 🇫🇷 | Osaka (8.6) 🇯🇵 |
| 4 | Hangzhou (0.24) 🇨🇳 | Guangzhou (0.87) 🇨🇳 | Tokyo (4.3) 🇯🇵 | London (8.2) 🇬🇧 |
| 5 | Tabriz (0.21) 🇮🇷 | Constantinople (0.71) 🇹🇷 | Berlin (3.7) 🇩🇪 | Paris (6.7) 🇫🇷 |
| 6 | Nanjing (0.18) 🇨🇳 | Edo (0.78) 🇯🇵 | Chicago (2.9) 🇺🇸 | Buenos Aires (5.9) 🇦🇷 |
| 7 | Granada (0.15) 🇪🇸 | New York (0.56) 🇺🇸 | Vienna (1.9) 🇦🇹 | Moscow (5.7) 🇷🇺 |
From 1920 to 2022, the world population quadrupled thanks to improvements in farming and healthcare, and cities saw rapid growth as well. The beginning of the 20st century saw the top 10 largest cities in the world in the U.S., Europe, and Japan.
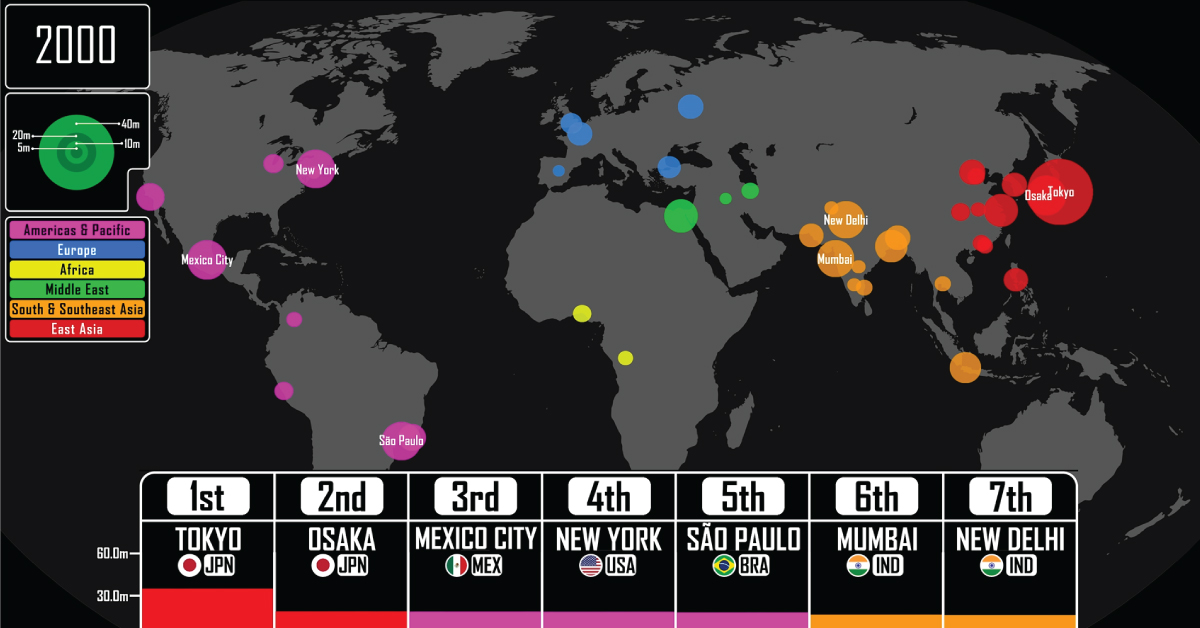
By the 21st century however, growth shifted away to other parts of the world and by 2021, the top seven had cities only from Asia and the Americas.
| Rank | 1970 | 1990 | 2000 | 2021 |
|---|---|---|---|---|
| 1 | Tokyo (23.2) 🇯🇵 | Tokyo (32.7) 🇯🇵 | Tokyo (34.3) 🇯🇵 | Tokyo (37.3) 🇯🇵 |
| 2 | New York (16.1) 🇺🇸 | Osaka (18.5) 🇯🇵 | Osaka (18.6) 🇯🇵 | New Delhi (31.1) 🇮🇳 |
| 3 | Osaka (15.2) 🇯🇵 | New York (16.2) 🇺🇸 | Mexico City (18.4) 🇲🇽 | Shanghai (27.7) 🇨🇳 |
| 4 | Mexico City (8.8) 🇲🇽 | Mexico City (15.9) 🇲🇽 | New York (17.8) 🇺🇸 | Sao Paulo (22.2) 🇧🇷 |
| 5 | Buenos Aires (8.4) 🇦🇷 | Sao Paulo (15.0) 🇧🇷 | Sao Paulo (17.0) 🇧🇷 | Mexico City (21.9) 🇲🇽 |
| 6 | Los Angeles (8.3) 🇺🇸 | Bombay (12.7) 🇮🇳 | Mumbai (16.1) 🇮🇳 | Dhaka (21.7) 🇧🇩 |
| 7 | Paris (8.2) 🇫🇷 | Buenos Aires (11.2) 🇦🇷 | New Delhi (15.6) 🇮🇳 | Beijing (20.8) 🇨🇳 |
Tokyo, which took the top spot in 1954, is the largest city in the world today with a population of 37 million (including the entire metropolitan area).
It is followed by New Delhi with 31 million, but by 2028, the UN estimates that positions will switch on the leaderboard and New Delhi will overtake Tokyo.
What Does Population Growth Say About the Past (and Future)?
The rise and fall of cities through the sands of time can give us insight into the trajectory of civilization growth. As civilizations grow, become richer, and reach their zenith, so too do their cities blossom in tandem.
For example, of the modern-day seven largest cities in the world, four of them belong to countries with the 10 largest economies in the world.
Meanwhile, sudden falls in urban population point to turbulence—political instability, wars, natural disasters, or disease.
Most recently Ukraine’s cities are seeing depopulation as residents flee conflict zones, raising the specter of a demographic crisis for the country should the war continue.
Thus, tracking the size of urban population can help policymakers forecast future roadblocks to growth, especially when prioritizing sustainable growth for a country.

This article was published as a part of Visual Capitalist's Creator Program, which features data-driven visuals from some of our favorite Creators around the world.


Demographics
Countries With the Largest Happiness Gains Since 2010
Tracking Gallup survey data for more than a decade reveals insights into the regions seeing happiness gains.
Countries With the Largest Happiness Gains Since 2010
This was originally posted on our Voronoi app. Download the app for free on iOS or Android and discover incredible data-driven charts from a variety of trusted sources.
In 2011, Bhutan sponsored a UN resolution that invited governments to prioritize happiness and well-being as a way to measure social and economic development.
And thus, the World Happiness Report was born.
In 2012, the first report released, examining Gallup poll data from 2006–2010 that asked respondents in nearly every country to evaluate their life on a 0–10 scale. From this they extrapolated a single “happiness score” out of 10 to compare how happy countries are.
More than a decade later, the 2024 World Happiness Report continues the mission to quantify, measure, and compare well-being. Its latest findings also include how countries have become happier in the intervening years.
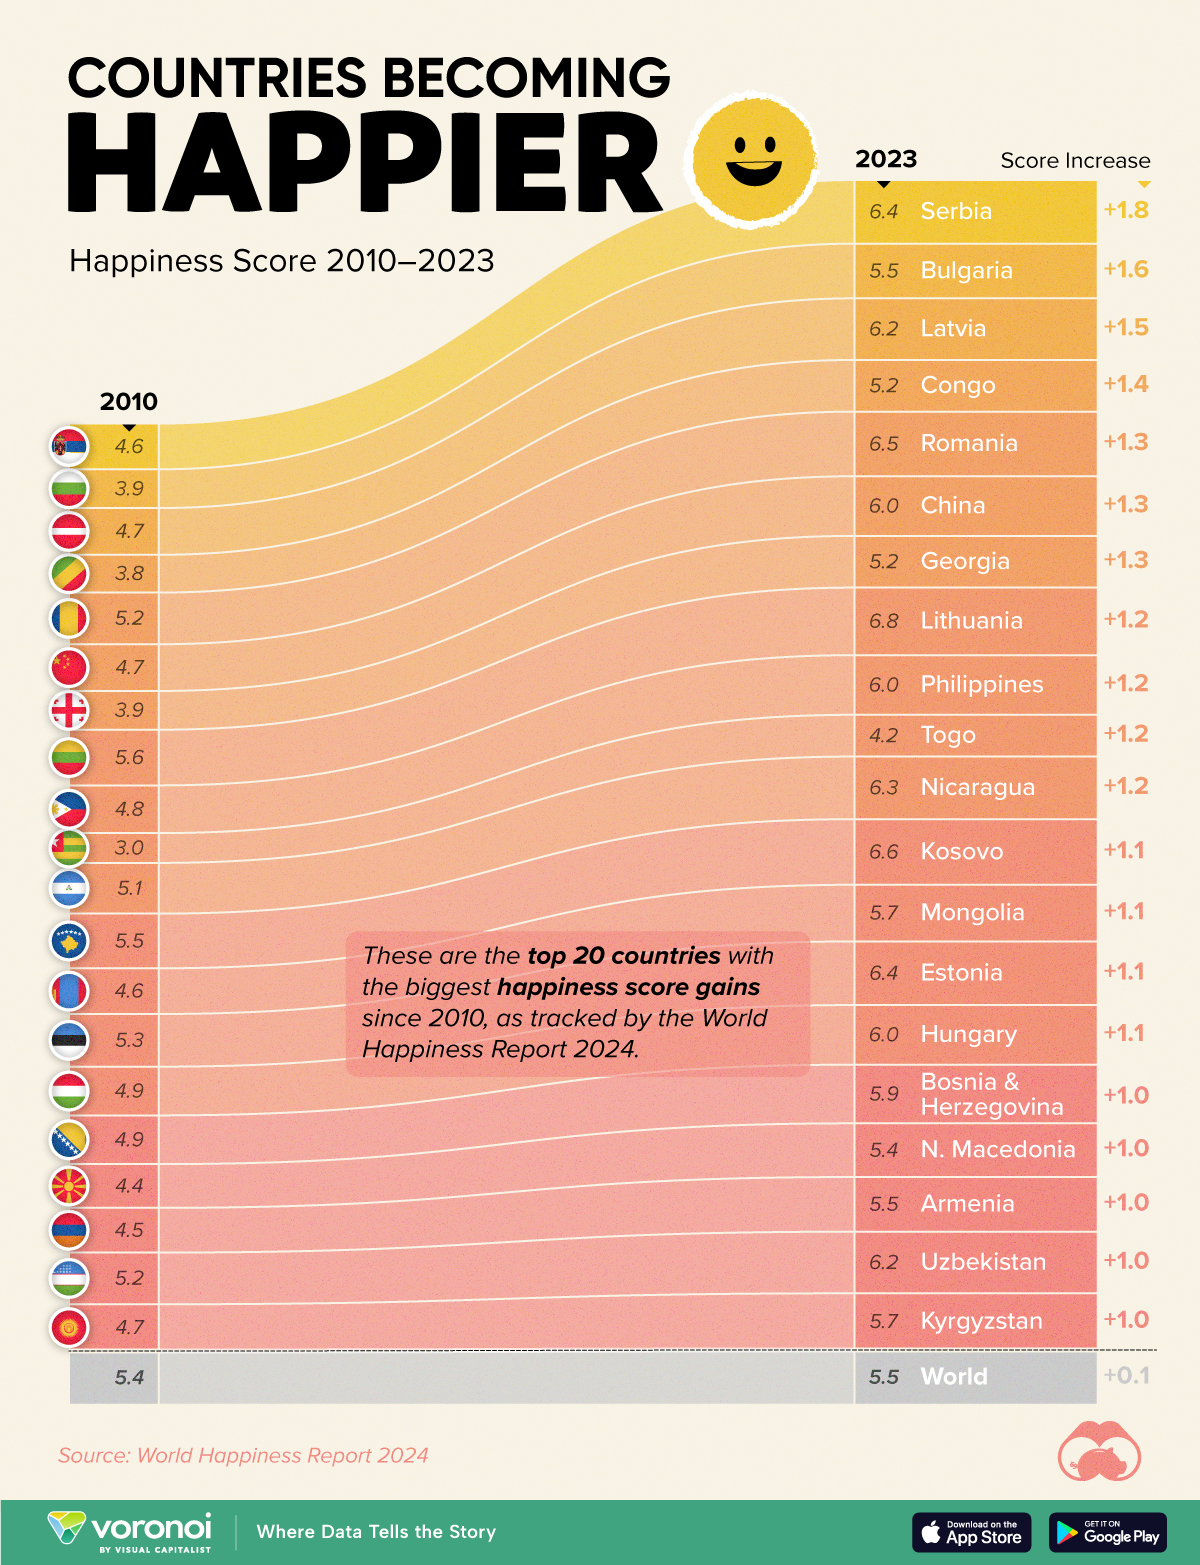
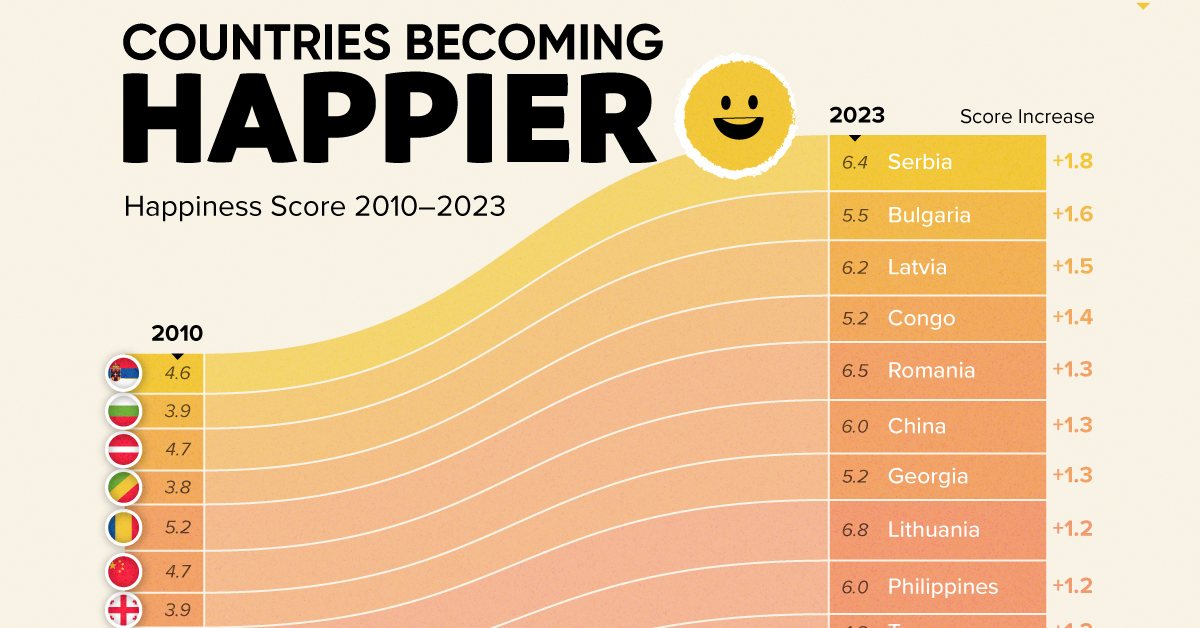
We visualize these findings in the above chart, which shows the 20 countries that have seen their happiness scores grow the most since 2010.
Which Countries Have Become Happier Since 2010?
Serbia leads a list of 12 Eastern European nations whose average happiness score has improved more than 20% in the last decade.
In the same time period, the Serbian economy has doubled to $80 billion, and its per capita GDP has nearly doubled to $9,538 in current dollar terms.
| Rank | Country | Happiness Score Gains (2010–2024) | 2024 Happiness Score (out of 10) |
|---|---|---|---|
| 1 | 🇷🇸 Serbia | +1.8 | 6.4 |
| 2 | 🇧🇬 Bulgaria | +1.6 | 5.5 |
| 3 | 🇱🇻 Latvia | +1.5 | 6.2 |
| 4 | 🇨🇬 Congo | +1.4 | 5.2 |
| 5 | 🇷🇴 Romania | +1.3 | 6.5 |
| 6 | 🇨🇳 China | +1.3 | 6.0 |
| 7 | 🇬🇪 Georgia | +1.3 | 5.2 |
| 8 | 🇱🇹 Lithuania | +1.2 | 6.8 |
| 9 | 🇵🇭 Philippines | +1.2 | 6.0 |
| 10 | 🇹🇬 Togo | +1.2 | 4.2 |
| 11 | 🇳🇮 Nicaragua | +1.2 | 6.3 |
| 12 | 🇽🇰 Kosovo | +1.1 | 6.6 |
| 13 | 🇲🇳 Mongolia | +1.1 | 5.7 |
| 14 | 🇪🇪 Estonia | +1.1 | 6.4 |
| 15 | 🇭🇺 Hungary | +1.1 | 6.0 |
| 16 | 🇧🇦 Bosnia & Herzegovina | +1.0 | 5.9 |
| 17 | 🇲🇰 North Macedonia | +1.0 | 5.4 |
| 18 | 🇦🇲 Armenia | +1.0 | 5.5 |
| 19 | 🇺🇿 Uzbekistan | +1.0 | 6.2 |
| 20 | 🇰🇬 Kyrgyzstan | +1.0 | 5.7 |
| N/A | 🌍 World | +0.1 | 5.5 |
Since the first report, Western Europe has on average been happier than Eastern Europe. But as seen with these happiness gains, Eastern Europe is now seeing their happiness levels converge closer to their Western counterparts. In fact, when looking at those under the age of 30, the most recent happiness scores are nearly the same across the continent.
All in all, 20 countries have increased their happiness score by a full point or more since 2010, on the 0–10 scale.

-

 Travel1 week ago
Airline Incidents: How Do Boeing and Airbus Compare?
-

 Markets2 weeks ago
Visualizing America’s Shortage of Affordable Homes
-

 Green2 weeks ago
Ranked: Top Countries by Total Forest Loss Since 2001
-

 Money2 weeks ago
Where Does One U.S. Tax Dollar Go?
-

 Misc2 weeks ago
Almost Every EV Stock is Down After Q1 2024
-

 AI2 weeks ago
The Stock Performance of U.S. Chipmakers So Far in 2024
-

 Markets2 weeks ago
Charted: Big Four Market Share by S&P 500 Audits
-

 Real Estate2 weeks ago
Ranked: The Most Valuable Housing Markets in America