Technology
A Visual Breakdown of Global Music Consumption
Article/Editing:
A Visual Breakdown of Global Music Consumption
To maximize any chance of success in the music business, aspiring artists must gain an understanding of how music is consumed and how that is changing alongside technology.
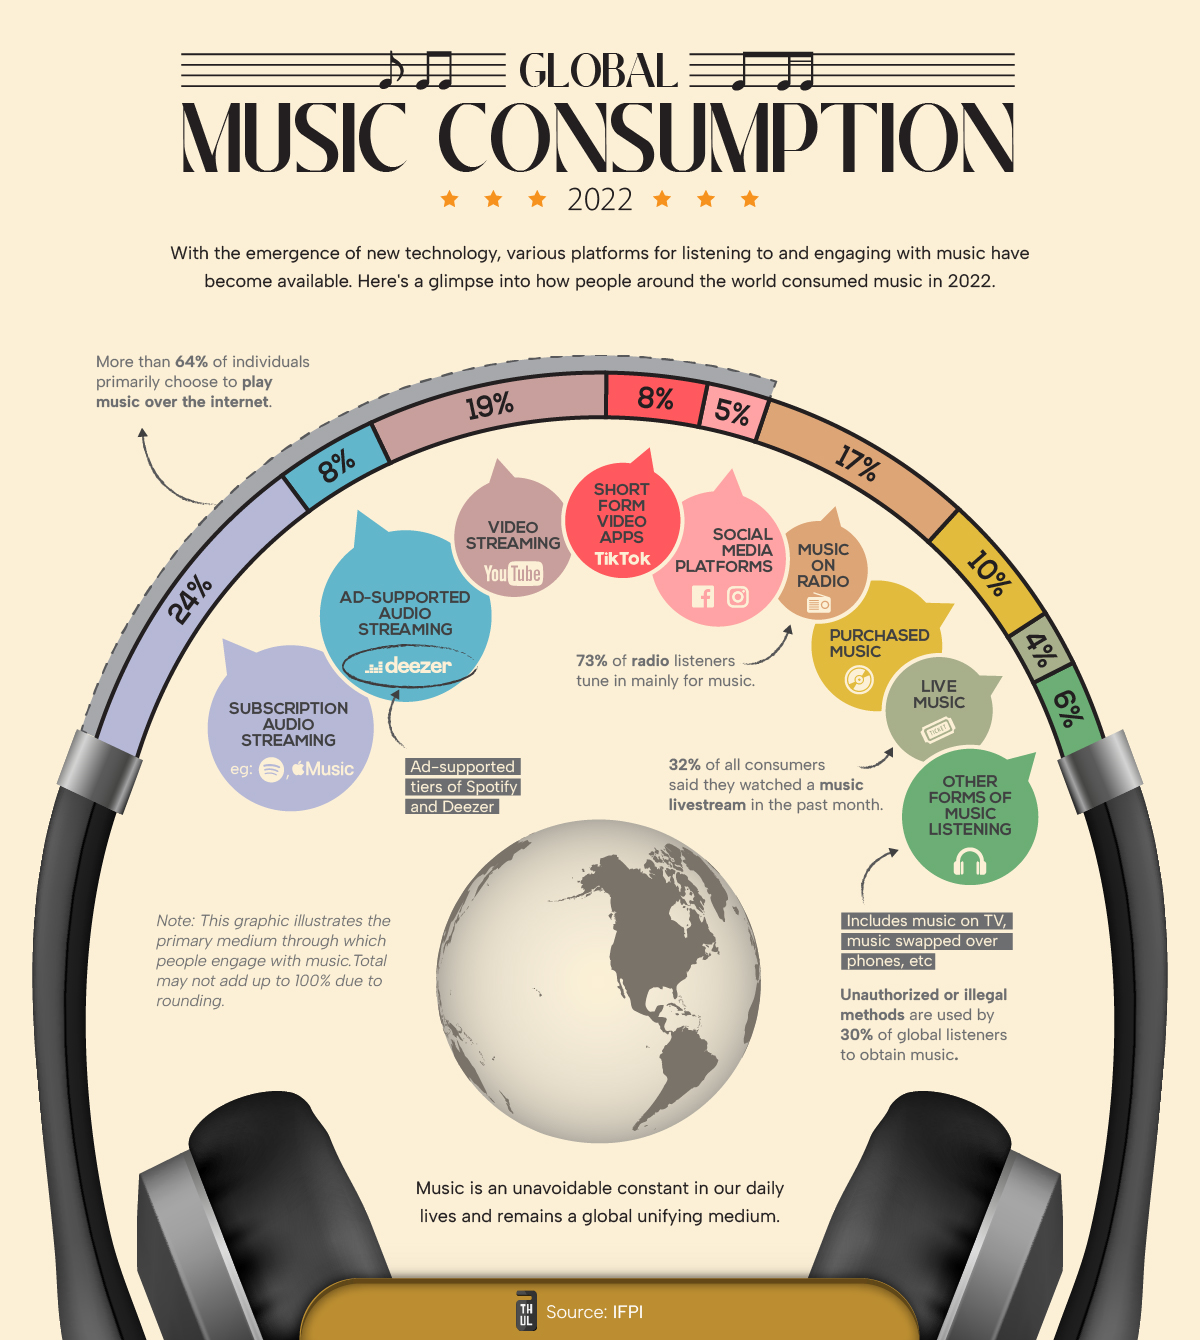
This graphic from Athul Alexander highlights global music consumption habits. Data is from 2022 and is sourced from a survey of over 44,000 people from 22 countries by IFPI that asked people their primary mode for consuming music.
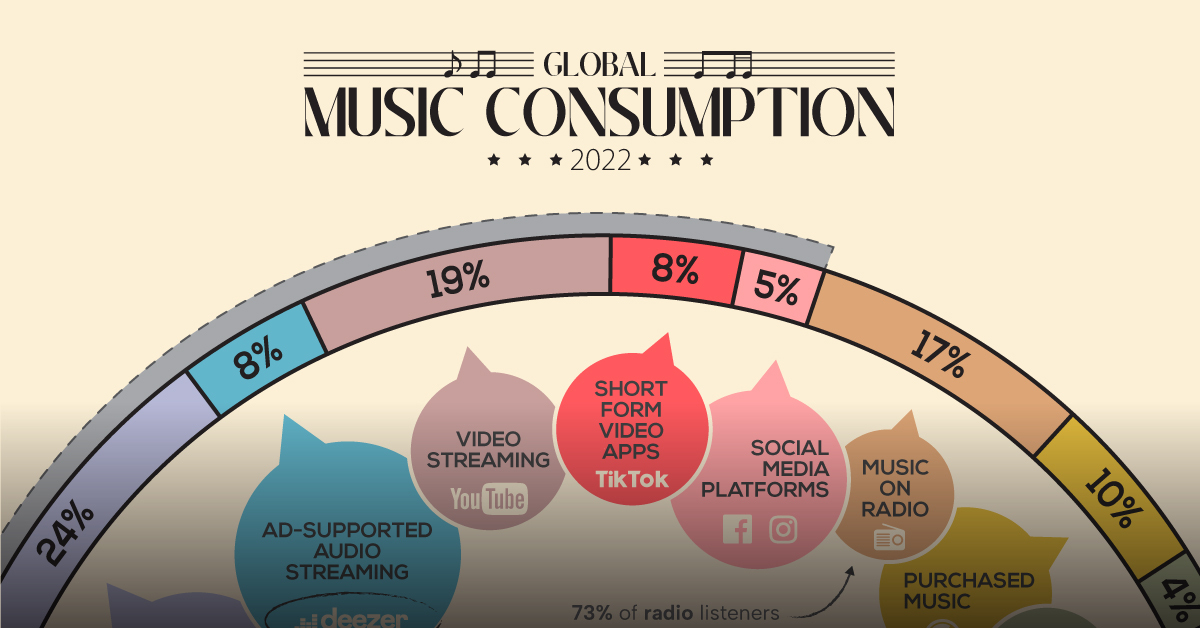
As of 2022, paid subscription services (i.e. Apple Music, Spotify) are the most preferred option for listeners, accounting for nearly one-fourth of main platform share.
| Rank | Service | Share | Examples |
|---|---|---|---|
| 1 | Paid Audio Streaming | 24% | Spotify, Apple Music |
| 2 | Video Streaming | 19% | YouTube |
| 3 | Radio | 17% | |
| 4 | Purchased Music | 10% | Vinyls, CDs, purchased digital albums |
| 5 | Ad-Supported Audio Streaming | 8% | Amazon, Deezer |
| 6 | Short-form Videos | 8% | TikTok |
| 7 | Social Media Videos | 5% | Facebook, Instagram |
| 8 | Live Music | 4% | concerts, livestreams |
| 9 | Other | 6% | music on TV, phone-to-phone transfers |
Short-form video platforms like TikTok, with an 8% share of primary music listeners, are a fast-growing medium. Several young artists have found initial success and traction using these platforms over the past few years.
And though video “killed the radio star,” it hasn’t killed listening to music on the radio. A healthy, 17% of respondents picked radio as their primary avenue for listening to music.
Streaming Supremacy and Virality
There’s no doubt that the internet has revolutionized how music is being consumed.
Including all video and music streaming, internet-based music consumption was the primary choice for 64% of respondents. That’s not even accounting for livestreams or music purchased through the internet.
| Platform | Share |
|---|---|
| Internet-based | 64% |
| Non-Internet Based | 37% |
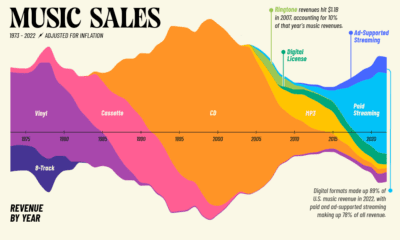
This internet-heavy metric is being reflected on the business side as well, with 75% of the music industry’s revenues in the U.S. coming from streaming.
However, for artists, streaming revenue is usually the third-biggest earner after live performances and sales.
But utilizing streaming to its fullest potential keeps modern artists in the loop. For example, Beyoncé was one of the first artists to utilize streaming platforms to release an album completely unannounced in 2013, a marketing move that has been replicated many times since.
Source: IFPI
Data note: IFPI surveyed over 44,000 people from 22 countries, asking them about their primary mode of consuming music. They exclude India and China from their global figures to prevent the size of the population from influencing the global weighted average. Percentages may also not add up to 100 because of rounded figures.

This article was published as a part of Visual Capitalist's Creator Program, which features data-driven visuals from some of our favorite Creators around the world.


Technology
Visualizing AI Patents by Country
See which countries have been granted the most AI patents each year, from 2012 to 2022.


Visualizing AI Patents by Country
This was originally posted on our Voronoi app. Download the app for free on iOS or Android and discover incredible data-driven charts from a variety of trusted sources.
This infographic shows the number of AI-related patents granted each year from 2010 to 2022 (latest data available). These figures come from the Center for Security and Emerging Technology (CSET), accessed via Stanford University’s 2024 AI Index Report.
From this data, we can see that China first overtook the U.S. in 2013. Since then, the country has seen enormous growth in the number of AI patents granted each year.
| Year | China | EU and UK | U.S. | RoW | Global Total |
|---|---|---|---|---|---|
| 2010 | 307 | 137 | 984 | 571 | 1,999 |
| 2011 | 516 | 129 | 980 | 581 | 2,206 |
| 2012 | 926 | 112 | 950 | 660 | 2,648 |
| 2013 | 1,035 | 91 | 970 | 627 | 2,723 |
| 2014 | 1,278 | 97 | 1,078 | 667 | 3,120 |
| 2015 | 1,721 | 110 | 1,135 | 539 | 3,505 |
| 2016 | 1,621 | 128 | 1,298 | 714 | 3,761 |
| 2017 | 2,428 | 144 | 1,489 | 1,075 | 5,136 |
| 2018 | 4,741 | 155 | 1,674 | 1,574 | 8,144 |
| 2019 | 9,530 | 322 | 3,211 | 2,720 | 15,783 |
| 2020 | 13,071 | 406 | 5,441 | 4,455 | 23,373 |
| 2021 | 21,907 | 623 | 8,219 | 7,519 | 38,268 |
| 2022 | 35,315 | 1,173 | 12,077 | 13,699 | 62,264 |
In 2022, China was granted more patents than every other country combined.
While this suggests that the country is very active in researching the field of artificial intelligence, it doesn’t necessarily mean that China is the farthest in terms of capability.
Key Facts About AI Patents
According to CSET, AI patents relate to mathematical relationships and algorithms, which are considered abstract ideas under patent law. They can also have different meaning, depending on where they are filed.
In the U.S., AI patenting is concentrated amongst large companies including IBM, Microsoft, and Google. On the other hand, AI patenting in China is more distributed across government organizations, universities, and tech firms (e.g. Tencent).
In terms of focus area, China’s patents are typically related to computer vision, a field of AI that enables computers and systems to interpret visual data and inputs. Meanwhile America’s efforts are more evenly distributed across research fields.
Learn More About AI From Visual Capitalist
If you want to see more data visualizations on artificial intelligence, check out this graphic that shows which job departments will be impacted by AI the most.

-

 Mining1 week ago
Gold vs. S&P 500: Which Has Grown More Over Five Years?
-

 Markets2 weeks ago
Ranked: The Most Valuable Housing Markets in America
-

 Money2 weeks ago
Which States Have the Highest Minimum Wage in America?
-

 AI2 weeks ago
Ranked: Semiconductor Companies by Industry Revenue Share
-

 Markets2 weeks ago
Ranked: The World’s Top Flight Routes, by Revenue
-

 Countries2 weeks ago
Population Projections: The World’s 6 Largest Countries in 2075
-

 Markets2 weeks ago
The Top 10 States by Real GDP Growth in 2023
-

 Demographics2 weeks ago
The Smallest Gender Wage Gaps in OECD Countries