Technology
A Visual Breakdown of Global Music Consumption
Article/Editing:
A Visual Breakdown of Global Music Consumption
To maximize any chance of success in the music business, aspiring artists must gain an understanding of how music is consumed and how that is changing alongside technology.
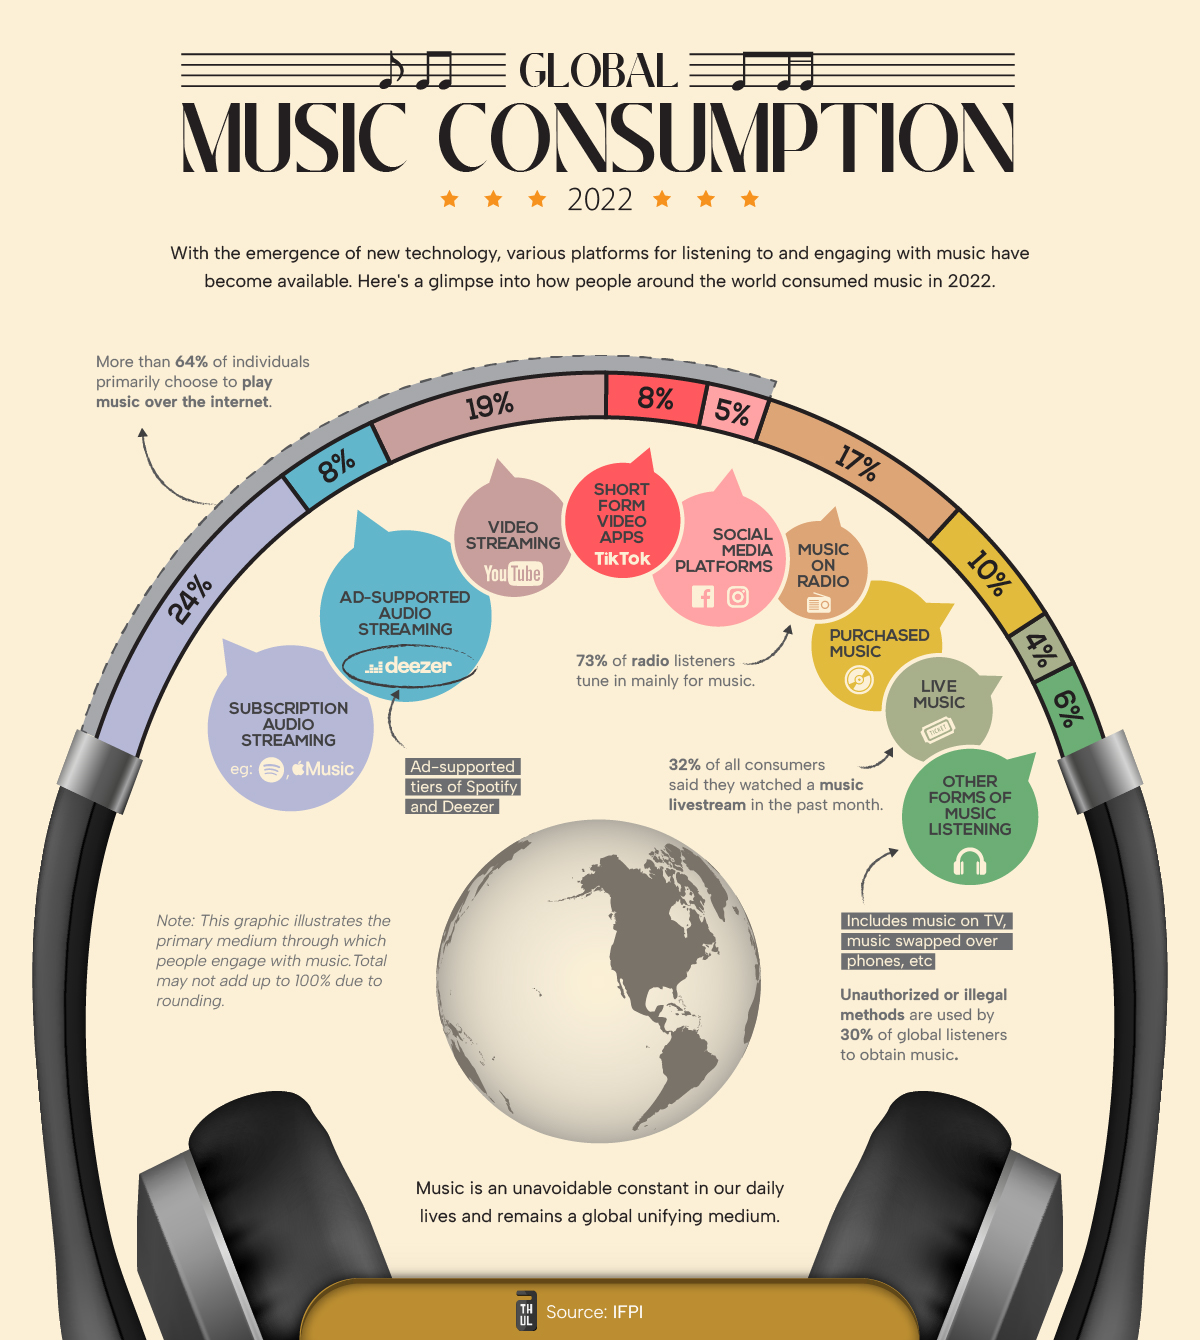
This graphic from Athul Alexander highlights global music consumption habits. Data is from 2022 and is sourced from a survey of over 44,000 people from 22 countries by IFPI that asked people their primary mode for consuming music.
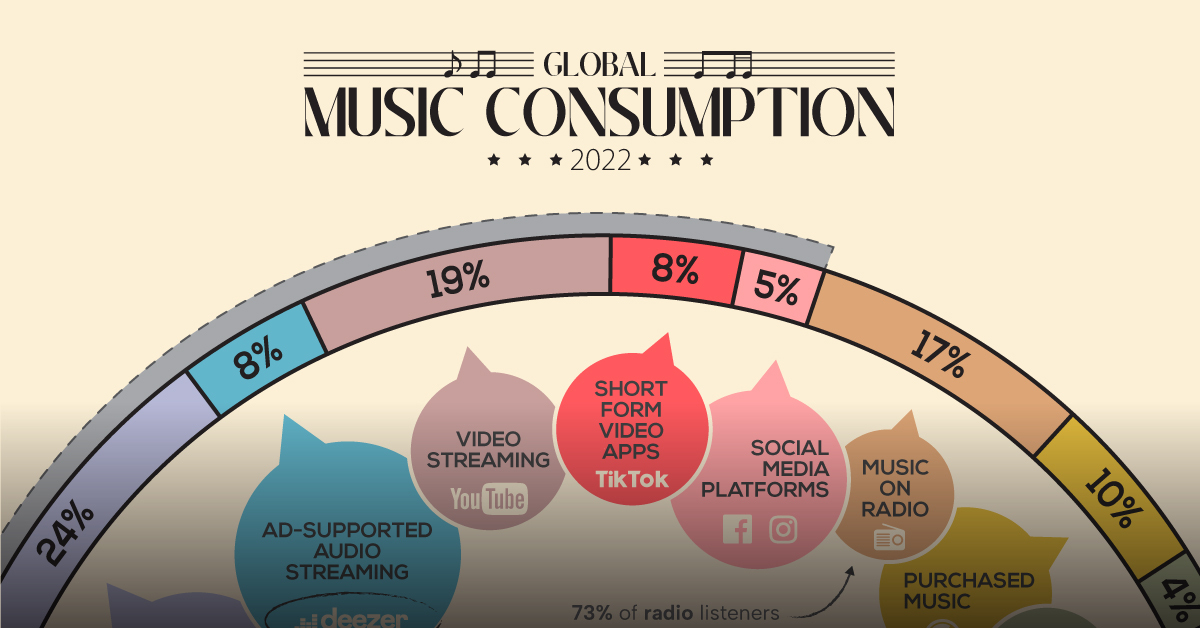
As of 2022, paid subscription services (i.e. Apple Music, Spotify) are the most preferred option for listeners, accounting for nearly one-fourth of main platform share.
| Rank | Service | Share | Examples |
|---|---|---|---|
| 1 | Paid Audio Streaming | 24% | Spotify, Apple Music |
| 2 | Video Streaming | 19% | YouTube |
| 3 | Radio | 17% | |
| 4 | Purchased Music | 10% | Vinyls, CDs, purchased digital albums |
| 5 | Ad-Supported Audio Streaming | 8% | Amazon, Deezer |
| 6 | Short-form Videos | 8% | TikTok |
| 7 | Social Media Videos | 5% | Facebook, Instagram |
| 8 | Live Music | 4% | concerts, livestreams |
| 9 | Other | 6% | music on TV, phone-to-phone transfers |
Short-form video platforms like TikTok, with an 8% share of primary music listeners, are a fast-growing medium. Several young artists have found initial success and traction using these platforms over the past few years.
And though video “killed the radio star,” it hasn’t killed listening to music on the radio. A healthy, 17% of respondents picked radio as their primary avenue for listening to music.
Streaming Supremacy and Virality
There’s no doubt that the internet has revolutionized how music is being consumed.
Including all video and music streaming, internet-based music consumption was the primary choice for 64% of respondents. That’s not even accounting for livestreams or music purchased through the internet.
| Platform | Share |
|---|---|
| Internet-based | 64% |
| Non-Internet Based | 37% |
This internet-heavy metric is being reflected on the business side as well, with 75% of the music industry’s revenues in the U.S. coming from streaming.
However, for artists, streaming revenue is usually the third-biggest earner after live performances and sales.
But utilizing streaming to its fullest potential keeps modern artists in the loop. For example, Beyoncé was one of the first artists to utilize streaming platforms to release an album completely unannounced in 2013, a marketing move that has been replicated many times since.
Source: IFPI
Data note: IFPI surveyed over 44,000 people from 22 countries, asking them about their primary mode of consuming music. They exclude India and China from their global figures to prevent the size of the population from influencing the global weighted average. Percentages may also not add up to 100 because of rounded figures.

This article was published as a part of Visual Capitalist's Creator Program, which features data-driven visuals from some of our favorite Creators around the world.


Technology
Ranked: Semiconductor Companies by Industry Revenue Share
Nvidia is coming for Intel’s crown. Samsung is losing ground. AI is transforming the space. We break down revenue for semiconductor companies.


Semiconductor Companies by Industry Revenue Share
This was originally posted on our Voronoi app. Download the app for free on Apple or Android and discover incredible data-driven charts from a variety of trusted sources.
Did you know that some computer chips are now retailing for the price of a new BMW?
As computers invade nearly every sphere of life, so too have the chips that power them, raising the revenues of the businesses dedicated to designing them.
But how did various chipmakers measure against each other last year?
We rank the biggest semiconductor companies by their percentage share of the industry’s revenues in 2023, using data from Omdia research.
Which Chip Company Made the Most Money in 2023?
Market leader and industry-defining veteran Intel still holds the crown for the most revenue in the sector, crossing $50 billion in 2023, or 10% of the broader industry’s topline.
All is not well at Intel, however, with the company’s stock price down over 20% year-to-date after it revealed billion-dollar losses in its foundry business.
| Rank | Company | 2023 Revenue | % of Industry Revenue |
|---|---|---|---|
| 1 | Intel | $51B | 9.4% |
| 2 | NVIDIA | $49B | 9.0% |
| 3 | Samsung Electronics | $44B | 8.1% |
| 4 | Qualcomm | $31B | 5.7% |
| 5 | Broadcom | $28B | 5.2% |
| 6 | SK Hynix | $24B | 4.4% |
| 7 | AMD | $22B | 4.1% |
| 8 | Apple | $19B | 3.4% |
| 9 | Infineon Tech | $17B | 3.2% |
| 10 | STMicroelectronics | $17B | 3.2% |
| 11 | Texas Instruments | $17B | 3.1% |
| 12 | Micron Technology | $16B | 2.9% |
| 13 | MediaTek | $14B | 2.6% |
| 14 | NXP | $13B | 2.4% |
| 15 | Analog Devices | $12B | 2.2% |
| 16 | Renesas Electronics Corporation | $11B | 1.9% |
| 17 | Sony Semiconductor Solutions Corporation | $10B | 1.9% |
| 18 | Microchip Technology | $8B | 1.5% |
| 19 | Onsemi | $8B | 1.4% |
| 20 | KIOXIA Corporation | $7B | 1.3% |
| N/A | Others | $126B | 23.2% |
| N/A | Total | $545B | 100% |
Note: Figures are rounded. Totals and percentages may not sum to 100.
Meanwhile, Nvidia is very close to overtaking Intel, after declaring $49 billion of topline revenue for 2023. This is more than double its 2022 revenue ($21 billion), increasing its share of industry revenues to 9%.
Nvidia’s meteoric rise has gotten a huge thumbs-up from investors. It became a trillion dollar stock last year, and broke the single-day gain record for market capitalization this year.
Other chipmakers haven’t been as successful. Out of the top 20 semiconductor companies by revenue, 12 did not match their 2022 revenues, including big names like Intel, Samsung, and AMD.
The Many Different Types of Chipmakers
All of these companies may belong to the same industry, but they don’t focus on the same niche.
According to Investopedia, there are four major types of chips, depending on their functionality: microprocessors, memory chips, standard chips, and complex systems on a chip.
Nvidia’s core business was once GPUs for computers (graphics processing units), but in recent years this has drastically shifted towards microprocessors for analytics and AI.
These specialized chips seem to be where the majority of growth is occurring within the sector. For example, companies that are largely in the memory segment—Samsung, SK Hynix, and Micron Technology—saw peak revenues in the mid-2010s.

-

 Green2 weeks ago
Ranked: Top Countries by Total Forest Loss Since 2001
-

 Travel1 week ago
Ranked: The World’s Top Flight Routes, by Revenue
-

 Technology2 weeks ago
Ranked: Semiconductor Companies by Industry Revenue Share
-

 Money2 weeks ago
Which States Have the Highest Minimum Wage in America?
-

 Real Estate2 weeks ago
Ranked: The Most Valuable Housing Markets in America
-

 Markets2 weeks ago
Charted: Big Four Market Share by S&P 500 Audits
-

 AI2 weeks ago
The Stock Performance of U.S. Chipmakers So Far in 2024
-

 Automotive2 weeks ago
Almost Every EV Stock is Down After Q1 2024