Technology
12 Years of the World’s Top 10 Most Innovative Countries
Article/Editing:
12 Years of the World’s Top 10 Most Innovative Countries
Every year, the UN’s World Intellectual Property Organization (WIPO) scores countries on how innovative their economies are with the Global Innovation Index.
The Index scores countries on indicators of a strong innovation economy. These include R&D spend, general market strength, patent systems and output, and local labor capital. And though a few countries consistently rank high, others are moving in and out of the top 10 rankings.
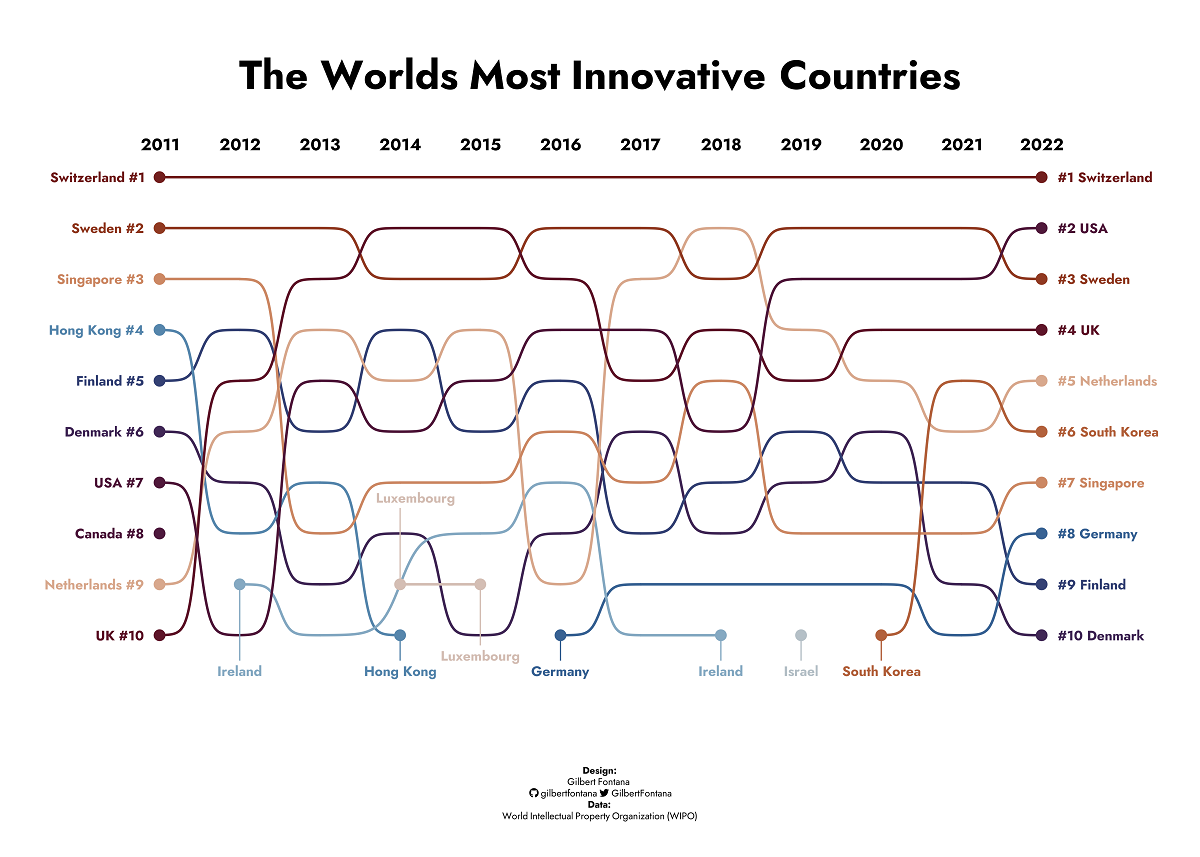
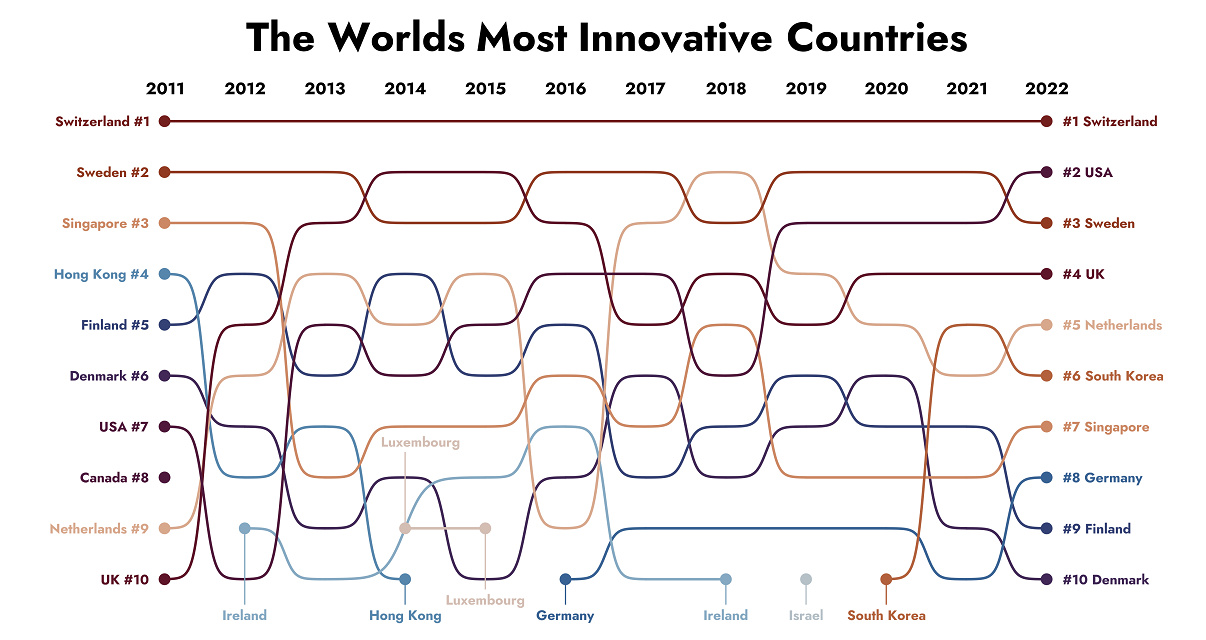
This graphic from Gilbert Fontana details the top 10 most innovative countries in the UN’s WIPO Global Innovation Index from 2011-2022.
Top 10 Innovative Countries (2011–2022)
Over the last 12 years, Switzerland has ranked at the top of the innovation index on the strength of its IP laws and local economic strength.
But much of the remaining top 10 have been in flux:
| Most Innovative Country Rank by Year | 2011 | 2012 | 2013 | 2014 | 2015 | 2016 | 2017 | 2018 | 2019 | 2020 | 2021 | 2022 |
|---|---|---|---|---|---|---|---|---|---|---|---|---|
| Switzerland | 1 | 1 | 1 | 1 | 1 | 1 | 1 | 1 | 1 | 1 | 1 | 1 |
| Sweden | 2 | 2 | 2 | 3 | 3 | 2 | 2 | 3 | 2 | 2 | 2 | 3 |
| Singapore | 3 | 3 | 8 | 7 | 7 | 6 | 7 | 5 | 8 | 8 | 8 | 7 |
| Hong Kong | 4 | 8 | 7 | 10 | n/a | n/a | n/a | n/a | n/a | n/a | n/a | n/a |
| Finland | 5 | 4 | 6 | 4 | 6 | 5 | 8 | 7 | 6 | 7 | 7 | 9 |
| Denmark | 6 | 7 | 9 | 8 | 10 | 8 | 6 | 8 | 7 | 6 | 9 | 10 |
| U.S. | 7 | 10 | 5 | 6 | 5 | 4 | 4 | 6 | 3 | 3 | 3 | 2 |
| Canada | 8 | n/a | n/a | n/a | n/a | n/a | n/a | n/a | n/a | n/a | n/a | n/a |
| Netherlands | 9 | 6 | 4 | 5 | 4 | 9 | 3 | 2 | 4 | 5 | 6 | 5 |
| UK | 10 | 5 | 3 | 2 | 2 | 3 | 5 | 4 | 5 | 4 | 4 | 4 |
| Ireland | n/a | 9 | 10 | n/a | 8 | 7 | 10 | 10 | n/a | n/a | n/a | n/a |
| Luxembourg | n/a | n/a | n/a | 9 | 9 | n/a | n/a | n/a | n/a | n/a | n/a | n/a |
| Germany | n/a | n/a | n/a | n/a | n/a | 10 | 9 | 9 | 9 | 9 | 10 | 8 |
| Israel | n/a | n/a | n/a | n/a | n/a | n/a | n/a | n/a | 10 | n/a | n/a | n/a |
| South Korea | n/a | n/a | n/a | n/a | n/a | n/a | n/a | n/a | n/a | 10 | 5 | 6 |
In addition to Switzerland, seven other countries have been in the top 10 in each year, including Sweden, Singapore, and the United States.
Others have dropped out of the top 10, such as Canada in 2012 and Ireland in 2018. But that let up-and-comers like South Korea and Germany grab one of the top 10 spots. In total, 14 countries have ranked in the top 10 most innovative countries in the world over the time period covered in the visualization.

This article was published as a part of Visual Capitalist's Creator Program, which features data-driven visuals from some of our favorite Creators around the world.


Brands
How Tech Logos Have Evolved Over Time
From complete overhauls to more subtle tweaks, these tech logos have had quite a journey. Featuring: Google, Apple, and more.


How Tech Logos Have Evolved Over Time
This was originally posted on our Voronoi app. Download the app for free on iOS or Android and discover incredible data-driven charts from a variety of trusted sources.
One would be hard-pressed to find a company that has never changed its logo. Granted, some brands—like Rolex, IBM, and Coca-Cola—tend to just have more minimalistic updates. But other companies undergo an entire identity change, thus necessitating a full overhaul.
In this graphic, we visualized the evolution of prominent tech companies’ logos over time. All of these brands ranked highly in a Q1 2024 YouGov study of America’s most famous tech brands. The logo changes are sourced from 1000logos.net.
How Many Times Has Google Changed Its Logo?
Google and Facebook share a 98% fame rating according to YouGov. But while Facebook’s rise was captured in The Social Network (2010), Google’s history tends to be a little less lionized in popular culture.
For example, Google was initially called “Backrub” because it analyzed “back links” to understand how important a website was. Since its founding, Google has undergone eight logo changes, finally settling on its current one in 2015.
| Company | Number of Logo Changes |
|---|---|
| 8 | |
| HP | 8 |
| Amazon | 6 |
| Microsoft | 6 |
| Samsung | 6 |
| Apple | 5* |
Note: *Includes color changes. Source: 1000Logos.net
Another fun origin story is Microsoft, which started off as Traf-O-Data, a traffic counter reading company that generated reports for traffic engineers. By 1975, the company was renamed. But it wasn’t until 2012 that Microsoft put the iconic Windows logo—still the most popular desktop operating system—alongside its name.
And then there’s Samsung, which started as a grocery trading store in 1938. Its pivot to electronics started in the 1970s with black and white television sets. For 55 years, the company kept some form of stars from its first logo, until 1993, when the iconic encircled blue Samsung logo debuted.
Finally, Apple’s first logo in 1976 featured Isaac Newton reading under a tree—moments before an apple fell on his head. Two years later, the iconic bitten apple logo would be designed at Steve Jobs’ behest, and it would take another two decades for it to go monochrome.

-

 Maps1 week ago
The Largest Earthquakes in the New York Area (1970-2024)
-

 Money2 weeks ago
Where Does One U.S. Tax Dollar Go?
-

 Automotive2 weeks ago
Almost Every EV Stock is Down After Q1 2024
-

 AI2 weeks ago
The Stock Performance of U.S. Chipmakers So Far in 2024
-

 Markets2 weeks ago
Charted: Big Four Market Share by S&P 500 Audits
-

 Real Estate2 weeks ago
Ranked: The Most Valuable Housing Markets in America
-

 Money2 weeks ago
Which States Have the Highest Minimum Wage in America?
-

 AI2 weeks ago
Ranked: Semiconductor Companies by Industry Revenue Share