Technology
12 Years of the World’s Top 10 Most Innovative Countries
Article/Editing:
12 Years of the World’s Top 10 Most Innovative Countries
Every year, the UN’s World Intellectual Property Organization (WIPO) scores countries on how innovative their economies are with the Global Innovation Index.
The Index scores countries on indicators of a strong innovation economy. These include R&D spend, general market strength, patent systems and output, and local labor capital. And though a few countries consistently rank high, others are moving in and out of the top 10 rankings.
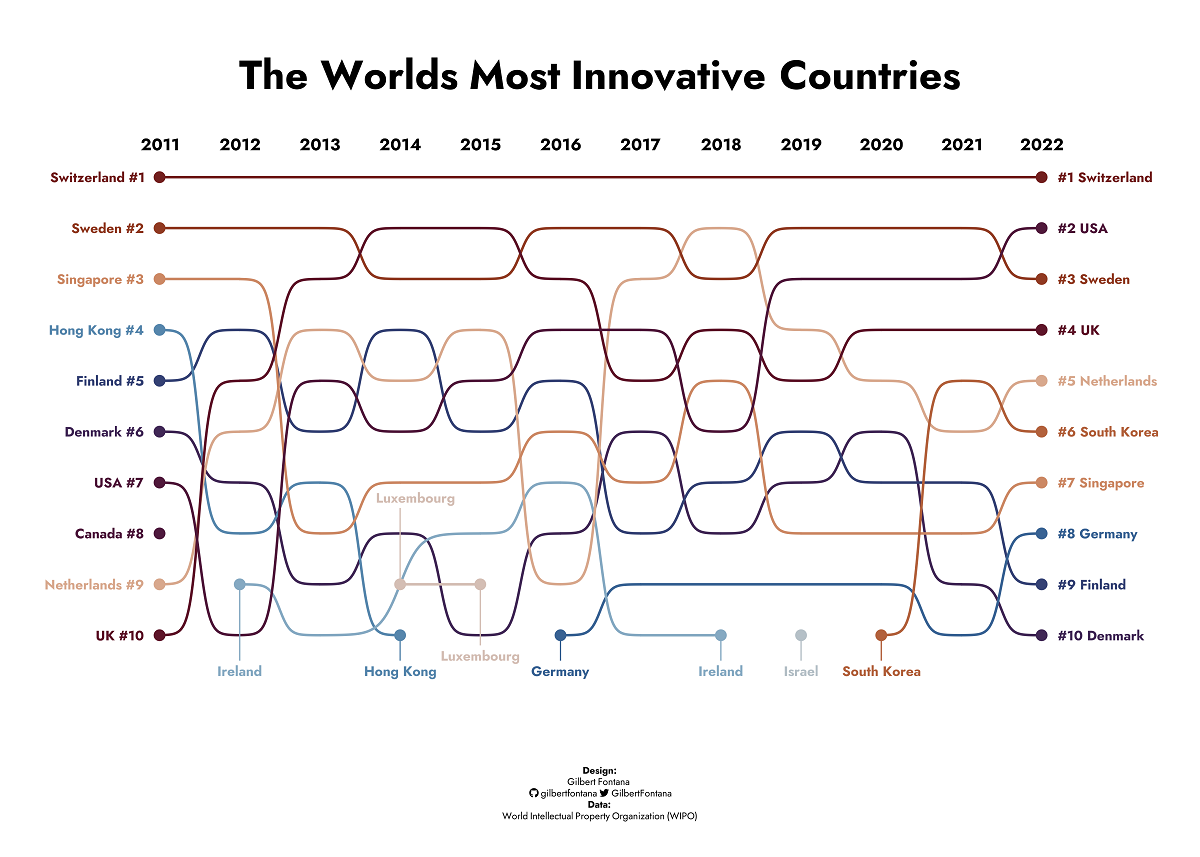
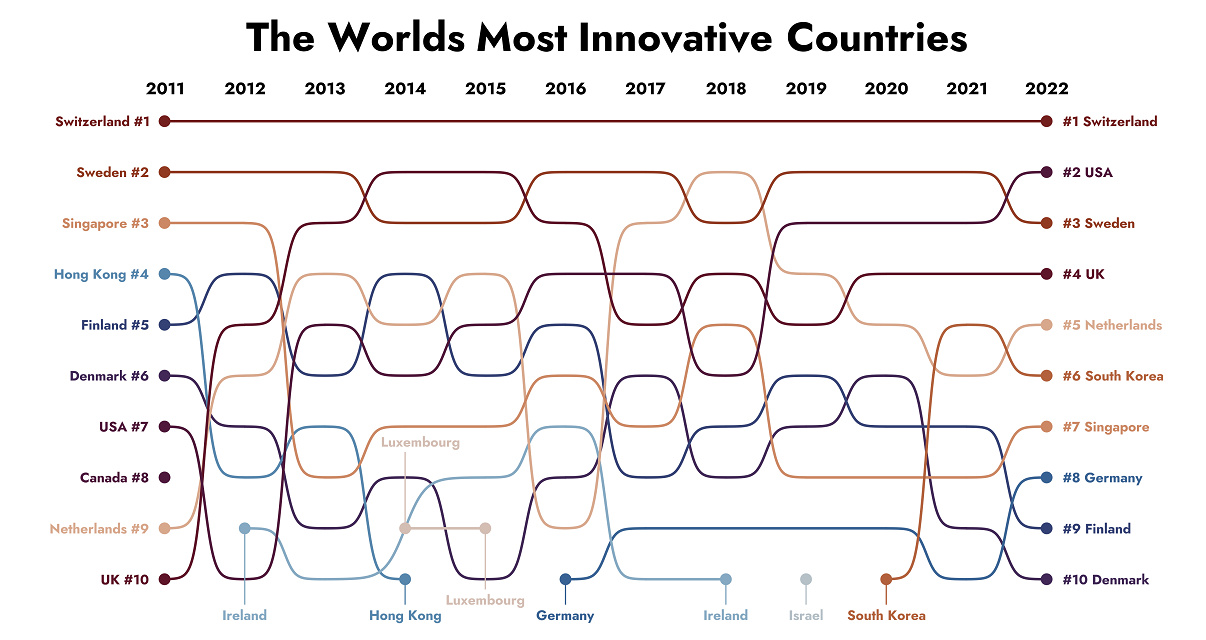
This graphic from Gilbert Fontana details the top 10 most innovative countries in the UN’s WIPO Global Innovation Index from 2011-2022.
Top 10 Innovative Countries (2011–2022)
Over the last 12 years, Switzerland has ranked at the top of the innovation index on the strength of its IP laws and local economic strength.
But much of the remaining top 10 have been in flux:
| Most Innovative Country Rank by Year | 2011 | 2012 | 2013 | 2014 | 2015 | 2016 | 2017 | 2018 | 2019 | 2020 | 2021 | 2022 |
|---|---|---|---|---|---|---|---|---|---|---|---|---|
| Switzerland | 1 | 1 | 1 | 1 | 1 | 1 | 1 | 1 | 1 | 1 | 1 | 1 |
| Sweden | 2 | 2 | 2 | 3 | 3 | 2 | 2 | 3 | 2 | 2 | 2 | 3 |
| Singapore | 3 | 3 | 8 | 7 | 7 | 6 | 7 | 5 | 8 | 8 | 8 | 7 |
| Hong Kong | 4 | 8 | 7 | 10 | n/a | n/a | n/a | n/a | n/a | n/a | n/a | n/a |
| Finland | 5 | 4 | 6 | 4 | 6 | 5 | 8 | 7 | 6 | 7 | 7 | 9 |
| Denmark | 6 | 7 | 9 | 8 | 10 | 8 | 6 | 8 | 7 | 6 | 9 | 10 |
| U.S. | 7 | 10 | 5 | 6 | 5 | 4 | 4 | 6 | 3 | 3 | 3 | 2 |
| Canada | 8 | n/a | n/a | n/a | n/a | n/a | n/a | n/a | n/a | n/a | n/a | n/a |
| Netherlands | 9 | 6 | 4 | 5 | 4 | 9 | 3 | 2 | 4 | 5 | 6 | 5 |
| UK | 10 | 5 | 3 | 2 | 2 | 3 | 5 | 4 | 5 | 4 | 4 | 4 |
| Ireland | n/a | 9 | 10 | n/a | 8 | 7 | 10 | 10 | n/a | n/a | n/a | n/a |
| Luxembourg | n/a | n/a | n/a | 9 | 9 | n/a | n/a | n/a | n/a | n/a | n/a | n/a |
| Germany | n/a | n/a | n/a | n/a | n/a | 10 | 9 | 9 | 9 | 9 | 10 | 8 |
| Israel | n/a | n/a | n/a | n/a | n/a | n/a | n/a | n/a | 10 | n/a | n/a | n/a |
| South Korea | n/a | n/a | n/a | n/a | n/a | n/a | n/a | n/a | n/a | 10 | 5 | 6 |
In addition to Switzerland, seven other countries have been in the top 10 in each year, including Sweden, Singapore, and the United States.
Others have dropped out of the top 10, such as Canada in 2012 and Ireland in 2018. But that let up-and-comers like South Korea and Germany grab one of the top 10 spots. In total, 14 countries have ranked in the top 10 most innovative countries in the world over the time period covered in the visualization.

This article was published as a part of Visual Capitalist's Creator Program, which features data-driven visuals from some of our favorite Creators around the world.


Technology
Ranked: Semiconductor Companies by Industry Revenue Share
Nvidia is coming for Intel’s crown. Samsung is losing ground. AI is transforming the space. We break down revenue for semiconductor companies.


Semiconductor Companies by Industry Revenue Share
This was originally posted on our Voronoi app. Download the app for free on Apple or Android and discover incredible data-driven charts from a variety of trusted sources.
Did you know that some computer chips are now retailing for the price of a new BMW?
As computers invade nearly every sphere of life, so too have the chips that power them, raising the revenues of the businesses dedicated to designing them.
But how did various chipmakers measure against each other last year?
We rank the biggest semiconductor companies by their percentage share of the industry’s revenues in 2023, using data from Omdia research.
Which Chip Company Made the Most Money in 2023?
Market leader and industry-defining veteran Intel still holds the crown for the most revenue in the sector, crossing $50 billion in 2023, or 10% of the broader industry’s topline.
All is not well at Intel, however, with the company’s stock price down over 20% year-to-date after it revealed billion-dollar losses in its foundry business.
| Rank | Company | 2023 Revenue | % of Industry Revenue |
|---|---|---|---|
| 1 | Intel | $51B | 9.4% |
| 2 | NVIDIA | $49B | 9.0% |
| 3 | Samsung Electronics | $44B | 8.1% |
| 4 | Qualcomm | $31B | 5.7% |
| 5 | Broadcom | $28B | 5.2% |
| 6 | SK Hynix | $24B | 4.4% |
| 7 | AMD | $22B | 4.1% |
| 8 | Apple | $19B | 3.4% |
| 9 | Infineon Tech | $17B | 3.2% |
| 10 | STMicroelectronics | $17B | 3.2% |
| 11 | Texas Instruments | $17B | 3.1% |
| 12 | Micron Technology | $16B | 2.9% |
| 13 | MediaTek | $14B | 2.6% |
| 14 | NXP | $13B | 2.4% |
| 15 | Analog Devices | $12B | 2.2% |
| 16 | Renesas Electronics Corporation | $11B | 1.9% |
| 17 | Sony Semiconductor Solutions Corporation | $10B | 1.9% |
| 18 | Microchip Technology | $8B | 1.5% |
| 19 | Onsemi | $8B | 1.4% |
| 20 | KIOXIA Corporation | $7B | 1.3% |
| N/A | Others | $126B | 23.2% |
| N/A | Total | $545B | 100% |
Note: Figures are rounded. Totals and percentages may not sum to 100.
Meanwhile, Nvidia is very close to overtaking Intel, after declaring $49 billion of topline revenue for 2023. This is more than double its 2022 revenue ($21 billion), increasing its share of industry revenues to 9%.
Nvidia’s meteoric rise has gotten a huge thumbs-up from investors. It became a trillion dollar stock last year, and broke the single-day gain record for market capitalization this year.
Other chipmakers haven’t been as successful. Out of the top 20 semiconductor companies by revenue, 12 did not match their 2022 revenues, including big names like Intel, Samsung, and AMD.
The Many Different Types of Chipmakers
All of these companies may belong to the same industry, but they don’t focus on the same niche.
According to Investopedia, there are four major types of chips, depending on their functionality: microprocessors, memory chips, standard chips, and complex systems on a chip.
Nvidia’s core business was once GPUs for computers (graphics processing units), but in recent years this has drastically shifted towards microprocessors for analytics and AI.
These specialized chips seem to be where the majority of growth is occurring within the sector. For example, companies that are largely in the memory segment—Samsung, SK Hynix, and Micron Technology—saw peak revenues in the mid-2010s.

-

 Green2 weeks ago
Ranked: Top Countries by Total Forest Loss Since 2001
-

 Travel1 week ago
Ranked: The World’s Top Flight Routes, by Revenue
-

 Technology2 weeks ago
Ranked: Semiconductor Companies by Industry Revenue Share
-

 Money2 weeks ago
Which States Have the Highest Minimum Wage in America?
-

 Real Estate2 weeks ago
Ranked: The Most Valuable Housing Markets in America
-

 Markets2 weeks ago
Charted: Big Four Market Share by S&P 500 Audits
-

 AI2 weeks ago
The Stock Performance of U.S. Chipmakers So Far in 2024
-

 Automotive2 weeks ago
Almost Every EV Stock is Down After Q1 2024