Markets
The Hardest Hit Companies of the COVID-19 Downturn: The ‘BEACH’ Stocks
 Can I share this graphic?
 When do I need a license?
 Interested in this piece?
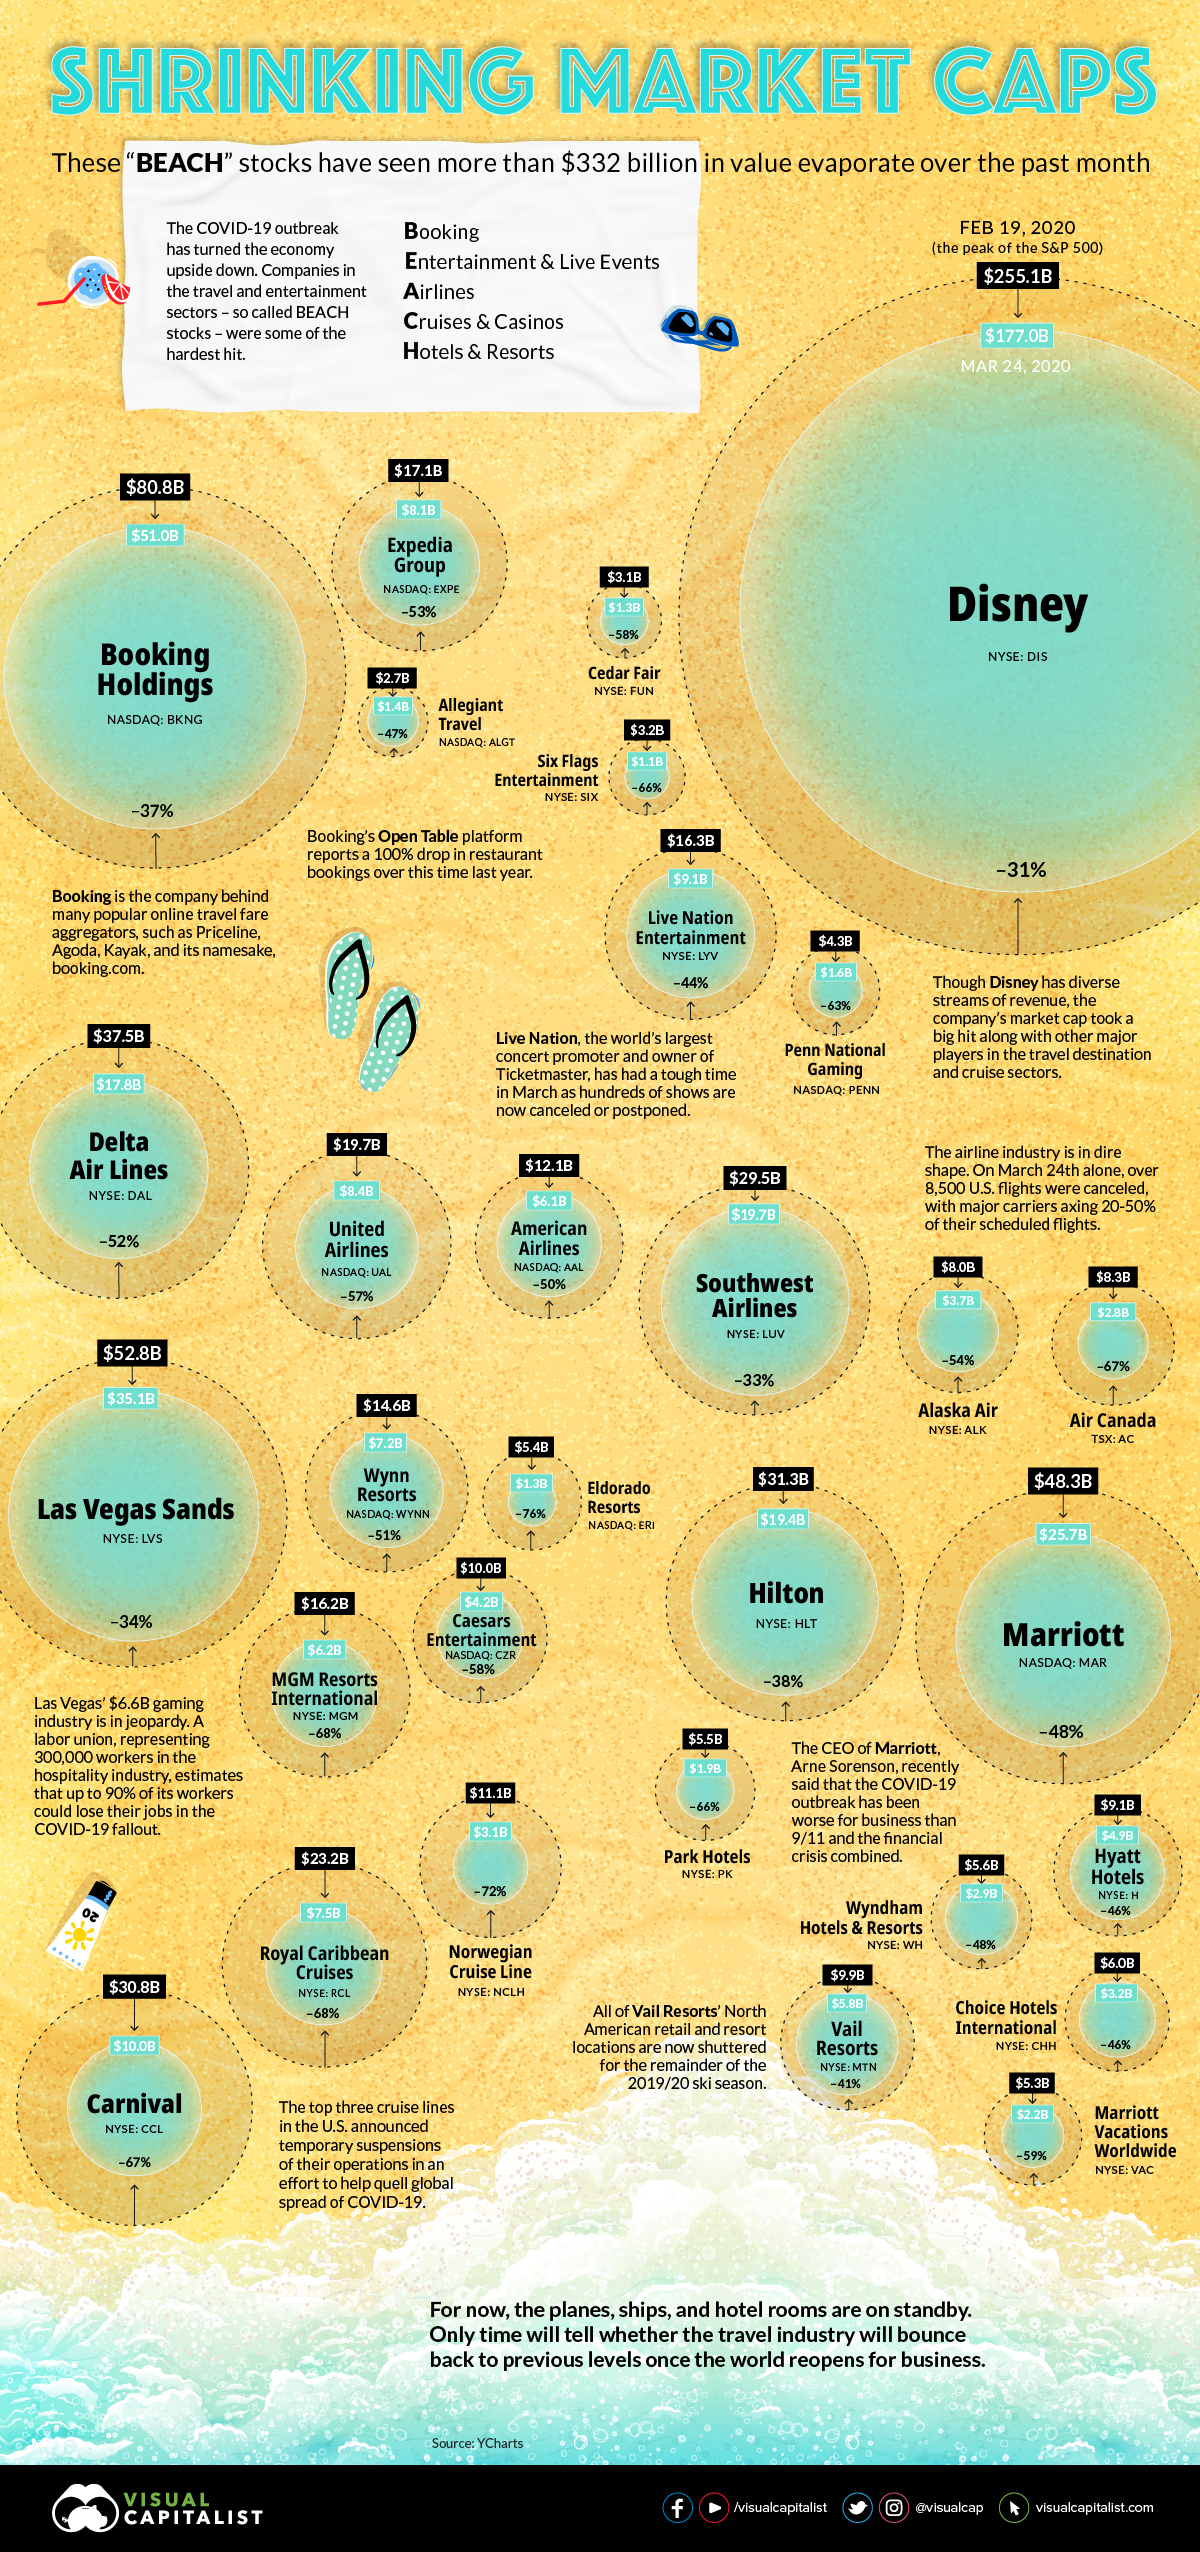
BEACH Stocks: $332B in Value Washed Away
The market’s latest storm has plunged the global travel industry into uncharted territory.
Since the S&P 500 market high on February 19, 2020, market capitalizations across BEACH industries—booking, entertainment, airlines, cruises, and hotels—have tumbled. The global airline industry alone has seen $157B wiped off valuations across 116 publicly traded airlines.
Investor confidence in cruise lines has also dropped. Between Carnival, Royal Caribbean, and Norwegian Cruise Line Holdings, over half of their market value has evaporated—equal to at least $42B in combined market capitalization.
Today’s infographic profiles the steep losses across BEACH companies. It looks at the ripple effects across individual companies and industries from the February 19 peak to date*.
*All numbers as of market close on March 24, 2020
Falling Off A Cliff
As the COVID-19 pandemic has spread to over 100 countries, many governments have implemented sweeping travel restrictions.
The impact across BEACH industries is far-reaching, with some valuations declining to nearly a quarter of their previous total.
| Company | Ticker | Category | Market Cap: 02/19/2020 | Market Cap: 03/24/2020 | % Change |
|---|---|---|---|---|---|
| Booking Holdings | BKNG | Booking | $80.8B | $51B | -37% |
| Expedia Group | EXPE | Booking | $17.1B | $8.1B | -53% |
| Allegiant Travel | ALGT | Booking | $2.7B | $1.4B | -47% |
| Live Nation | LYV | Entertainment & Live Events | $16.3B | $9.1B | -44% |
| Six Flags | SIX | Entertainment & Live Events | $3.2B | $1.1B | -66% |
| Cedar Fair | FUN | Entertainment & Live Events | $3.1B | $1.3B | -58% |
| The Walt Disney Co | DIS | Entertainment & Live Events | $255.1B | $177B | -31% |
| Penn National Gaming | PENN | Entertainment & Live Events | $4.3B | $1.6B | -63% |
| Delta Air Lines | DAL | Airlines | $37.5B | $17.8B | -52% |
| United Airlines | UAL | Airlines | $19.7B | $8.4B | -57% |
| American Airlines | AAL | Airlines | $12.1B | $6.1B | -50% |
| Southwest Airlines | LUV | Airlines | $29.5B | $19.7B | -33% |
| Alaska Air Group | ALK | Airlines | $8B | $3.7B | -54% |
| Air Canada (in USD) | AC | Airlines | $8.3B | $2.8B | -67% |
| Carnival | CCL | Cruise & Casino | $30.8B | $10B | -67% |
| Royal Caribbean Cruises | RCL | Cruise & Casino | $23.2B | $7.5B | -68% |
| Norwegian Cruise Lines | NCLH | Cruise & Casino | $11.1B | $3.1B | -72% |
| Las Vegas Sands | LVS | Cruise & Casino | $52.8B | $35.1B | -34% |
| MGM Resorts International | MGM | Cruise & Casino | $16.2B | $6.2B | -68% |
| Wynn Resorts | WYNN | Cruise & Casino | $14.6B | $7.2B | -51% |
| Caesars Entertainment | CZR | Cruise & Casino | $10B | $4.2B | -58% |
| Eldorado Resorts | ERI | Cruise & Casino | $5.4B | $1.3B | -76% |
| Marriott International | MAR | Hotels & Resorts | $48.3B | $25.7B | -48% |
| Hilton | HLT | Hotels & Resorts | $31.3B | $19.4B | -38% |
| Hyatt Hotels | H | Hotels & Resorts | $9.1B | $4.9B | -46% |
| Choice Hotels International | CHH | Hotels & Resorts | $6B | $3.2B | -46% |
| Wyndham Hotels & Resorts | WH | Hotels & Resorts | $5.6B | $2.9B | -48% |
| Park Hotels | PK | Hotels & Resorts | $5.5B | $1.9B | -66% |
| Vail Resorts | MTN | Hotels & Resorts | $9.98B | $5.8B | -41% |
| Marriott Vacations Worldwide | VAC | Hotels & Resorts | $5.3B | $2.2B | -59% |
For instance, the consequences on various travel bookings brands have been severe. Booking Holdings, the parent company to Booking.com, Priceline, Kayak and OpenTable, witnessed share price declines of over 35% since the peak.
Empty Stadiums
Across the entertainment industry, ticket sales for concerts, movies, and other events are falling precipitously due to cancellations or postponements.
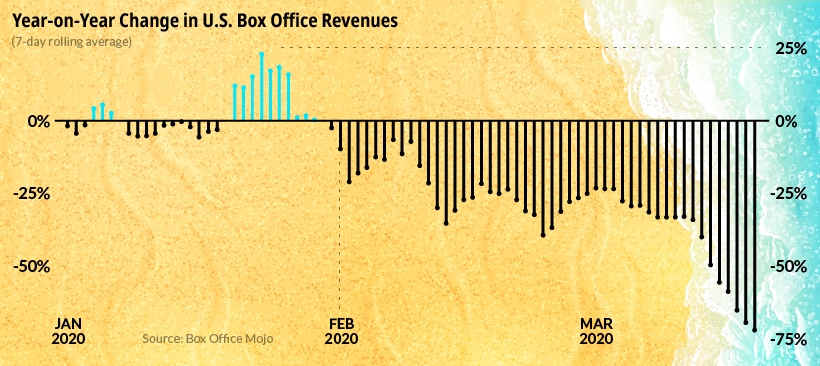
Upwards of $5B in global film industry losses could result from the COVID-19 pandemic.
Chilling footage of the Las Vegas strip, as well as other tourist epicenters around the world, shows deserted streets as visitors opt to stay home instead.
Bracing For Impact
Meanwhile, worldwide airline revenue is estimated to fall by as much as $113B in 2020.
In under two months, the share price of Delta Airlines has fallen over 50% as the company anticipates a capacity reduction of 40%, the largest in its history.
| Company | Ticker | Feb 19 2020 Share Price | Mar 24 2020 Share Price |
|---|---|---|---|
| Delta Air Lines | NYSE:DAL | $58.5 | $26.9 |
| United Airlines | NASDAQ:UAL | $79.4 | $33 |
| American Airlines | NASDAQ:AAL | $28.3 | $13.9 |
| Southwest Airlines | NYSE:LUV | $56.89 | $37.7 |
| Alaska Air Group | NYSE:ALK | $65.2 | $28.9 |
| Air Canada (in CAD) | TSX:AC | $45.3 | $15.1 |
The global airline industry—which employs over 10M people—supports $2.7T in global economic activity across an average of 12M passengers per day.
Aruba, Jamaica No More
As for the cruise line industry, global operations came to a 30-day standstill in mid-March. Over 800 COVID-19 cases and 10 deaths across three cruise ships have been discovered.
“COVID-19 on cruise ships poses a risk for rapid spread of disease, causing outbreaks in a vulnerable population, and aggressive efforts are required to contain spread.”
—CDC
Carnival, a Miami-based company, has witnessed its share price fall to around one third of its February 19 value. Similarly, Royal Caribbean Cruises, which has seen its market cap plummet almost 70%, announced that it will suspend trips until mid-May.
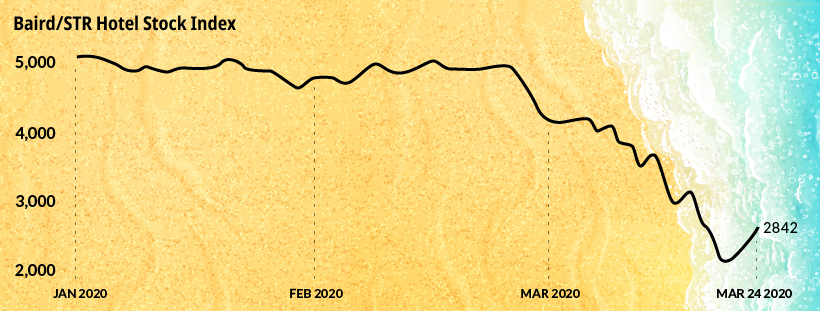
Occupancy Dilemma
As the hotel industry is impacted by the global outbreak, share prices have also realized a significant slump. In the U.S., an estimated $1.4B in revenue is vanishing each week. If occupancy levels fall by just 30% this year, the U.S. hotel industry could see approximately 4 million jobs wiped out.
The Baird/STR Hotel Stock Index, which serves as a benchmark for the sector’s overall health, has declined over 47% year-to-date.
Global Stimulus Response
A number of travel industries around the world are calling for stimulus packages.
On March 25, the U.S. Congress finalized a historic $2T deal, which includes $25B in grants for the airline industry. In the UK, officials are providing small businesses in hospitality and leisure grants that are worth up to $30,000 as part of its $400B bailout plan.
China, Germany, Italy, and Spain have outlined multibillion dollar proposals in response to COVID-19. Overall, at least eleven countries have announced stimulus plans along with the European Commission and the IMF.
When Will the Travel Wave Hit Again?
Amid the COVID-19 pandemic one thing is clear: the impact on the travel industry will have a marked effect on the broader economy.
Travel is closely linked with oil, as transportation accounts for over 60% of global demand. In Q2 2020, global oil consumption is projected to fall by 25M barrels per day.
Along with this, discretionary consumer spending makes up over one third of America’s GDP. The impact of the pandemic across this sector is expected to contribute to a 10% decline or more in U.S. GDP for the second quarter.
As conditions materially improve around the world—with China beginning to open up flights—positive signs are emerging from under the surface. Will BEACH industries quickly bounce back as infection rates drop, or will a slow and painful recovery unfold in the months ahead?


Markets
U.S. Debt Interest Payments Reach $1 Trillion
U.S. debt interest payments have surged past the $1 trillion dollar mark, amid high interest rates and an ever-expanding debt burden.


U.S. Debt Interest Payments Reach $1 Trillion
This was originally posted on our Voronoi app. Download the app for free on iOS or Android and discover incredible data-driven charts from a variety of trusted sources.
The cost of paying for America’s national debt crossed the $1 trillion dollar mark in 2023, driven by high interest rates and a record $34 trillion mountain of debt.
Over the last decade, U.S. debt interest payments have more than doubled amid vast government spending during the pandemic crisis. As debt payments continue to soar, the Congressional Budget Office (CBO) reported that debt servicing costs surpassed defense spending for the first time ever this year.
This graphic shows the sharp rise in U.S. debt payments, based on data from the Federal Reserve.
A $1 Trillion Interest Bill, and Growing
Below, we show how U.S. debt interest payments have risen at a faster pace than at another time in modern history:
| Date | Interest Payments | U.S. National Debt |
|---|---|---|
| 2023 | $1.0T | $34.0T |
| 2022 | $830B | $31.4T |
| 2021 | $612B | $29.6T |
| 2020 | $518B | $27.7T |
| 2019 | $564B | $23.2T |
| 2018 | $571B | $22.0T |
| 2017 | $493B | $20.5T |
| 2016 | $460B | $20.0T |
| 2015 | $435B | $18.9T |
| 2014 | $442B | $18.1T |
| 2013 | $425B | $17.2T |
| 2012 | $417B | $16.4T |
| 2011 | $433B | $15.2T |
| 2010 | $400B | $14.0T |
| 2009 | $354B | $12.3T |
| 2008 | $380B | $10.7T |
| 2007 | $414B | $9.2T |
| 2006 | $387B | $8.7T |
| 2005 | $355B | $8.2T |
| 2004 | $318B | $7.6T |
| 2003 | $294B | $7.0T |
| 2002 | $298B | $6.4T |
| 2001 | $318B | $5.9T |
| 2000 | $353B | $5.7T |
| 1999 | $353B | $5.8T |
| 1998 | $360B | $5.6T |
| 1997 | $368B | $5.5T |
| 1996 | $362B | $5.3T |
| 1995 | $357B | $5.0T |
| 1994 | $334B | $4.8T |
| 1993 | $311B | $4.5T |
| 1992 | $306B | $4.2T |
| 1991 | $308B | $3.8T |
| 1990 | $298B | $3.4T |
| 1989 | $275B | $3.0T |
| 1988 | $254B | $2.7T |
| 1987 | $240B | $2.4T |
| 1986 | $225B | $2.2T |
| 1985 | $219B | $1.9T |
| 1984 | $205B | $1.7T |
| 1983 | $176B | $1.4T |
| 1982 | $157B | $1.2T |
| 1981 | $142B | $1.0T |
| 1980 | $113B | $930.2B |
| 1979 | $96B | $845.1B |
| 1978 | $84B | $789.2B |
| 1977 | $69B | $718.9B |
| 1976 | $61B | $653.5B |
| 1975 | $55B | $576.6B |
| 1974 | $50B | $492.7B |
| 1973 | $45B | $469.1B |
| 1972 | $39B | $448.5B |
| 1971 | $36B | $424.1B |
| 1970 | $35B | $389.2B |
| 1969 | $30B | $368.2B |
| 1968 | $25B | $358.0B |
| 1967 | $23B | $344.7B |
| 1966 | $21B | $329.3B |
Interest payments represent seasonally adjusted annual rate at the end of Q4.
At current rates, the U.S. national debt is growing by a remarkable $1 trillion about every 100 days, equal to roughly $3.6 trillion per year.
As the national debt has ballooned, debt payments even exceeded Medicaid outlays in 2023—one of the government’s largest expenditures. On average, the U.S. spent more than $2 billion per day on interest costs last year. Going further, the U.S. government is projected to spend a historic $12.4 trillion on interest payments over the next decade, averaging about $37,100 per American.
Exacerbating matters is that the U.S. is running a steep deficit, which stood at $1.1 trillion for the first six months of fiscal 2024. This has accelerated due to the 43% increase in debt servicing costs along with a $31 billion dollar increase in defense spending from a year earlier. Additionally, a $30 billion increase in funding for the Federal Deposit Insurance Corporation in light of the regional banking crisis last year was a major contributor to the deficit increase.
Overall, the CBO forecasts that roughly 75% of the federal deficit’s increase will be due to interest costs by 2034.

-

 Green1 week ago
Ranking the Top 15 Countries by Carbon Tax Revenue
-

 Technology2 weeks ago
The Stock Performance of U.S. Chipmakers So Far in 2024
-

 Markets2 weeks ago
Charted: Big Four Market Share by S&P 500 Audits
-

 Real Estate2 weeks ago
Ranked: The Most Valuable Housing Markets in America
-

 Money2 weeks ago
Which States Have the Highest Minimum Wage in America?
-

 AI2 weeks ago
Ranked: Semiconductor Companies by Industry Revenue Share
-

 Travel2 weeks ago
Ranked: The World’s Top Flight Routes, by Revenue
-

 Countries2 weeks ago
Population Projections: The World’s 6 Largest Countries in 2075