Datastream
Which Countries Have the Most Internet Users?
The Briefing
- While China and India have two of the largest digital markets worldwide, they also have a ton of untapped market potential
- India has over 800 million people that aren’t connected to the internet, while China has almost 600 million unconnected citizens
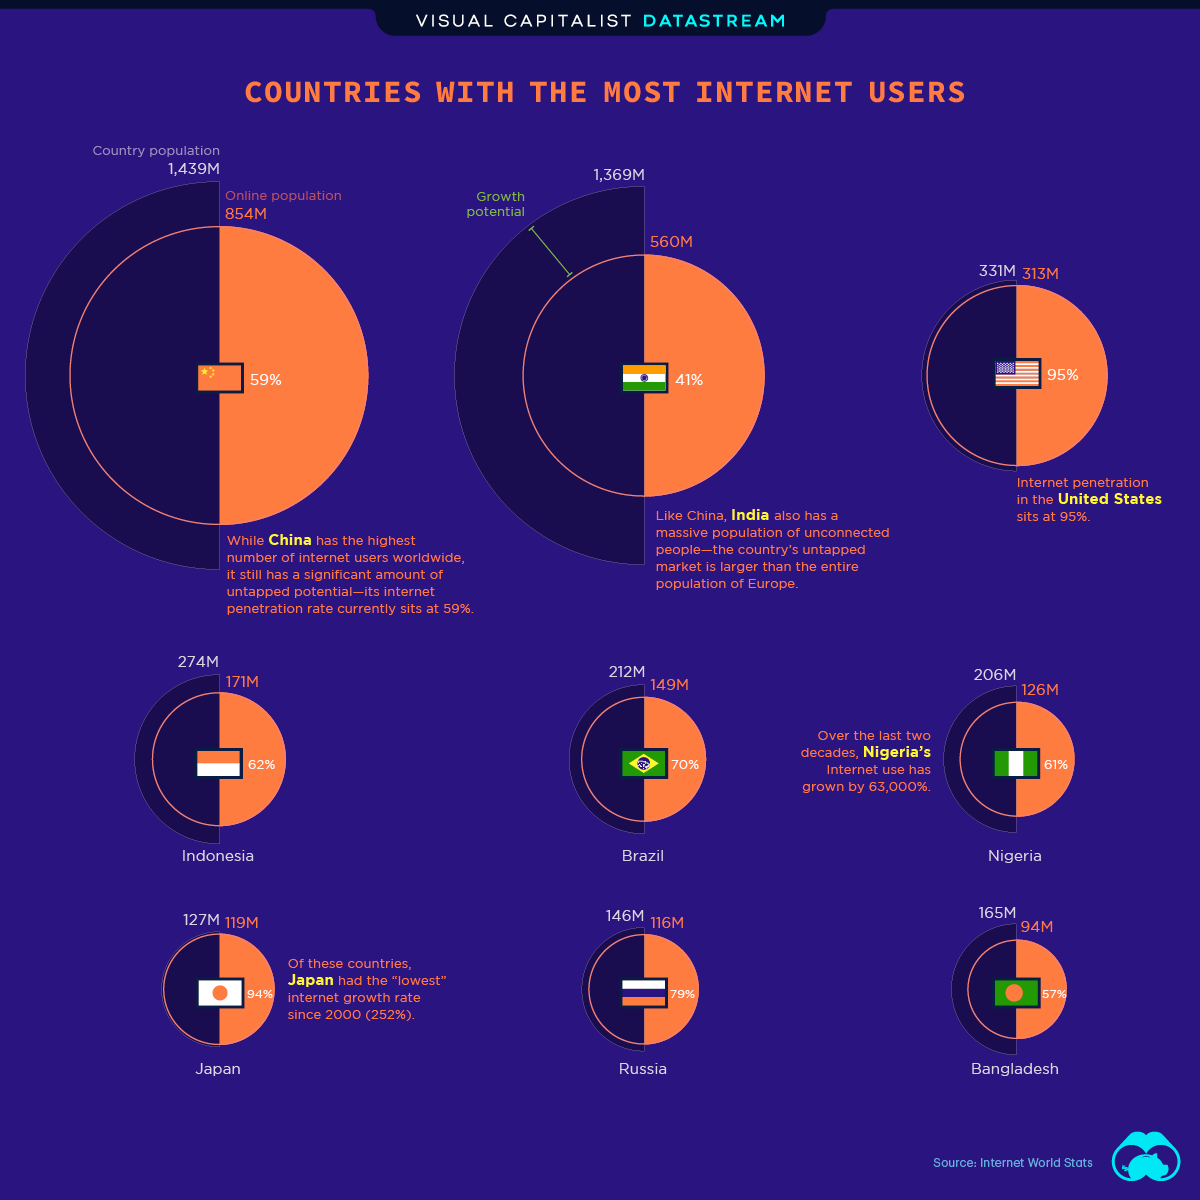
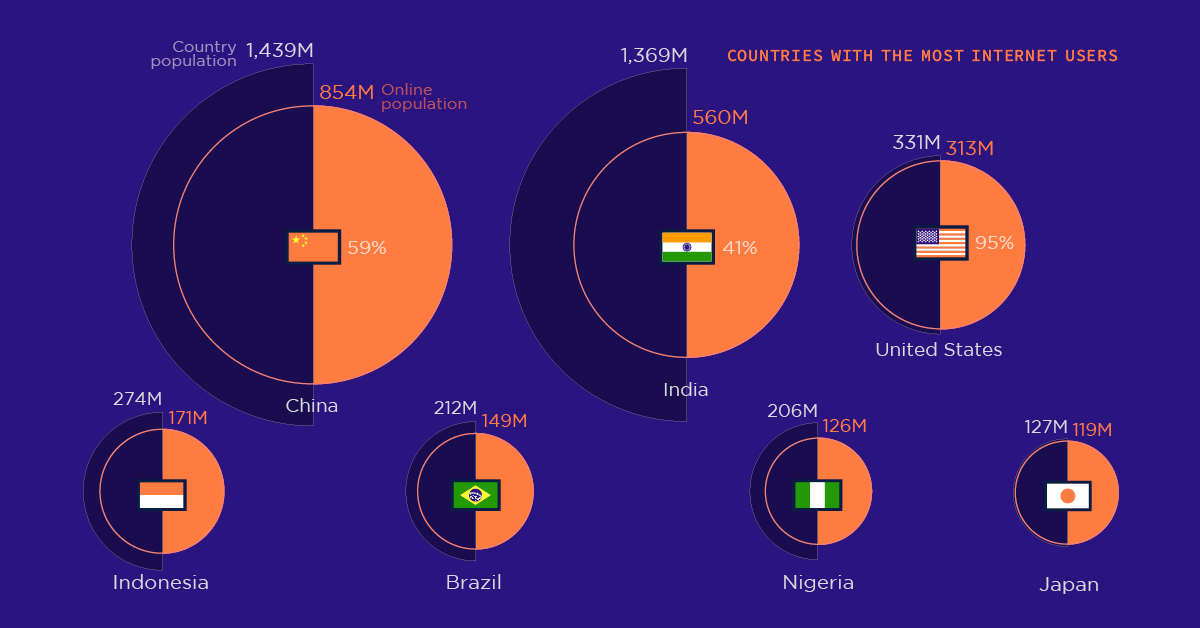
Which Countries Have the Most Internet Users?
When it comes to internet users, some countries have more than others. But a country’s online population doesn’t necessarily reflect its overall connectivity.
To give some perspective, here’s a look at the top nine countries with the highest number of internet users, alongside their internet penetration rates (which is the number of internet users divided by a country’s overall population):
| Country | Internet Users (2020 Q1) | Internet penetration |
|---|---|---|
| 🇨🇳 China | 854,000,000 | 59% |
| 🇮🇳 India | 560,000,000 | 41% |
| 🇺🇸 United States | 313,322,868 | 95% |
| 🇮🇩 Indonesia | 171,260,000 | 62% |
| 🇧🇷 Brazil | 149,057,635 | 70% |
| 🇳🇬 Nigeria | 126,078,999 | 61% |
| 🇯🇵 Japan | 118,626,672 | 94% |
| 🇷🇺 Russia | 116,353,942 | 79% |
| 🇧🇩 Bangladesh | 94,199,000 | 57% |
Based on the table above and this data, it’s clear that some countries, while boasting a high number of internet users, have a long way to go before reaching full connectivity.
Take China, for instance—while the country has the highest number of internet users worldwide, it also has millions of unconnected citizens, making its overall internet penetration relatively low at 59%.
Similarly, India has a massive online community, yet its internet penetration sits at 41%. To give some context, the United States has a 95% internet penetration rate—clearly, the two largest online markets hold a ton of untapped potential compared to others across the globe.
Growth Throughout the Decades
Another way to identify emerging online markets is to look at a country’s internet growth over the years.
While internet adoption has seen an overall increase across the board, a few countries have seen astonishing growth—here’s a look at the top five countries with the largest increases this century:
| Country | Internet Growth from 2000-2020 |
|---|---|
| 🇧🇩 Bangladesh | 94,199 % |
| 🇳🇬 Nigeria | 63,000 % |
| 🇻🇳 Vietnam | 34,250 % |
| 🇮🇷 Iran | 27,040 % |
| 🇮🇳 India | 11,200 % |
No, that isn’t a typo. Bangladesh has seen a 94,199% growth in internet users over the last two decades. And yet, despite this colossal increase, its internet penetration still sits at 57%.
It’ll be interesting to see how these figures change over the next few decades. What will the world’s digital landscape look like in 2050? We’ll have to wait and see.
Where does this data come from?
Source: Internet World Stats
Notes: To calculate internet penetration rate, we divided each country’s total number of internet users by their overall population


Datastream
Can You Calculate Your Daily Carbon Footprint?
Discover how the average person’s carbon footprint impacts the environment and learn how carbon credits can offset your carbon footprint.


The Briefing
- A person’s carbon footprint is substantial, with activities such as food consumption creating as much as 4,500 g of CO₂ emissions daily.
- By purchasing carbon credits from Carbon Streaming Corporation, you can offset your own emissions and fund positive climate action.
Your Everyday Carbon Footprint
While many large businesses and countries have committed to net-zero goals, it is essential to acknowledge that your everyday activities also contribute to global emissions.
In this graphic, sponsored by Carbon Streaming Corporation, we will explore how the choices we make and the products we use have a profound impact on our carbon footprint.
Carbon Emissions by Activity
Here are some of the daily activities and products of the average person and their carbon footprint, according to Clever Carbon.
| Household Activities & Products | CO2 Emissions (g) |
|---|---|
| 💡 Standard Light Bulb (100 watts, four hours) | 172 g |
| 📱 Mobile Phone Use (195 minutes per day)* | 189 g |
| 👕 Washing Machine (0.63 kWh) | 275 g |
| 🔥 Electric Oven (1.56 kWh) | 675 g |
| ♨️ Tumble Dryer (2.5 kWh) | 1,000 g |
| 🧻 Toilet Roll (2 ply) | 1,300 g |
| 🚿 Hot Shower (10 mins) | 2,000 g |
| 🚙 Daily Commute (one hour, by car) | 3,360 g |
| 🍽️ Average Daily Food Consumption (three meals of 600 calories) | 4,500 g |
| *Phone use based on yearly use of 69kg per the source, Reboxed | |
Your choice of transportation plays a crucial role in determining your carbon footprint. For instance, a 15 km daily commute to work on public transport generates an average of 1,464 g of CO₂ emissions. Compared to 3,360 g—twice the volume for a journey the same length by car.
By opting for more sustainable modes of transport, such as cycling, walking, or public transportation, you can significantly reduce your carbon footprint.
Addressing Your Carbon Footprint
One way to compensate for your emissions is by purchasing high-quality carbon credits.
Carbon credits are used to help fund projects that avoid, reduce or remove CO₂ emissions. This includes nature-based solutions such as reforestation and improved forest management, or technology-based solutions such as the production of biochar and carbon capture and storage (CCS).
While carbon credits offer a potential solution for individuals to help reduce global emissions, public awareness remains a significant challenge. A BCG-Patch survey revealed that only 34% of U.S. consumers are familiar with carbon credits, and only 3% have purchased them in the past.
About Carbon Streaming
By financing the creation or expansion of carbon projects, Carbon Streaming Corporation secures the rights to future carbon credits generated by these sustainable projects. You can then purchase these carbon credits to help fund climate solutions around the world and compensate for your own emissions.
Ready to get involved?
>> Learn more about purchasing carbon credits at Carbon Streaming

-

 Real Estate2 weeks ago
Visualizing America’s Shortage of Affordable Homes
-

 Technology1 week ago
Ranked: Semiconductor Companies by Industry Revenue Share
-

 Money1 week ago
Which States Have the Highest Minimum Wage in America?
-

 Real Estate1 week ago
Ranked: The Most Valuable Housing Markets in America
-

 Business2 weeks ago
Charted: Big Four Market Share by S&P 500 Audits
-

 AI2 weeks ago
The Stock Performance of U.S. Chipmakers So Far in 2024
-

 Misc2 weeks ago
Almost Every EV Stock is Down After Q1 2024
-

 Money2 weeks ago
Where Does One U.S. Tax Dollar Go?