Markets
Visualizing the Countries Most Reliant on Tourism
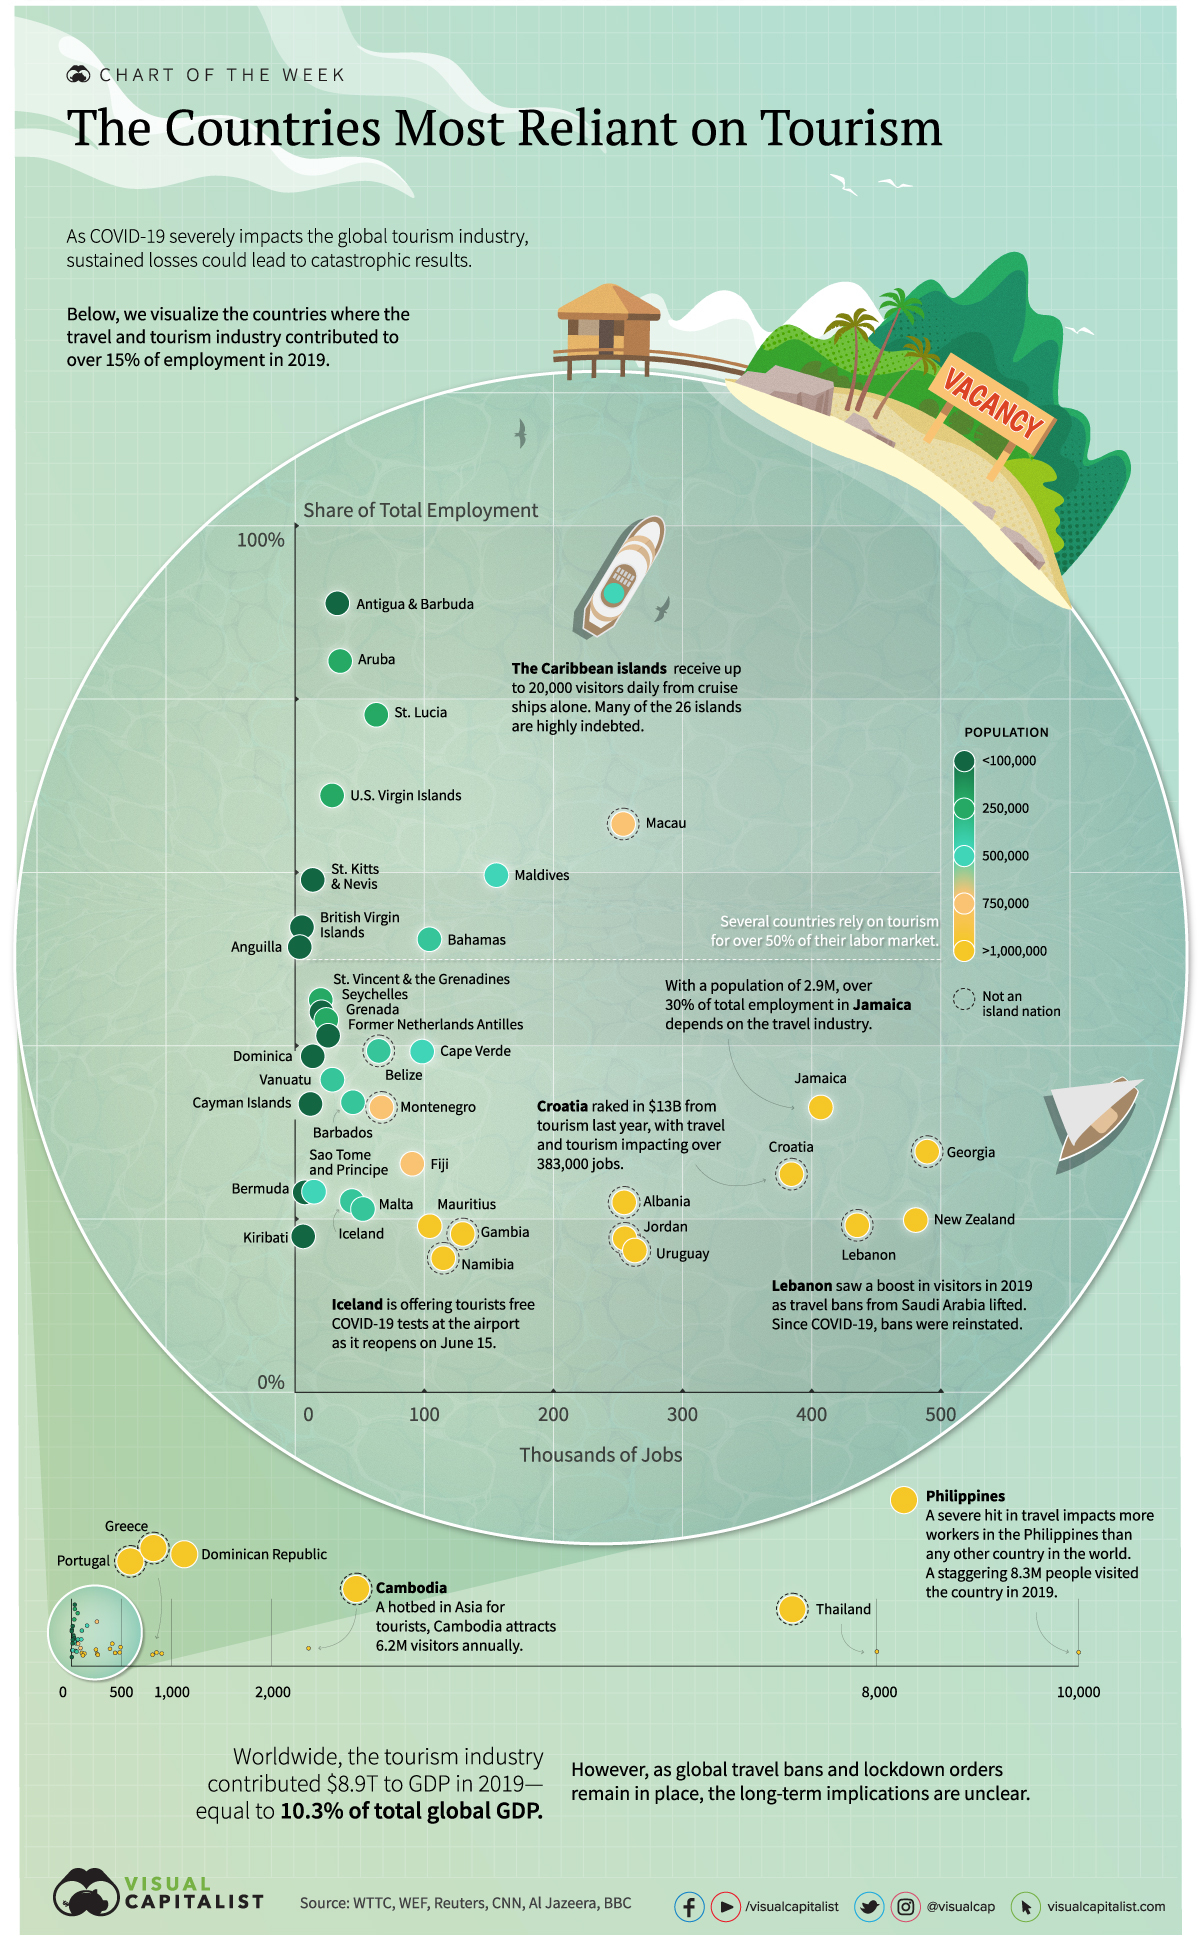


Visualizing the Countries Most Reliant on Tourism
Without a steady influx of tourism revenue, many countries could face severe economic damage.
As the global travel and tourism industry stalls, the spillover effects to global employment are wide-reaching. A total of 330 million jobs are supported by this industry around the world, and it contributes 10%, or $8.9 trillion to global GDP each year.
Today’s infographic uses data from the World Travel & Tourism Council, and it highlights the countries that depend the most on the travel and tourism industry according to employment—quantifying the scale that the industry contributes to the health of the global economy.
Ground Control
Worldwide, 44 countries rely on the travel and tourism industry for more than 15% of their total share of employment. Unsurprisingly, many of the countries suffering the most economic damage are island nations.
At the same time, data reveals the extent to which certain larger nations rely on tourism. In New Zealand, for example, 479,000 jobs are generated by the travel and tourism industry, while in Cambodia tourism contributes to 2.4 million jobs.
| Rank | Country | T&T Share of Jobs (2019) | T&T Jobs (2019) | Population |
|---|---|---|---|---|
| 1 | Antigua & Barbuda | 91% | 33,800 | 97,900 |
| 2 | Aruba | 84% | 35,000 | 106,800 |
| 3 | St. Lucia | 78% | 62,900 | 183,600 |
| 4 | US Virgin Islands | 69% | 28,800 | 104,400 |
| 5 | Macau | 66% | 253,700 | 649,300 |
| 6 | Maldives | 60% | 155,600 | 540,500 |
| 7 | St. Kitts & Nevis | 59% | 14,100 | 53,200 |
| 8 | British Virgin Islands | 54% | 5,500 | 30,200 |
| 9 | Bahamas | 52% | 103,900 | 393,200 |
| 10 | Anguilla | 51% | 3,800 | 15,000 |
| 11 | St. Vincent & the Grenadines | 45% | 19,900 | 110,900 |
| 12 | Seychelles | 44% | 20,600 | 98,300 |
| 13 | Grenada | 43% | 24,300 | 112,500 |
| 14 | Former Netherlands Antilles | 41% | 25,700 | 26,200 |
| 15 | Belize | 39% | 64,800 | 397,600 |
| 16 | Cape Verde | 39% | 98,300 | 556,000 |
| 17 | Dominica | 39% | 13,600 | 72,000 |
| 18 | Vanuatu | 36% | 29,000 | 307,100 |
| 19 | Barbados | 33% | 44,900 | 287,400 |
| 20 | Cayman Islands | 33% | 12,300 | 65,700 |
| 21 | Jamaica | 33% | 406,100 | 2,961,000 |
| 22 | Montenegro | 33% | 66,900 | 628,100 |
| 23 | Georgia | 28% | 488,200 | 3,989,000 |
| 24 | Cambodia | 26% | 2,371,100 | 16,719,000 |
| 25 | Fiji | 26% | 90,700 | 896,400 |
| 26 | Croatia | 25% | 383,400 | 4,105,000 |
| 27 | Philippines | 24% | 10,237,700 | 109,600,000 |
| 28 | Sao Tome and Principe | 23% | 14,500 | 219,200 |
| 29 | Bermuda | 23% | 7,800 | 62,300 |
| 30 | Albania | 22% | 254,300 | 2,880,000 |
| 31 | Iceland | 22% | 44,100 | 341,200 |
| 32 | Greece | 22% | 846,200 | 10,420,000 |
| 33 | Thailand | 21% | 8,054,600 | 69,800,000 |
| 34 | Malta | 21% | 52,800 | 441,500 |
| 35 | New Zealand | 20% | 479,400 | 4,822,000 |
| 36 | Lebanon | 19% | 434,200 | 6,825,000 |
| 37 | Mauritius | 19% | 104,200 | 1,272,000 |
| 38 | Portugal | 19% | 902,400 | 10,197,000 |
| 39 | Kiribati | 18% | 6,600 | 119,000 |
| 40 | Gambia | 18% | 129,600 | 2,417,000 |
| 41 | Jordan | 18% | 254,700 | 10,200,000 |
| 42 | Dominican Republic | 17% | 810,800 | 10,848,000 |
| 43 | Uruguay | 16% | 262,500 | 3,474,000 |
| 44 | Namibia | 15% | 114,600 | 2,541,000 |
Croatia, another tourist hotspot, is hoping to reopen in time for peak season—the country generated tourism revenues of $13B in 2019. With a population of over 4 million, travel and tourism contributes to 25% of its workforce.
How the 20 Largest Economies Stack Up
Tourist-centric countries remain the hardest hit from global travel bans, but the world’s biggest economies are also feeling the impact.
In Spain, tourism ranks as the third highest contributor to its economy. If lockdowns remain in place until September, it is projected to lose $68 billion (€62 billion) in revenues.
| Rank | Country | Travel and Tourism, Contribution to GDP |
|---|---|---|
| 1 | Mexico | 15.5% |
| 2 | Spain | 14.3% |
| 3 | Italy | 13.0% |
| 4 | Turkey | 11.3% |
| 5 | China | 11.3% |
| 6 | Australia | 10.8% |
| 7 | Saudi Arabia | 9.5% |
| 8 | Germany | 9.1% |
| 9 | United Kingdom | 9.0% |
| 10 | U.S. | 8.6% |
| 11 | France | 8.5% |
| 12 | Brazil | 7.7% |
| 13 | Switzerland | 7.6% |
| 14 | Japan | 7.0% |
| 15 | India | 6.8% |
| 16 | Canada | 6.3% |
| 17 | Netherlands | 5.7% |
| 18 | Indonesia | 5.7% |
| 19 | Russia | 5.0% |
| 20 | South Korea | 2.8% |
On the other hand, South Korea is impacted the least: just 2.8% of its GDP is reliant on tourism.
Travel, Interrupted
Which countries earn the most from the travel and tourism industry in absolute dollar terms?
Topping the list was the U.S., with tourism contributing over $1.8 trillion to its economy, or 8.6% of its GDP in 2019. The U.S. remains a global epicenter for COVID-19 cases, and details remain unconfirmed if the country will reopen to visitors before summer.
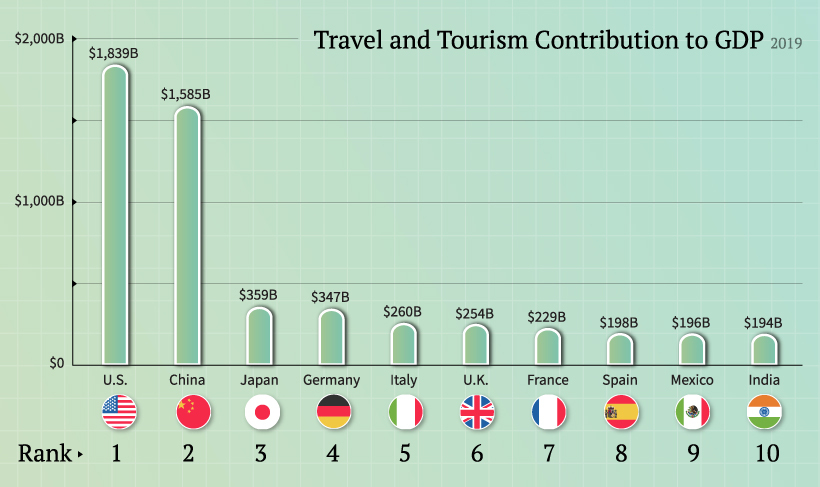
Meanwhile, the contribution of travel and tourism to China’s economy has more than doubled over the last decade, approaching $1.6 trillion. To help bolster economic activity, China and South Korea have eased restrictions by establishing a travel corridor.
As countries slowly reopen, other travel bubbles are beginning to make headway. For example, Estonia, Latvia, and Lithuania have eased travel restrictions by creating an established travel zone. Australia and New Zealand have a similar arrangement on the horizon. These travel bubbles allow citizens from each country to travel within a given zone.
Of course, COVID-19 will have a lasting impact on employment and global economic activity with inconceivable outcomes. When the dust finally settles, could global tourism face a reckoning?


Markets
U.S. Debt Interest Payments Reach $1 Trillion
U.S. debt interest payments have surged past the $1 trillion dollar mark, amid high interest rates and an ever-expanding debt burden.


U.S. Debt Interest Payments Reach $1 Trillion
This was originally posted on our Voronoi app. Download the app for free on iOS or Android and discover incredible data-driven charts from a variety of trusted sources.
The cost of paying for America’s national debt crossed the $1 trillion dollar mark in 2023, driven by high interest rates and a record $34 trillion mountain of debt.
Over the last decade, U.S. debt interest payments have more than doubled amid vast government spending during the pandemic crisis. As debt payments continue to soar, the Congressional Budget Office (CBO) reported that debt servicing costs surpassed defense spending for the first time ever this year.
This graphic shows the sharp rise in U.S. debt payments, based on data from the Federal Reserve.
A $1 Trillion Interest Bill, and Growing
Below, we show how U.S. debt interest payments have risen at a faster pace than at another time in modern history:
| Date | Interest Payments | U.S. National Debt |
|---|---|---|
| 2023 | $1.0T | $34.0T |
| 2022 | $830B | $31.4T |
| 2021 | $612B | $29.6T |
| 2020 | $518B | $27.7T |
| 2019 | $564B | $23.2T |
| 2018 | $571B | $22.0T |
| 2017 | $493B | $20.5T |
| 2016 | $460B | $20.0T |
| 2015 | $435B | $18.9T |
| 2014 | $442B | $18.1T |
| 2013 | $425B | $17.2T |
| 2012 | $417B | $16.4T |
| 2011 | $433B | $15.2T |
| 2010 | $400B | $14.0T |
| 2009 | $354B | $12.3T |
| 2008 | $380B | $10.7T |
| 2007 | $414B | $9.2T |
| 2006 | $387B | $8.7T |
| 2005 | $355B | $8.2T |
| 2004 | $318B | $7.6T |
| 2003 | $294B | $7.0T |
| 2002 | $298B | $6.4T |
| 2001 | $318B | $5.9T |
| 2000 | $353B | $5.7T |
| 1999 | $353B | $5.8T |
| 1998 | $360B | $5.6T |
| 1997 | $368B | $5.5T |
| 1996 | $362B | $5.3T |
| 1995 | $357B | $5.0T |
| 1994 | $334B | $4.8T |
| 1993 | $311B | $4.5T |
| 1992 | $306B | $4.2T |
| 1991 | $308B | $3.8T |
| 1990 | $298B | $3.4T |
| 1989 | $275B | $3.0T |
| 1988 | $254B | $2.7T |
| 1987 | $240B | $2.4T |
| 1986 | $225B | $2.2T |
| 1985 | $219B | $1.9T |
| 1984 | $205B | $1.7T |
| 1983 | $176B | $1.4T |
| 1982 | $157B | $1.2T |
| 1981 | $142B | $1.0T |
| 1980 | $113B | $930.2B |
| 1979 | $96B | $845.1B |
| 1978 | $84B | $789.2B |
| 1977 | $69B | $718.9B |
| 1976 | $61B | $653.5B |
| 1975 | $55B | $576.6B |
| 1974 | $50B | $492.7B |
| 1973 | $45B | $469.1B |
| 1972 | $39B | $448.5B |
| 1971 | $36B | $424.1B |
| 1970 | $35B | $389.2B |
| 1969 | $30B | $368.2B |
| 1968 | $25B | $358.0B |
| 1967 | $23B | $344.7B |
| 1966 | $21B | $329.3B |
Interest payments represent seasonally adjusted annual rate at the end of Q4.
At current rates, the U.S. national debt is growing by a remarkable $1 trillion about every 100 days, equal to roughly $3.6 trillion per year.
As the national debt has ballooned, debt payments even exceeded Medicaid outlays in 2023—one of the government’s largest expenditures. On average, the U.S. spent more than $2 billion per day on interest costs last year. Going further, the U.S. government is projected to spend a historic $12.4 trillion on interest payments over the next decade, averaging about $37,100 per American.
Exacerbating matters is that the U.S. is running a steep deficit, which stood at $1.1 trillion for the first six months of fiscal 2024. This has accelerated due to the 43% increase in debt servicing costs along with a $31 billion dollar increase in defense spending from a year earlier. Additionally, a $30 billion increase in funding for the Federal Deposit Insurance Corporation in light of the regional banking crisis last year was a major contributor to the deficit increase.
Overall, the CBO forecasts that roughly 75% of the federal deficit’s increase will be due to interest costs by 2034.

-

 Maps2 weeks ago
Mapped: Average Wages Across Europe
-

 Money1 week ago
Which States Have the Highest Minimum Wage in America?
-

 Real Estate1 week ago
Ranked: The Most Valuable Housing Markets in America
-

 Markets1 week ago
Charted: Big Four Market Share by S&P 500 Audits
-

 AI1 week ago
The Stock Performance of U.S. Chipmakers So Far in 2024
-

 Automotive2 weeks ago
Almost Every EV Stock is Down After Q1 2024
-

 Money2 weeks ago
Where Does One U.S. Tax Dollar Go?
-

 Green2 weeks ago
Ranked: Top Countries by Total Forest Loss Since 2001