Markets
Ranked: The 25 Countries Receiving the Most U.S. Immigration Visas
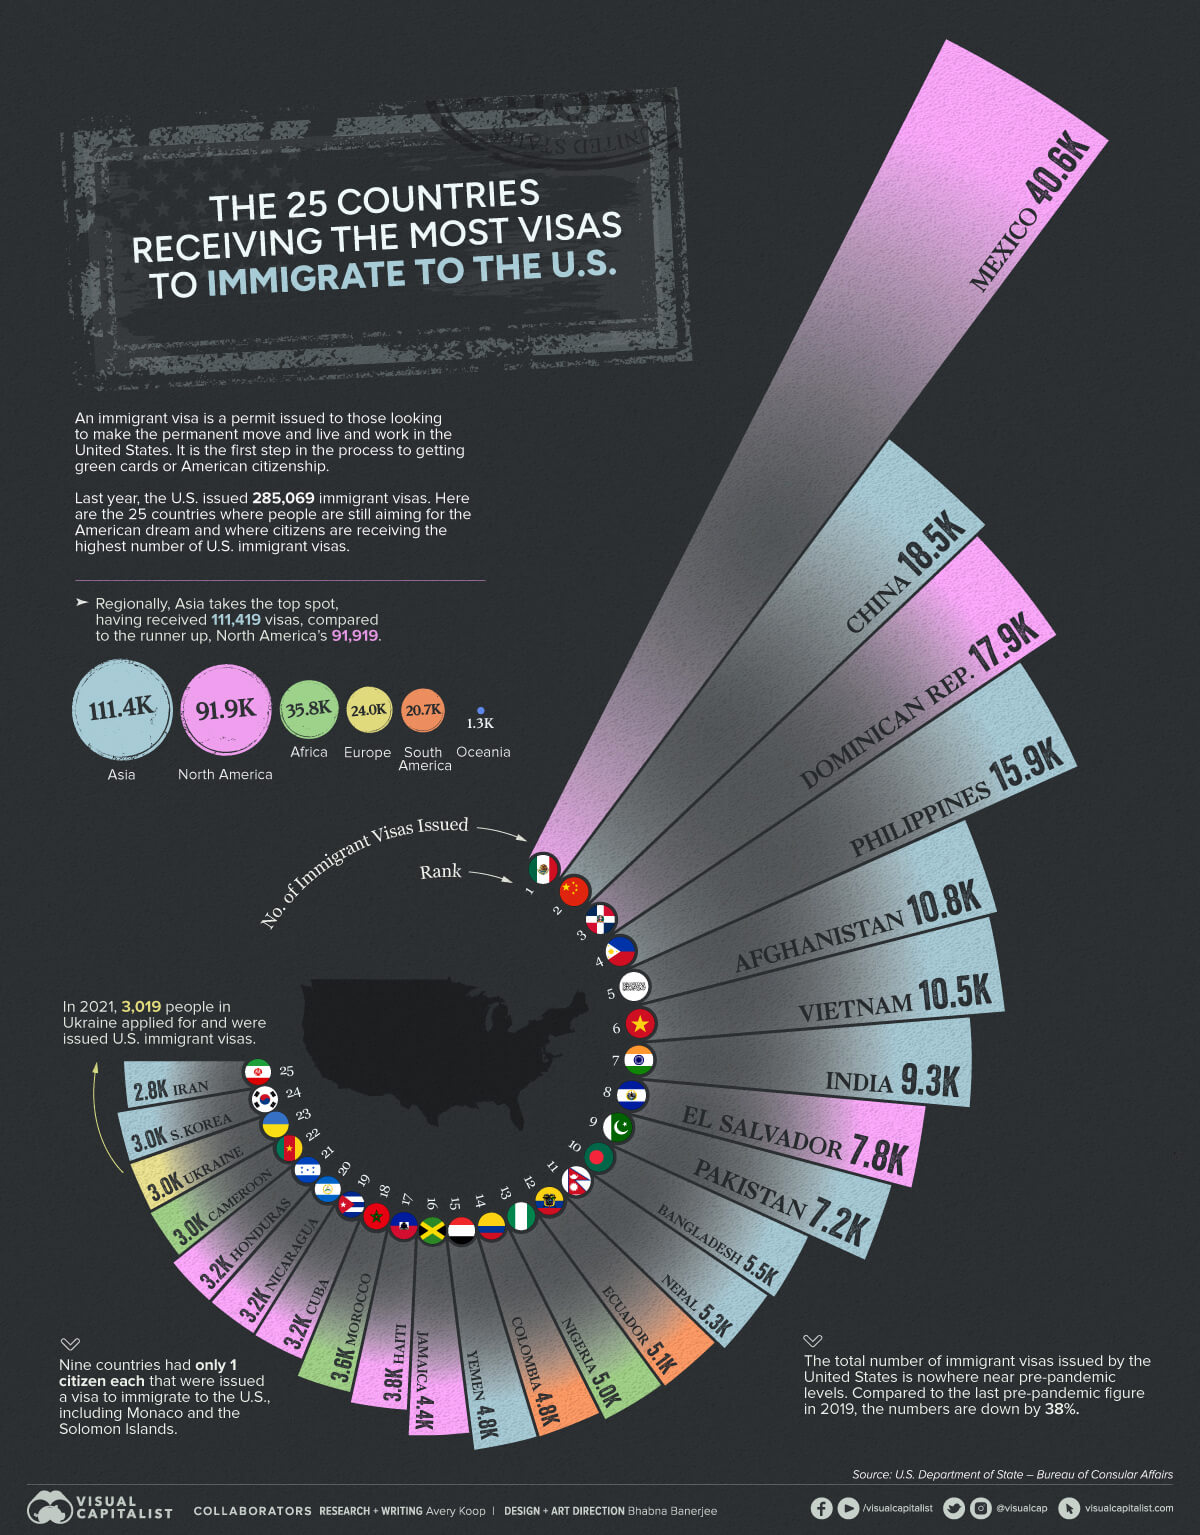


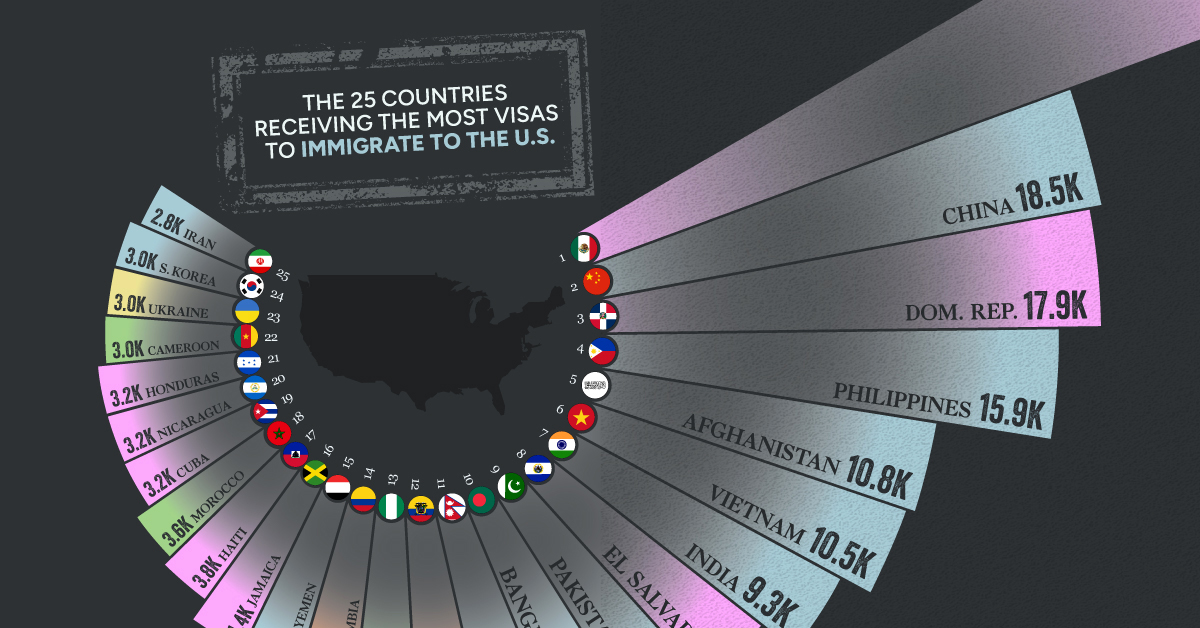
The Top 25 Countries Receiving the Most U.S. Immigration Visas
Although many Americans feel that their country is on the wrong track, this does not stop foreigners from wanting to move to the United States. For many around the globe, the promise of the American dream is still worth the permanent move and hundreds of thousands of people every year apply for their U.S. immigration visas.
The ranking uses annual data from the U.S. Department of State’s Bureau of Consular Affairs to visualize the countries whose citizens are receiving the highest number of U.S. immigrant visas.
U.S. Immigration Processes
The process of U.S. immigration is confusing at best, but it always starts with a visa. A visa, in the context of immigration, is essentially a permit to enter the country, issued to those looking to work and live in the United States. There are two visa categories: immigrant and non-immigrant.
Non-immigrant visas
These visas are typically for temporary workers, but also serve other purposes, like basic travel for tourists from certain countries. Even when obtained for work purposes however, non-immigrant visas expire and do not lead to green cards or citizenship.
Some examples of non-immigrant visas categories include: members of the press, diplomatic representatives, foreign military personnel stationed in the U.S., athletes, and a plethora of other unique situations. The popular, and nearly unattainable, H-1B visas are actually non-immigrant visas.
Immigrant visas
Immigrant visas, on the other hand, can either be employment-based or family-based. The intention behind them is that they will eventually lead to permanent status in the U.S., either through green cards or citizenship. A common example of an immigration visa is the K-1 visa or the “fiancé visa” for individuals marrying American citizens.
Who’s Getting U.S. Immigrant Visas?
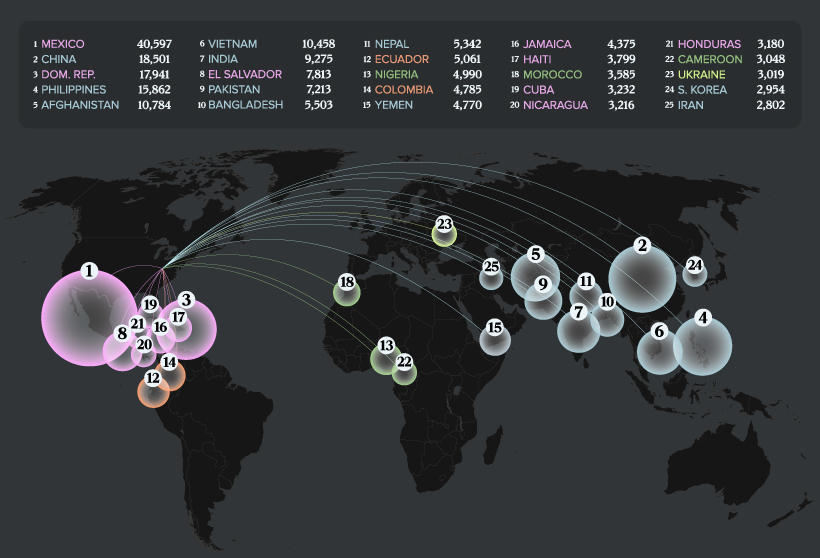
Last year, more than 285,000 U.S. immigrant visas were issued. Here’s a look how that is distributed across every country worldwide:
| Rank | Country | Immigrant Visas Issued (2021) |
|---|---|---|
| #1 | 🇲🇽 Mexico | 40,597 |
| #2 | 🇨🇳 China | 18,501 |
| #3 | 🇩🇴 Dominican Republic | 17,941 |
| #4 | 🇵🇭 Philippines | 15,862 |
| #5 | 🇦🇫 Afghanistan | 10,784 |
| #6 | 🇻🇳 Vietnam | 10,458 |
| #7 | 🇮🇳 India | 9,275 |
| #8 | 🇸🇻 El Salvador | 7,813 |
| #9 | 🇵🇰 Pakistan | 7,213 |
| #10 | 🇧🇩 Bangladesh | 5,503 |
| #11 | 🇳🇵 Nepal | 5,342 |
| #12 | 🇪🇨 Ecuador | 5,061 |
| #13 | 🇳🇬 Nigeria | 4,990 |
| #14 | 🇨🇴 Colombia | 4,785 |
| #15 | 🇾🇪 Yemen | 4,770 |
| #16 | 🇯🇲 Jamaica | 4,375 |
| #17 | 🇭🇹 Haiti | 3,799 |
| #18 | 🇲🇦 Morocco | 3,585 |
| #19 | 🇨🇺 Cuba | 3,232 |
| #20 | 🇳🇮 Nicaragua | 3,216 |
| #21 | 🇭🇳 Honduras | 3,180 |
| #22 | 🇨🇲 Cameroon | 3,048 |
| #23 | 🇺🇦 Ukraine | 3,019 |
| #24 | 🇰🇷 South Korea | 2,954 |
| #25 | 🇮🇷 Iran | 2,802 |
| #26 | 🇯🇴 Jordan | 2,785 |
| #27 | 🇬🇹 Guatemala | 2,717 |
| #28 | 🇬🇾 Guyana | 2,650 |
| #29 | 🇧🇷 Brazil | 2,423 |
| #30 | 🇪🇹 Ethiopia | 2,402 |
| #31 | 🇪🇬 Egypt | 2,230 |
| #32 | 🇬🇭 Ghana | 2,216 |
| #33 | 🇻🇪 Venezuela | 2,031 |
| #34 | 🇩🇿 Algeria | 1,922 |
| #35 | 🇬🇧 United Kingdom | 1,897 |
| #36 | 🇦🇱 Albania | 1,794 |
| #37 | 🇹🇼 Taiwan | 1,775 |
| #38 | 🇵🇪 Peru | 1,772 |
| #39 | 🇰🇪 Kenya | 1,612 |
| #40 | 🇰🇭 Cambodia | 1,586 |
| #41 | 🇱🇧 Lebanon | 1,543 |
| #42 | 🇸🇱 Sierra Leone | 1,481 |
| #43 | 🇨🇦 Canada | 1,464 |
| #44 | 🇯🇵 Japan | 1,401 |
| #45 | 🇹🇷 Turkey | 1,361 |
| #46 | 🇹🇭 Thailand | 1,221 |
| #47 | 🇨🇩 Democratic Republic of the Congo | 1,203 |
| #48 | 🇷🇺 Russia | 1,154 |
| #49 | 🇩🇪 Germany | 1,086 |
| #50 | 🇦🇲 Armenia | 992 |
| #51 | 🇹🇬 Togo | 989 |
| #52 | 🇵🇱 Poland | 942 |
| #53 | 🇨🇮 Cote d'Ivoire | 924 |
| #54 | 🇭🇰 Hong Kong SAR | 838 |
| #55 | 🇱🇷 Liberia | 803 |
| #56 | 🇱🇰 Sri Lanka | 799 |
| #57 | 🇹🇹 Trinidad and Tobago | 793 |
| #58 | 🇧🇾 Belarus | 787 |
| #59 | 🇸🇩 Sudan | 783 |
| #60 | 🇸🇾 Syria | 757 |
| #61 | 🇸🇴 Somalia | 724 |
| #62 | 🇮🇩 Indonesia | 714 |
| #63 | 🇷🇴 Romania | 706 |
| #64 | 🇸🇦 Saudi Arabia | 701 |
| #65 | 🇬🇪 Georgia | 652 |
| #66 | 🇧🇴 Bolivia | 642 |
| #67 | 🇫🇷 France | 622 |
| #67 | 🇮🇹 Italy | 622 |
| #69 | 🇲🇩 Moldova | 611 |
| #70 | 🇦🇷 Argentina | 608 |
| #71 | 🇿🇦 South Africa | 599 |
| #72 | 🇦🇪 United Arab Emirates | 598 |
| #73 | 🇨🇻 Cabo Verde | 597 |
| #74 | 🇰🇬 Kyrgyzstan | 592 |
| #75 | 🇲🇲 Myanmar | 587 |
| #76 | 🇰🇿 Kazakhstan | 584 |
| #77 | 🇮🇶 Iraq | 579 |
| #78 | 🇸🇳 Senegal | 566 |
| #79 | 🇿🇼 Zimbabwe | 543 |
| #80 | 🇨🇷 Costa Rica | 537 |
| #81 | 🇫🇯 Fiji | 522 |
| #82 | 🇽🇰 Kosovo | 520 |
| #83 | 🇺🇿 Uzbekistan | 513 |
| #84 | 🇦🇺 Australia | 505 |
| #85 | 🇬🇳 Guinea | 500 |
| #86 | 🇧🇬 Bulgaria | 493 |
| #87 | 🇬🇲 The Gambia | 484 |
| #88 | 🇲🇰 North Macedonia | 472 |
| #89 | 🇮🇱 Israel | 471 |
| #90 | 🇹🇯 Tajikistan | 444 |
| #91 | 🇨🇱 Chile | 416 |
| #92 | 🇰🇼 Kuwait | 412 |
| #93 | 🇪🇸 Spain | 410 |
| #94 | 🇪🇷 Eritrea | 371 |
| #95 | 🇵🇦 Panama | 363 |
| #96 | 🇲🇳 Mongolia | 355 |
| #97 | 🇧🇯 Benin | 343 |
| #98 | 🇲🇾 Malaysia | 330 |
| #99 | 🇷🇸 Serbia | 328 |
| #100 | 🇦🇿 Azerbaijan | 308 |
| #101 | 🇧🇸 The Bahamas | 303 |
| #102 | 🇹🇿 Tanzania | 301 |
| #103 | 🇹🇳 Tunisia | 298 |
| #104 | 🇱🇨 Saint Lucia | 292 |
| #105 | 🇷🇼 Rwanda | 291 |
| #106 | 🇹🇲 Turkmenistan | 284 |
| #107 | 🇺🇬 Uganda | 281 |
| #108 | 🇩🇲 Dominica | 279 |
| #109 | 🇧🇿 Belize | 278 |
| #110 | 🇧🇫 Burkina Faso | 259 |
| #111 | 🇱🇾 Libya | 233 |
| #112 | 🇧🇦 Bosnia and Herzegovina | 231 |
| #112 | 🇬🇩 Grenada | 231 |
| #114 | 🇮🇪 Ireland | 213 |
| #115 | 🇳🇿 New Zealand | 205 |
| #116 | 🇭🇺 Hungary | 203 |
| #117 | 🇲🇱 Mali | 196 |
| #118 | 🇶🇦 Qatar | 190 |
| #119 | 🇳🇱 Netherlands | 182 |
| #120 | 🇱🇹 Lithuania | 177 |
| #121 | 🇧🇧 Barbados | 170 |
| #122 | 🇬🇷 Greece | 168 |
| #123 | 🇿🇲 Zambia | 152 |
| #124 | 🇸🇬 Singapore | 148 |
| #124 | 🇲🇪 Montenegro | 148 |
| #126 | 🇦🇬 Antigua and Barbuda | 146 |
| #127 | 🇺🇾 Uruguay | 144 |
| #128 | 🇨🇭 Switzerland | 142 |
| #129 | 🇱🇻 Latvia | 131 |
| #130 | 🇸🇪 Sweden | 123 |
| #131 | 🇵🇹 Portugal | 120 |
| #132 | 🇧🇪 Belgium | 114 |
| #133 | 🇻🇨 Saint Vincent and the Grenadines | 113 |
| #134 | 🇳🇪 Niger | 112 |
| #135 | 🇵🇾 Paraguay | 111 |
| #136 | 🇨🇬 Republic of the Congo | 108 |
| #137 | 🇨🇿 Czech Republic | 105 |
| #138 | 🇦🇹 Austria | 104 |
| #139 | 🇧🇮 Burundi | 98 |
| #140 | 🇭🇷 Croatia | 96 |
| #141 | 🇫🇮 Finland | 89 |
| #142 | 🇩🇯 Djibouti | 80 |
| #142 | 🇰🇳 Saint Kitts and Nevis | 80 |
| #144 | 🇸🇰 Slovakia | 77 |
| #145 | 🇧🇭 Bahrain | 66 |
| #146 | 🇲🇼 Malawi | 65 |
| #147 | 🇲🇷 Mauritania | 62 |
| #148 | 🇹🇩 Chad | 57 |
| #149 | 🇦🇴 Angola | 52 |
| #150 | 🇬🇦 Gabon | 49 |
| #151 | 🇪🇪 Estonia | 48 |
| #152 | 🇸🇷 Suriname | 45 |
| #153 | 🇸🇸 South Sudan | 41 |
| #153 | 🇹🇴 Tonga | 41 |
| #155 | 🇴🇲 Oman | 38 |
| #156 | 🇲🇬 Madagascar | 36 |
| #156 | 🇩🇰 Denmark | 36 |
| #156 | 🇮🇸 Iceland | 36 |
| #159 | 🇧🇹 Bhutan | 35 |
| #159 | 🇧🇲 Bermuda | 35 |
| #161 | 🇸🇮 Slovenia | 32 |
| #162 | 🇨🇾 Cyprus | 28 |
| #163 | 🇳🇴 Norway | 23 |
| #164 | 🇨🇫 Central African Republic | 22 |
| #165 | 🇧🇼 Botswana | 21 |
| #165 | 🇹🇨 Turks and Caicos Islands | 21 |
| #167 | 🇲🇴 Macau SAR | 20 |
| #168 | 🇱🇦 Laos | 11 |
| #168 | 🇲🇫 Saint Martin | 11 |
| #168 | 🇻🇬 British Virgin Islands | 11 |
| #171 | 🇲🇿 Mozambique | 10 |
| #171 | 🇳🇦 Namibia | 10 |
| #171 | 🇦🇮 Anguilla | 10 |
| #174 | 🇲🇺 Mauritius | 9 |
| #174 | 🇸🇽 Sint Maarten | 9 |
| #174 | 🇼🇸 Samoa | 9 |
| #177 | 🇬🇼 Guinea-Bissau | 8 |
| #177 | 🇰🇵 North Korea | 8 |
| #177 | 🇨🇼 Curaçao | 8 |
| #180 | 🇰🇾 Cayman Islands | 7 |
| #181 | 🇵🇬 Papua New Guinea | 6 |
| #182 | 🇲🇹 Malta | 5 |
| #182 | 🇦🇼 Aruba | 5 |
| #184 | 🇱🇸 Lesotho | 4 |
| #184 | 🇧🇳 Brunei | 4 |
| #186 | 🇬🇶 Equatorial Guinea | 3 |
| #186 | 🇲🇸 Montserrat | 3 |
| #188 | 🇸🇿 Eswatini | 2 |
| #188 | 🇲🇻 Maldives | 2 |
| #188 | 🇵🇫 French Polynesia | 2 |
| #188 | 🇬🇮 Gibraltar | 2 |
| #188 | 🇱🇺 Luxembourg | 2 |
| #188 | 🇫🇲 Federated Sates of Micronesia | 2 |
| #194 | 🇸🇹 Sao Tome and Principe | 1 |
| #194 | 🇹🇱 Timor-Leste | 1 |
| #194 | 🇳🇨 New Caledonia | 1 |
| #194 | 🇲🇨 Monaco | 1 |
| #194 | 🇨🇽 Christmas Island | 1 |
| #194 | 🇲🇭 Marshall Islands | 1 |
| #194 | 🇵🇼 Palau | 1 |
| #194 | 🇸🇧 Solomon Islands | 1 |
| #194 | 🇻🇺 Vanuatu | 1 |
| #203 | 🇰🇲 Comoros | 0 |
| #203 | 🇪🇭 Western Sahara | 0 |
| #203 | 🇸🇨 Seychelles | 0 |
| #203 | 🇦🇩 Andorra | 0 |
| #203 | 🇫🇴 Faroe Islands | 0 |
| #203 | 🇬🇱 Greenland | 0 |
| #203 | 🇹🇫 French Southern and Antarctic Lands | 0 |
| #203 | 🇧🇱 St. Barthelemy | 0 |
| #203 | 🇵🇲 St. Pierre and Miquelon | 0 |
| #203 | 🇼🇫 Wallis and Futuna | 0 |
| #203 | 🇮🇴 British Indian Ocean Territory | 0 |
| #203 | 🇫🇰 Falkland Islands | 0 |
| #203 | 🇵🇳 Pitcairn | 0 |
| #203 | 🇸🇭 St. Helena | 0 |
| #203 | 🇬🇸 South Georgia and the Sandwich Islands | 0 |
| #203 | 🇱🇮 Liechtenstein | 0 |
| #203 | Northern Ireland (DV Only) | 0 |
| #203 | 🇸🇯 Svalbard | 0 |
| #203 | 🇸🇲 San Marino | 0 |
| #203 | 🇻🇦 Vatican City | 0 |
| #203 | 🇨🇨 Cocos (Keeling) Islands | 0 |
| #203 | 🇳🇫 Norfolk Island | 0 |
| #203 | 🇰🇮 Kiribati | 0 |
| #203 | 🇳🇷 Nauru | 0 |
| #203 | 🇨🇰 Cook Islands | 0 |
| #203 | 🇳🇺 Niue | 0 |
| #203 | 🇹🇰 Tokelau | 0 |
| #203 | 🇹🇻 Tuvalu | 0 |
| Total | 285,069 |
Mexican citizens received the highest number of visas to immigrate permanently to the U.S. at nearly 40,600. America’s other neighbor, Canada, ranked 43rd, only receiving 1,464 visas. China and India also rank high on the list, ranking at #2 and #7 respectively.
Interestingly, only one European country, Ukraine, made the top 25. In 2021, prior to the Russian invasion, Ukrainians obtained 3,019 visas. A number of the top visa recipient nations are marked by violence and political unrest, like Afghanistan (#5) and Iran (#25).
Looking beyond the top 25, one surprising find is that eight North Korean citizens received immigration visas last year. Additionally, a number of countries only received a handful of U.S. immigrant visas including Luxembourg’s two, and Timor-Leste’s one.
Regionally, the bulk of the highest ranking countries are located in Asia. Here’s a breakdown:
| Rank | Region | Immigrant Visas Issued (2021) |
|---|---|---|
| #1 | Asia | 111,419 |
| #2 | North America | 91,919 |
| #3 | Africa | 35,776 |
| #4 | Europe | 23,972 |
| #5 | South America | 20,688 |
| #6 | Oceania | 1,295 |
Finally, here’s the geographical distribution of persons receiving U.S. immigrant visas.
The State of U.S. Immigration
Around 15% of the U.S. population is made up of immigrants, and the country is home to the highest number of total immigrants in the world, at 50.6 million.
In terms of how many visas are issued annually, there is a federal ceiling of 700,000 and certain countries have their own specific caps on how many their citizens can receive, as mandated by the United States. Although the numbers change drastically year by year, they have not come close to the limit in the last decade.
Here’s a look at the total U.S. immigrant visa issuances globally. Notably, they diminished by almost half during the pandemic:
| Year | Immigrant Visas Issued Worldwide | % Change Year-over-Year |
|---|---|---|
| 2012 | 482,300 | - |
| 2013 | 473,115 | -1.9% |
| 2014 | 467,370 | -1.2% |
| 2015 | 531,463 | +13.7% |
| 2016 | 617,752 | +16.2% |
| 2017 | 559,536 | -9.4% |
| 2018 | 533,557 | -4.6% |
| 2019 | 462,422 | -13.3% |
| 2020 | 240,526 | -48.0% |
| 2021 | 285,069 | +18.5% |
Overall, whether for economic purposes, reunification of families, or in fleeing from danger, people are continuing to come to the United States.
In the period between 2016 and 2060, it’s expected that the share of the U.S. population that is American-born is going to grow by 20%. Meanwhile, the share of the population that is foreign-born is expected to jump by 58%.


Economy
Economic Growth Forecasts for G7 and BRICS Countries in 2024
The IMF has released its economic growth forecasts for 2024. How do the G7 and BRICS countries compare?


G7 & BRICS Real GDP Growth Forecasts for 2024
The International Monetary Fund’s (IMF) has released its real gross domestic product (GDP) growth forecasts for 2024, and while global growth is projected to stay steady at 3.2%, various major nations are seeing declining forecasts.
This chart visualizes the 2024 real GDP growth forecasts using data from the IMF’s 2024 World Economic Outlook for G7 and BRICS member nations along with Saudi Arabia, which is still considering an invitation to join the bloc.
Get the Key Insights of the IMF’s World Economic Outlook
Want a visual breakdown of the insights from the IMF’s 2024 World Economic Outlook report?
This visual is part of a special dispatch of the key takeaways exclusively for VC+ members.
Get the full dispatch of charts by signing up to VC+.
Mixed Economic Growth Prospects for Major Nations in 2024
Economic growth projections by the IMF for major nations are mixed, with the majority of G7 and BRICS countries forecasted to have slower growth in 2024 compared to 2023.
Only three BRICS-invited or member countries, Saudi Arabia, the UAE, and South Africa, have higher projected real GDP growth rates in 2024 than last year.
| Group | Country | Real GDP Growth (2023) | Real GDP Growth (2024P) |
|---|---|---|---|
| G7 | 🇺🇸 U.S. | 2.5% | 2.7% |
| G7 | 🇨🇦 Canada | 1.1% | 1.2% |
| G7 | 🇯🇵 Japan | 1.9% | 0.9% |
| G7 | 🇫🇷 France | 0.9% | 0.7% |
| G7 | 🇮🇹 Italy | 0.9% | 0.7% |
| G7 | 🇬🇧 UK | 0.1% | 0.5% |
| G7 | 🇩🇪 Germany | -0.3% | 0.2% |
| BRICS | 🇮🇳 India | 7.8% | 6.8% |
| BRICS | 🇨🇳 China | 5.2% | 4.6% |
| BRICS | 🇦🇪 UAE | 3.4% | 3.5% |
| BRICS | 🇮🇷 Iran | 4.7% | 3.3% |
| BRICS | 🇷🇺 Russia | 3.6% | 3.2% |
| BRICS | 🇪🇬 Egypt | 3.8% | 3.0% |
| BRICS-invited | 🇸🇦 Saudi Arabia | -0.8% | 2.6% |
| BRICS | 🇧🇷 Brazil | 2.9% | 2.2% |
| BRICS | 🇿🇦 South Africa | 0.6% | 0.9% |
| BRICS | 🇪🇹 Ethiopia | 7.2% | 6.2% |
| 🌍 World | 3.2% | 3.2% |
China and India are forecasted to maintain relatively high growth rates in 2024 at 4.6% and 6.8% respectively, but compared to the previous year, China is growing 0.6 percentage points slower while India is an entire percentage point slower.
On the other hand, four G7 nations are set to grow faster than last year, which includes Germany making its comeback from its negative real GDP growth of -0.3% in 2023.
Faster Growth for BRICS than G7 Nations
Despite mostly lower growth forecasts in 2024 compared to 2023, BRICS nations still have a significantly higher average growth forecast at 3.6% compared to the G7 average of 1%.
While the G7 countries’ combined GDP is around $15 trillion greater than the BRICS nations, with continued higher growth rates and the potential to add more members, BRICS looks likely to overtake the G7 in economic size within two decades.
BRICS Expansion Stutters Before October 2024 Summit
BRICS’ recent expansion has stuttered slightly, as Argentina’s newly-elected president Javier Milei declined its invitation and Saudi Arabia clarified that the country is still considering its invitation and has not joined BRICS yet.
Even with these initial growing pains, South Africa’s Foreign Minister Naledi Pandor told reporters in February that 34 different countries have submitted applications to join the growing BRICS bloc.
Any changes to the group are likely to be announced leading up to or at the 2024 BRICS summit which takes place October 22-24 in Kazan, Russia.
Get the Full Analysis of the IMF’s Outlook on VC+
This visual is part of an exclusive special dispatch for VC+ members which breaks down the key takeaways from the IMF’s 2024 World Economic Outlook.
For the full set of charts and analysis, sign up for VC+.

-

 Markets1 week ago
U.S. Debt Interest Payments Reach $1 Trillion
-

 Business2 weeks ago
Charted: Big Four Market Share by S&P 500 Audits
-

 Markets2 weeks ago
Ranked: The Most Valuable Housing Markets in America
-

 Money2 weeks ago
Which States Have the Highest Minimum Wage in America?
-

 AI2 weeks ago
Ranked: Semiconductor Companies by Industry Revenue Share
-

 Markets2 weeks ago
Ranked: The World’s Top Flight Routes, by Revenue
-

 Demographics2 weeks ago
Population Projections: The World’s 6 Largest Countries in 2075
-

 Markets2 weeks ago
The Top 10 States by Real GDP Growth in 2023