Water
Mapped: Countries With the Highest Flood Risk
![]() Subscribe to the Elements free mailing list for more like this
Subscribe to the Elements free mailing list for more like this
Risk of Flooding Mapped Around the World
This was originally posted on Elements. Sign up to the free mailing list to get beautiful visualizations on natural resource megatrends in your email every week.
Devastating floods across Pakistan this summer have resulted in more than 1,400 lives lost and one-third of the country being under water.
This raises the question: which nations and their populations are the most vulnerable to the risk of flooding around the world?
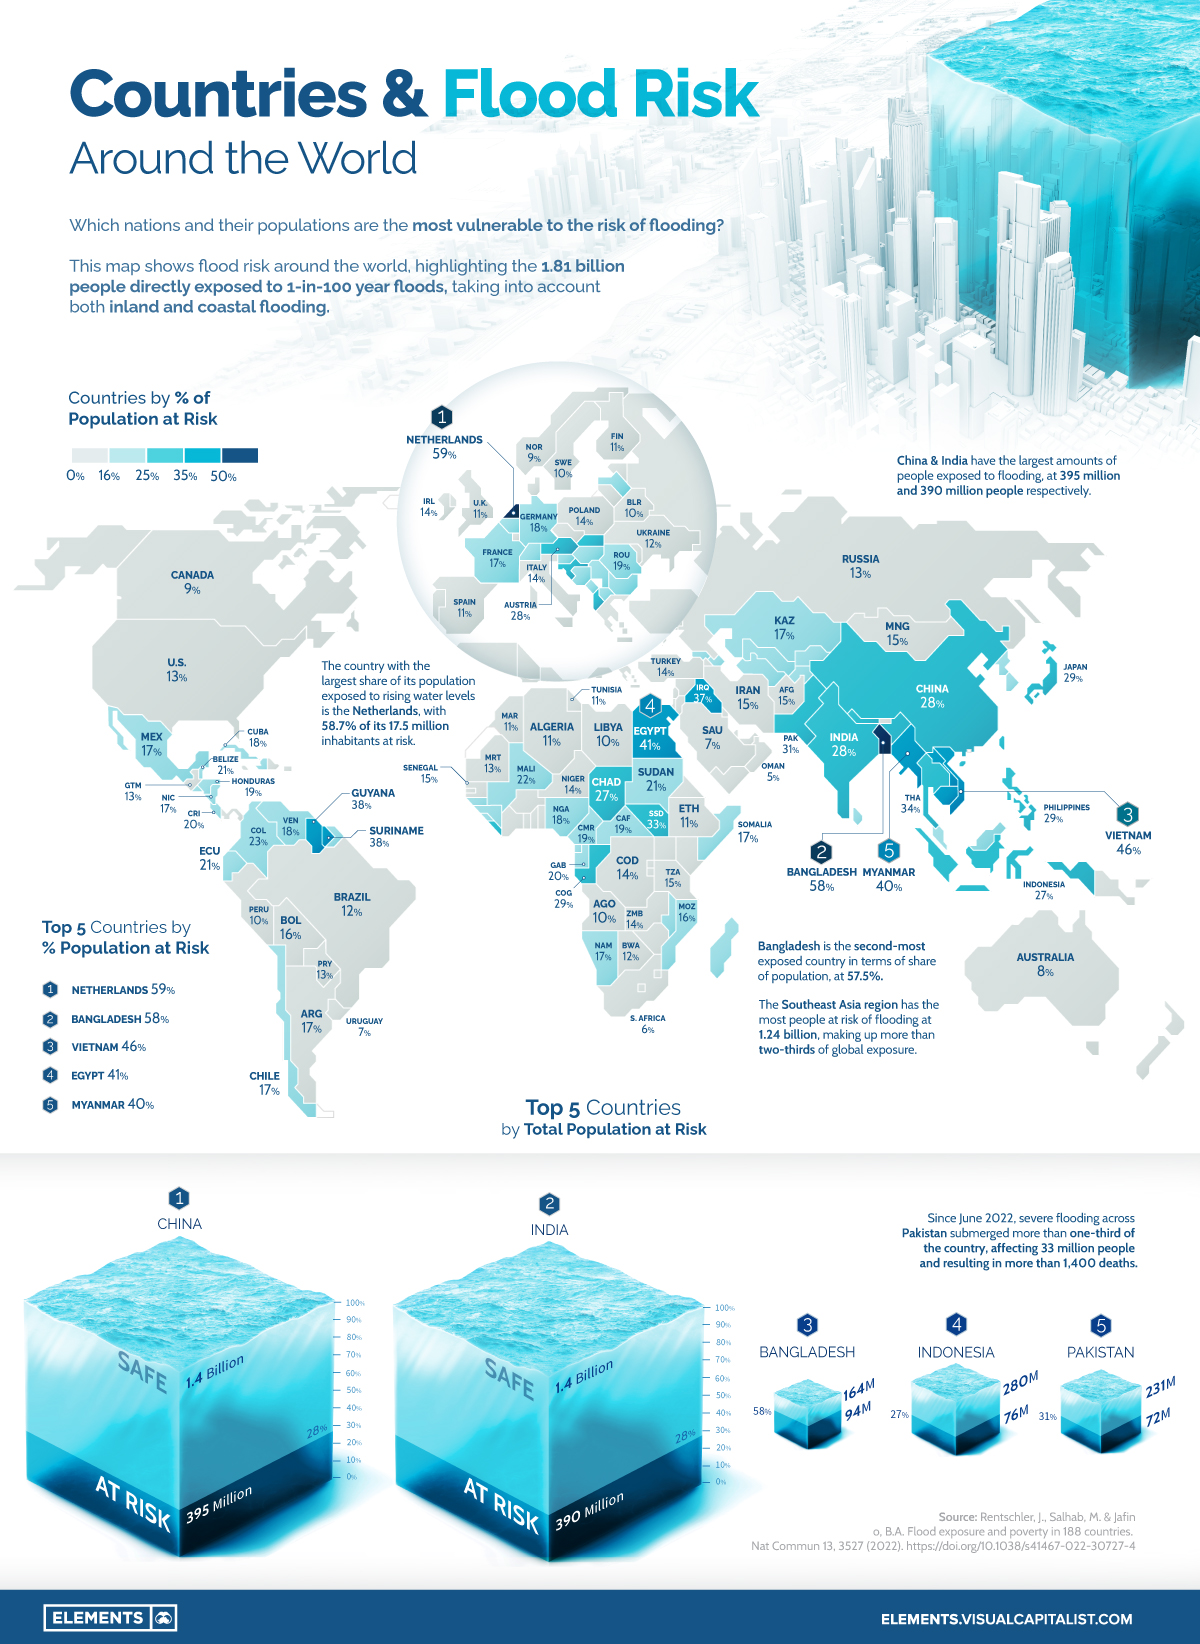
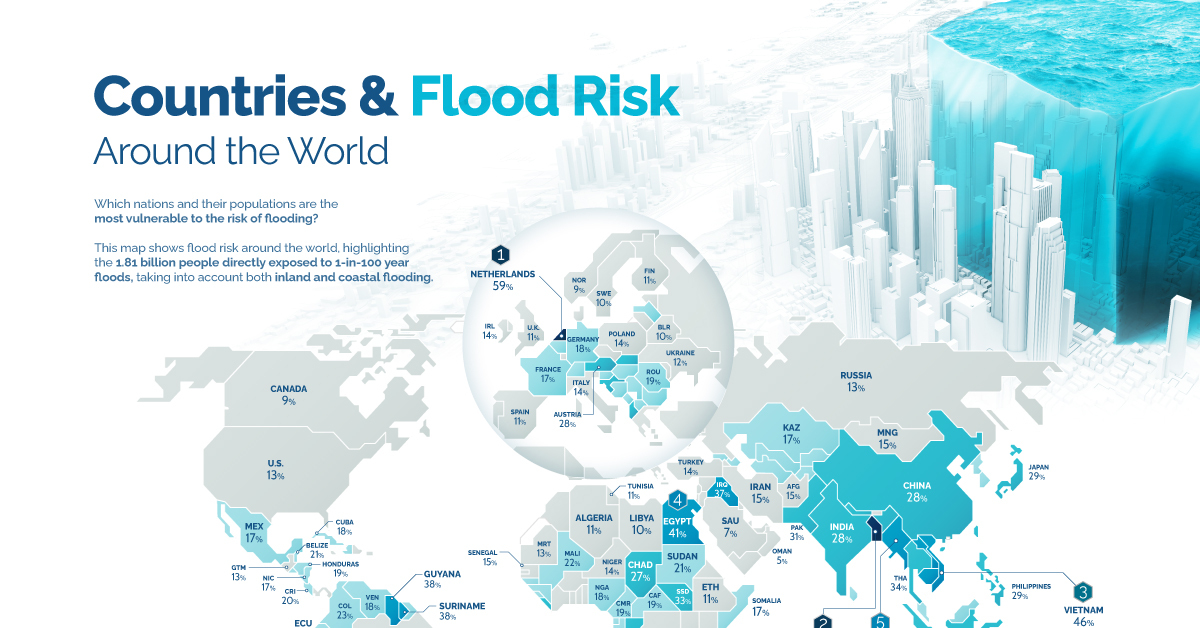
Using data from a recent study published in Nature, this graphic maps flood risk around the world, highlighting the 1.81 billion people directly exposed to 1-in-100 year floods. The methodology takes into account potential risks from both inland and coastal flooding.
Asian Countries Most at Risk from Rising Water Levels
Not surprisingly, countries with considerable coastlines, river systems, and flatlands find themselves with high percentages of their population at risk.
The Netherlands and Bangladesh are the only two nations in the world to have more than half of their population at risk due to flooding, at 59% and 58%, respectively. Vietnam (46%), Egypt (41%), and Myanmar (40%) round out the rest of the top five nations.
Besides the Netherlands, only two other European nations are in the top 20 nations by percentage of population at risk, Austria (18th at 29%) and Albania (20th at 28%).
| Rank | Country | Flood risk, by population exposed (%) | Total population exposed |
|---|---|---|---|
| #1 | 🇳🇱 Netherlands | 58.7% | 10,100,000 |
| #2 | 🇧🇩 Bangladesh | 57.5% | 94,424,000 |
| #3 | 🇻🇳 Vietnam | 46.0% | 45,504,000 |
| #4 | 🇪🇬 Egypt | 40.5% | 38,871,000 |
| #5 | 🇲🇲 Myanmar | 39.9% | 19,104,000 |
| #6 | 🇱🇦 Laos | 39.7% | 2,985,000 |
| #7 | 🇰🇭 Cambodia | 38.1% | 7,431,000 |
| #8 | 🇬🇾 Guyana | 37.9% | 276,000 |
| #9 | 🇸🇷 Suriname | 37.7% | 233,000 |
| #10 | 🇮🇶 Iraq | 36.8% | 16,350,000 |
| #11 | 🇹🇭 Thailand | 33.9% | 25,431,000 |
| #12 | 🇸🇸 South Sudan | 32.5% | 5,437,000 |
| #13 | 🇵🇰 Pakistan | 31.1% | 71,786,000 |
| #14 | 🇳🇵 Nepal | 29.4% | 11,993,000 |
| #15 | 🇨🇬 Republic of the Congo | 29.3% | 1,170,000 |
| #16 | 🇵🇭 Philippines | 29.0% | 30,483,000 |
| #17 | 🇯🇵 Japan | 28.7% | 36,060,000 |
| #18 | 🇦🇹 Austria | 27.8% | 2,437,000 |
| #19 | 🇮🇳 India | 27.7% | 389,816,000 |
| #20 | 🇦🇱 Albania | 27.6% | 771,000 |
| #21 | 🇨🇳 China | 27.5% | 394,826,000 |
| #22 | 🇹🇩 Chad | 27.4% | 4,547,000 |
| #23 | 🇮🇩 Indonesia | 27.0% | 75,696,000 |
| #24 | 🇭🇷 Croatia | 26.9% | 1,094,000 |
| #25 | 🇸🇰 Slovakia | 26.7% | 1,401,000 |
The Southeast Asia region alone makes up more than two-thirds of the global population exposed to flooding risk at 1.24 billion people.
China and India account for 395 million and 390 million people, respectively, with both nations at the top in terms of the absolute number of people at risk of rising water levels. The rest of the top five countries by total population at risk are Bangladesh (94 million people at risk), Indonesia (76 million people at risk), and Pakistan (72 million people at risk).
How Flooding is Already Affecting Countries Like Pakistan
While forecasted climate and natural disasters can often take years to manifest, flooding affected more than 100 million people in 2021. Recent summer floods in Pakistan have continued the trend in 2022.
With 31% of its population (72 million people) at risk of flooding, Pakistan is particularly vulnerable to floods.
In 2010, floods in Pakistan were estimated to have affected more than 18 million people. The recent floods, which started in June, are estimated to have affected more than 33 million people as more than one-third of the country is submerged underwater.
The Cost of Floods Today and in the Future
Although the rising human toll is by far the biggest concern that floods present, they also bring with them massive economic costs. Last year, droughts, floods, and storms caused economic losses totaling $224.2 billion worldwide, nearly doubling the 2001-2020 annual average of $117.8 billion.
A recent report forecasted that water risk (caused by droughts, floods, and storms) could eat up $5.6 trillion of global GDP by 2050, with floods projected to account for 36% of these direct losses.
As both human and economic losses caused by floods continue to mount, nations around the world will need to focus on preventative infrastructure and restorative solutions for ecosystems and communities already affected and most at risk of flooding.


Green
Visualizing All of the World’s Water
See all of the world’s water in one chart, as well as which regions will suffer the greatest from water scarcity.
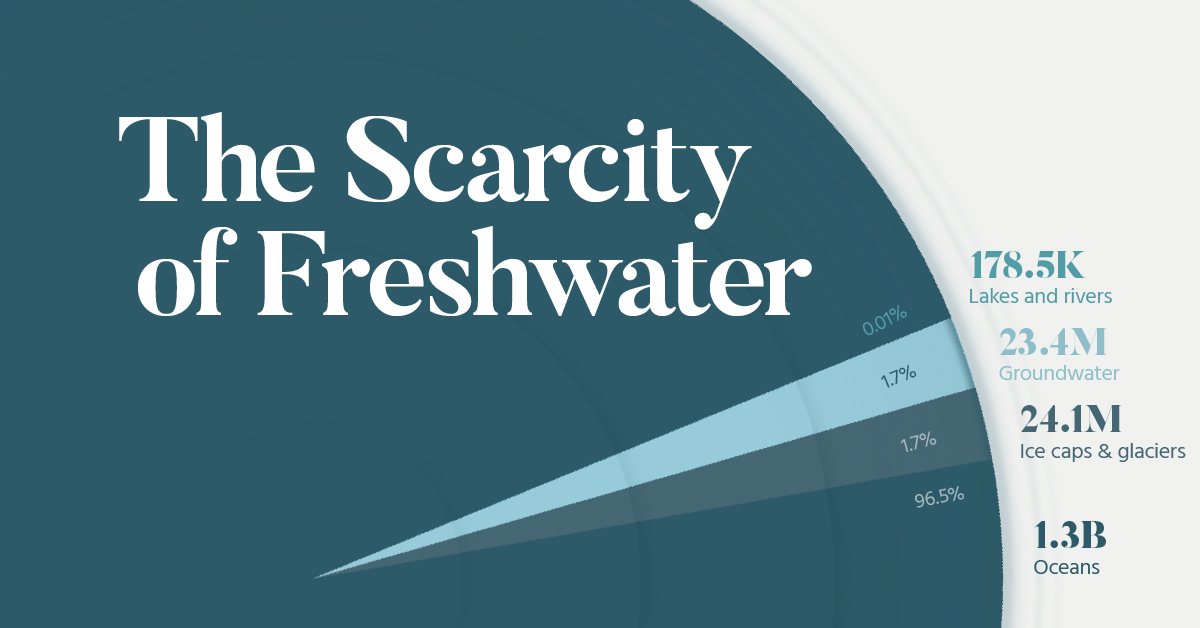
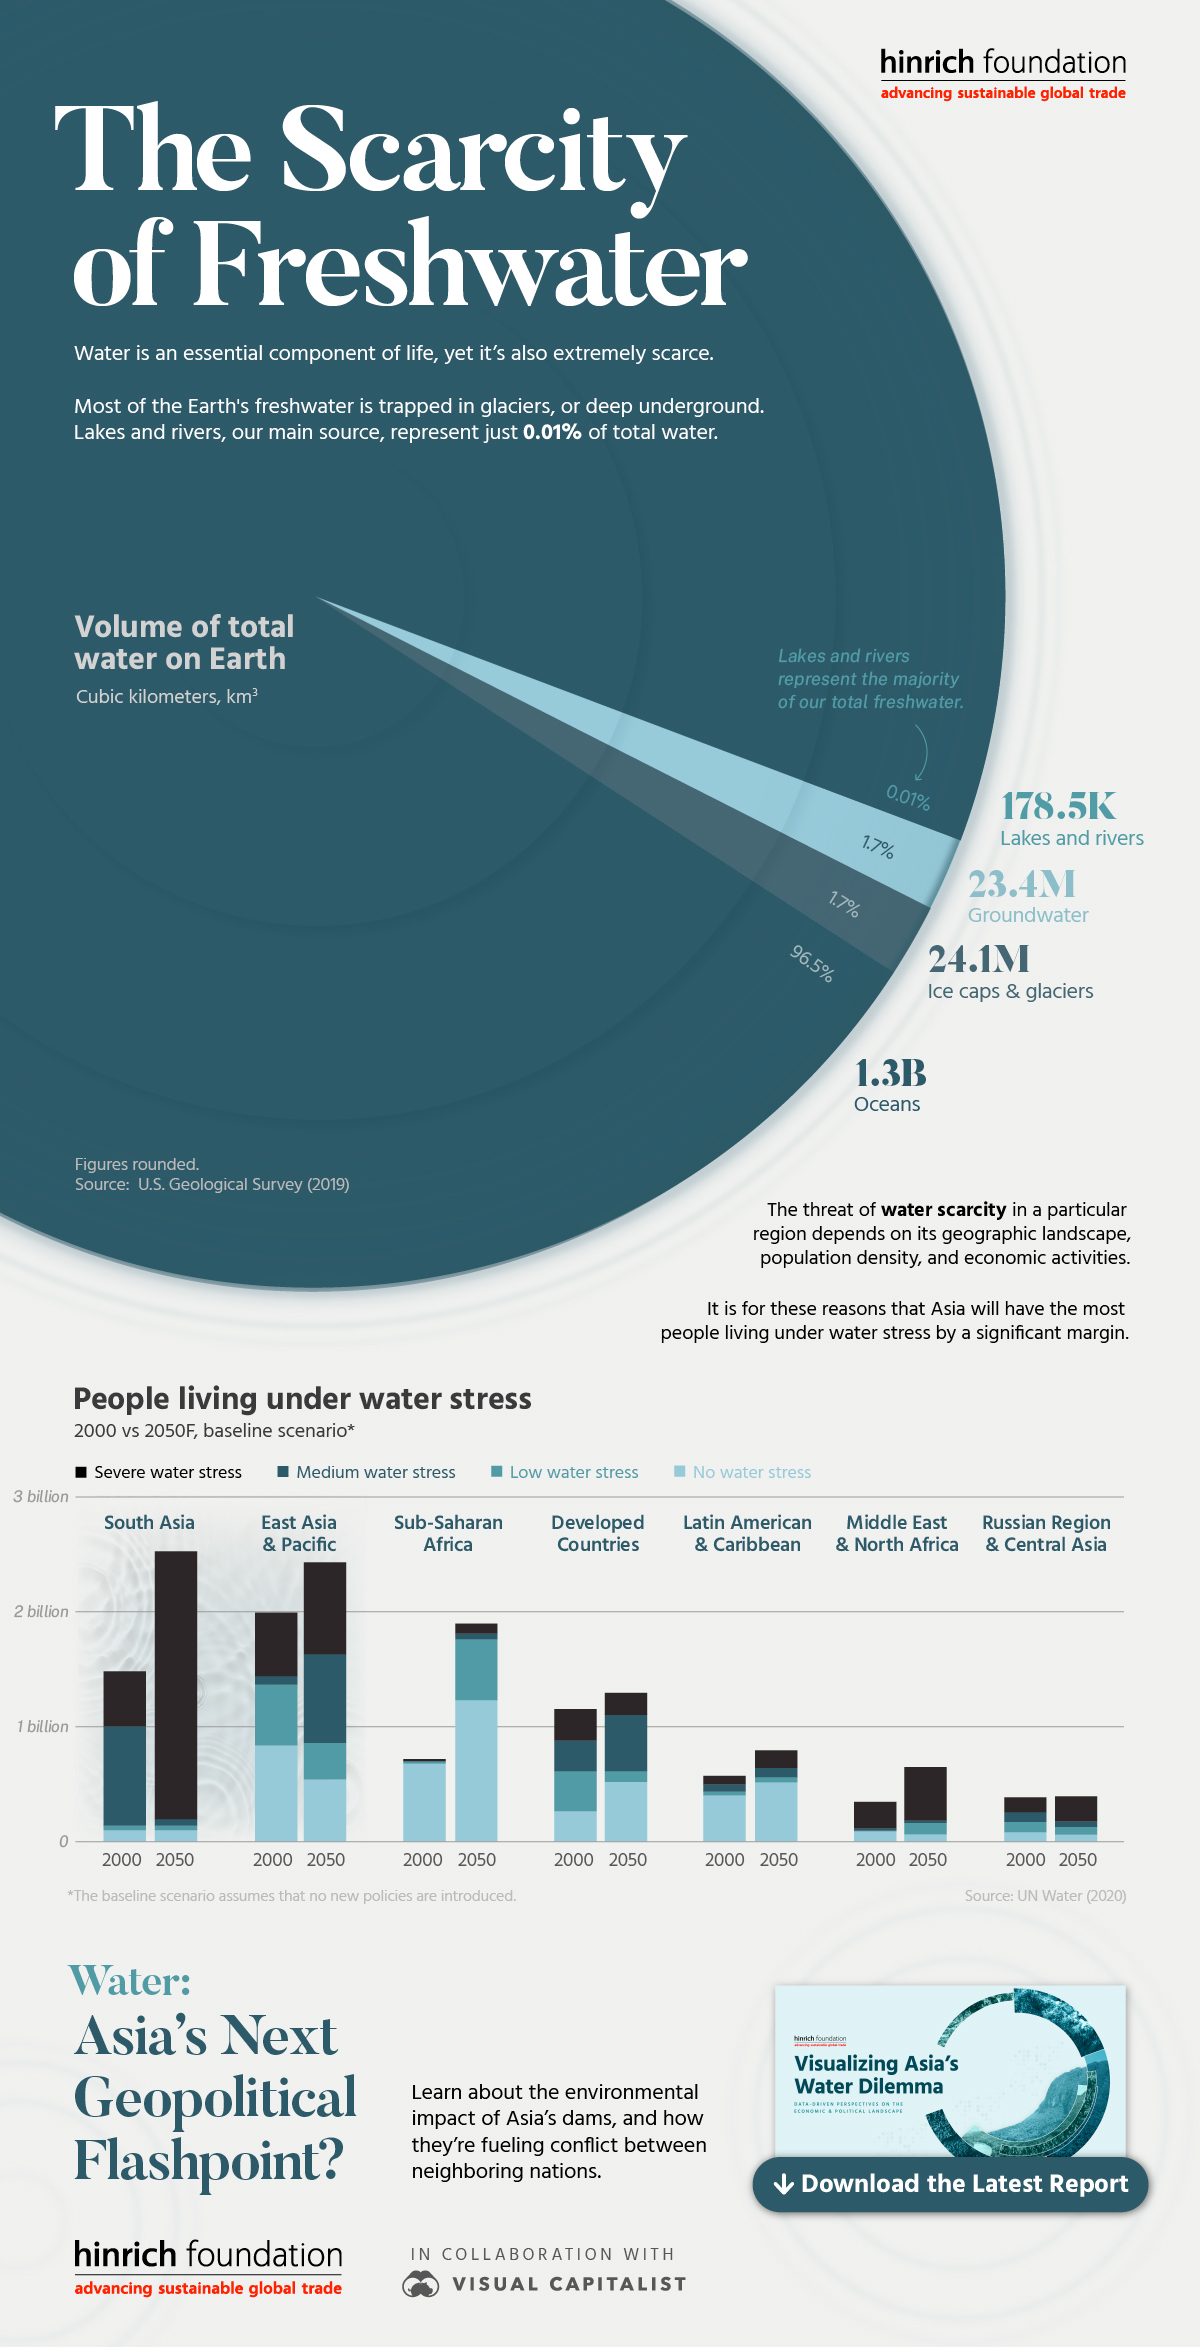
The Scarcity of Freshwater
Water is an essential component of life, enabling everything from food production to electricity generation. Given its ubiquity, it’s surprising to see how scarce water actually is.
For example, lakes and rivers supply the majority of our freshwater, yet they represent just 0.01% of the Earth’s total water resources.
This graphic from Hinrich Foundation introduces their latest free report, Visualizing Asia’s Water Dilemma, produced in partnership with Visual Capitalist.
This data-driven report provides a global overview of water scarcity, as well as a deep dive into the related geopolitical conflicts brewing throughout Asia.
The Total Volume of Water on Earth
The first visualization in this graphic breaks down all of the world’s water, based on estimates from the U.S. Geological Survey.
| Resource | Volume (cubic kilometers) | Percent of total water |
|---|---|---|
| Oceans | 1,338,000,000 | 96.5 |
| Ice caps & glaciers | 24,064,000 | 1.74 |
| Groundwater | 23,400,000 | 1.69 |
| Lakes and rivers | 178,520 | 0.01 |
When you consider the amount of water needed to produce everyday products, this isn’t very much at all. A smartphone, for example, has a water footprint of over 12,000 liters due to the pollutants from production that must be diluted.
To see a visual breakdown of the water footprint of everyday products, download the free report.
Asia Has the Most People Living Under Water Stress
The second visualization in this graphic outlines the UN’s forecasts for the number of people living under water stress by region, in 2000 and 2050.
Asia will lead by a very wide margin due to its geographic landscape, high population, and dense centers of economic activity.
Water: Asia’s Next Geopolitical Flashpoint?
Asia is home to a complex network of rivers that originate in the Tibetan Plateau, located within China’s borders. From there, these rivers deliver water to many of the world’s most populous countries, including India, Pakistan, and Vietnam.
This geographic reality, combined with unregulated dam building along major rivers, is leading to a growing number of disputes among neighboring countries.
For more analysis and infographics, download the free report Visualizing Asia’s Water Dilemma
-

 Green1 week ago
Ranking the Top 15 Countries by Carbon Tax Revenue
This graphic highlights France and Canada as the global leaders when it comes to generating carbon tax revenue.
-

 Green1 week ago
Ranked: The Countries With the Most Air Pollution in 2023
South Asian nations are the global hotspot for pollution. In this graphic, we rank the world’s most polluted countries according to IQAir.
-

 Environment2 weeks ago
Top Countries By Forest Growth Since 2001
One country is taking reforestation very seriously, registering more than 400,000 square km of forest growth in two decades.
-

 Green3 weeks ago
Ranked: Top Countries by Total Forest Loss Since 2001
The country with the most forest loss since 2001 lost as much forest cover as the next four countries combined.
-

 Markets2 months ago
The World’s Top Cocoa Producing Countries
Here are the largest cocoa producing countries globally—from Côte d’Ivoire to Brazil—as cocoa prices hit record highs.
-

 Environment2 months ago
Charted: Share of World Forests by Country
We visualize which countries have the biggest share of world forests by area—and while country size plays a factor, so too, does the environment.


-

 Markets1 week ago
U.S. Debt Interest Payments Reach $1 Trillion
-

 Markets2 weeks ago
Ranked: The Most Valuable Housing Markets in America
-

 Money2 weeks ago
Which States Have the Highest Minimum Wage in America?
-

 AI2 weeks ago
Ranked: Semiconductor Companies by Industry Revenue Share
-

 Markets2 weeks ago
Ranked: The World’s Top Flight Routes, by Revenue
-

 Countries2 weeks ago
Population Projections: The World’s 6 Largest Countries in 2075
-

 Markets2 weeks ago
The Top 10 States by Real GDP Growth in 2023
-

 Money2 weeks ago
The Smallest Gender Wage Gaps in OECD Countries