Education
Visualizing Countries by Share of Earth’s Surface


Visualizing Countries by Share of Earth’s Surface
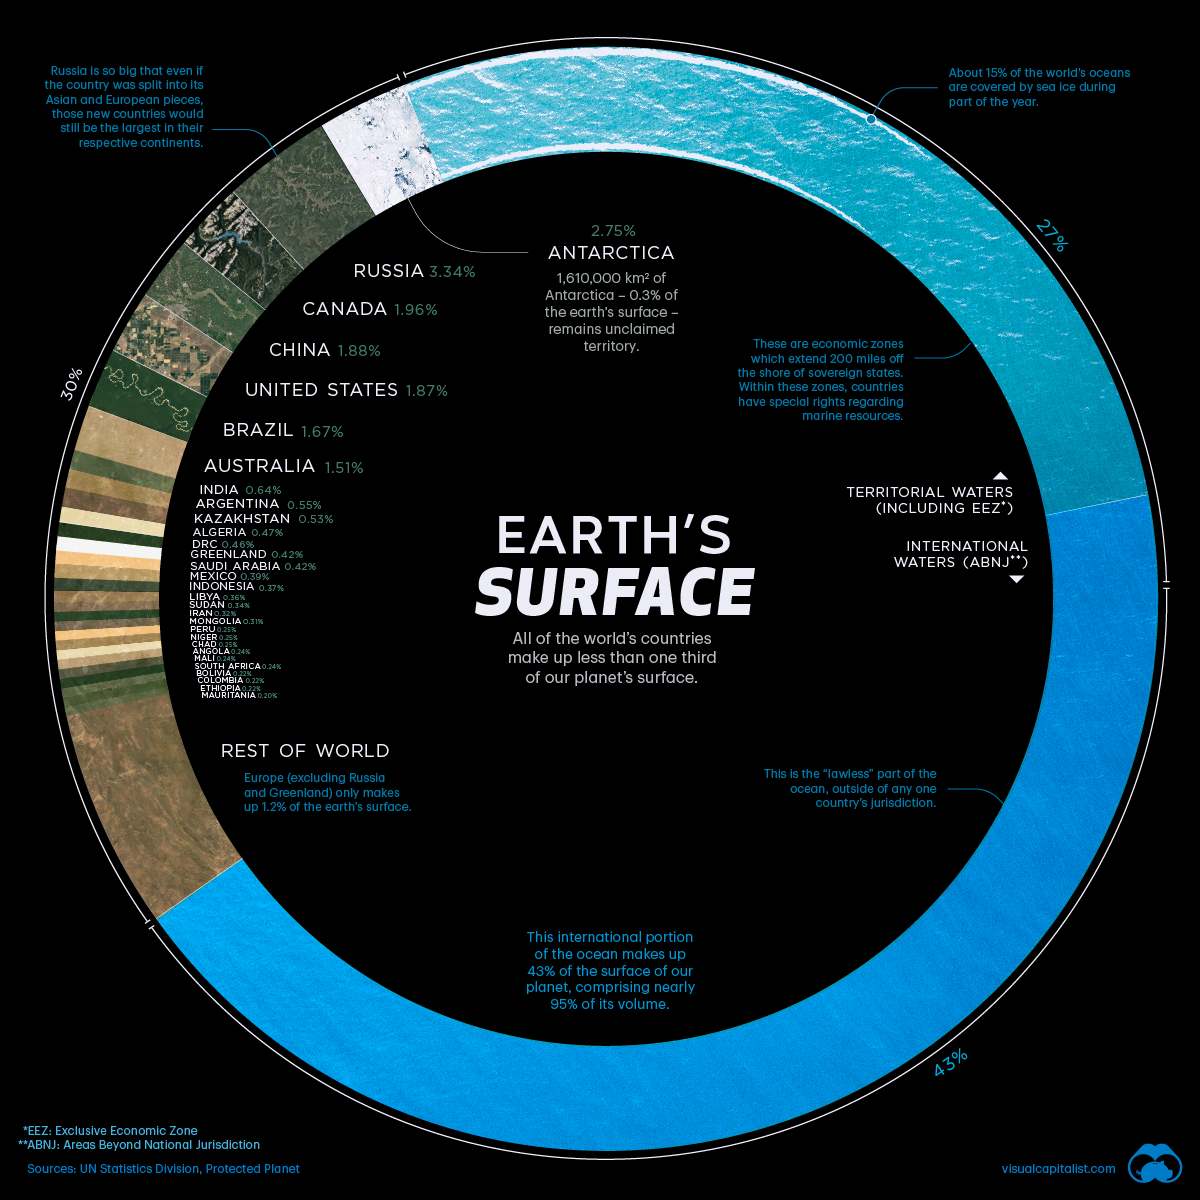
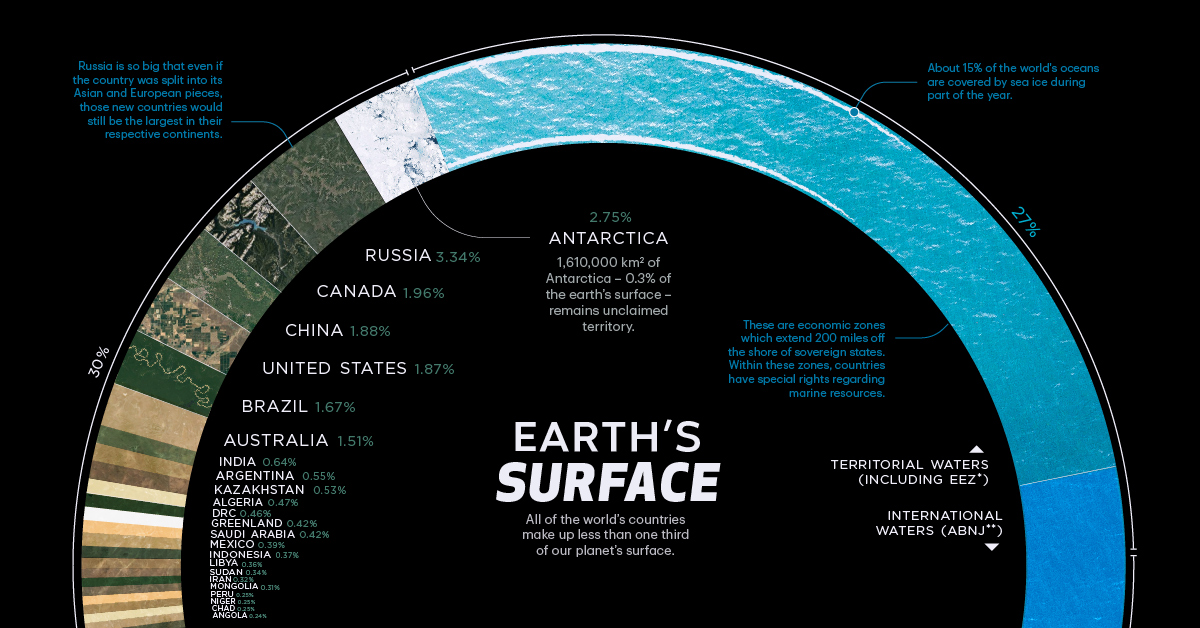
There are over 510 million square kilometers of area on the surface of Earth, but less than 30% of this is covered by land. The rest is water, in the form of vast oceans.
Today’s visualization uses data primarily from the United Nations Statistics Division (UNSD) to rank the world’s countries by their share of Earth’s surface.
Breakdown of Countries Share of Earth’s Surface
The largest countries by surface area are Russia (3.35%), Canada (1.96%), and China (1.88%).
Together they occupy roughly 7.2% of Earth’s surface. Russia is so big that even if we divided the country between its Asian and European sections, those new regions would still be the largest in their respective continents.
| Country / Dependency | Total in km² (mi²) | Percentage of Earth's Surface |
|---|---|---|
| Russia | 17,098,246 (6,601,670) | 3.352% |
| Antarctica | 14,000,000 (5,400,000) | 2.745% |
| Canada | 9,984,670 (3,855,100) | 1.958% |
| China | 9,596,961 (3,705,407) | 1.881% |
| United States | 9,525,067 (3,677,649) | 1.867% |
| Brazil | 8,515,767 (3,287,956) | 1.670% |
| Australia | 7,692,024 (2,969,907) | 1.508% |
| India | 3,287,263 (1,269,219) | 0.644% |
| Argentina | 2,780,400 (1,073,500) | 0.545% |
| Kazakhstan | 2,724,900 (1,052,100) | 0.534% |
| Algeria | 2,381,741 (919,595) | 0.467% |
| D.R. Congo | 2,344,858 (905,355) | 0.460% |
| Greenland (Denmark) | 2,166,086 (836,330) | 0.425% |
| Saudi Arabia | 2,149,690 (830,000) | 0.421% |
| Mexico | 1,964,375 (758,449) | 0.385% |
| Indonesia | 1,910,931 (737,815) | 0.375% |
| Sudan | 1,861,484 (718,723) | 0.365% |
| Libya | 1,759,540 (679,360) | 0.345% |
| Iran | 1,648,195 (636,372) | 0.323% |
| Mongolia | 1,564,110 (603,910) | 0.307% |
| Peru | 1,285,216 (496,225) | 0.252% |
| Chad | 1,284,000 (496,000) | 0.252% |
| Niger | 1,267,000 (489,000) | 0.248% |
| Angola | 1,246,700 (481,400) | 0.244% |
| Mali | 1,240,192 (478,841) | 0.243% |
| South Africa | 1,221,037 (471,445) | 0.239% |
| Colombia | 1,141,748 (440,831) | 0.224% |
| Ethiopia | 1,104,300 (426,400) | 0.216% |
| Bolivia | 1,098,581 (424,164) | 0.215% |
| Mauritania | 1,030,700 (398,000) | 0.202% |
| Egypt | 1,002,450 (387,050) | 0.197% |
| Tanzania | 945,087 (364,900) | 0.185% |
| Nigeria | 923,768 (356,669) | 0.181% |
| Venezuela | 916,445 (353,841) | 0.180% |
| Pakistan | 907,843 (350,520) | 0.178% |
| Namibia | 825,615 (318,772) | 0.162% |
| Mozambique | 801,590 (309,500) | 0.157% |
| Turkey | 783,562 (302,535) | 0.154% |
| Chile | 756,102 (291,933) | 0.148% |
| Zambia | 752,612 (290,585) | 0.148% |
| Myanmar | 676,578 (261,228) | 0.133% |
| Afghanistan | 652,230 (251,830) | 0.128% |
| South Sudan | 644,329 (248,777) | 0.126% |
| Somalia | 637,657 (246,201) | 0.125% |
| Central African Republic | 622,984 (240,535) | 0.122% |
| Ukraine | 603,500 (233,000) | 0.118% |
| Madagascar | 587,041 (226,658) | 0.115% |
| Botswana | 581,730 (224,610) | 0.114% |
| Kenya | 580,367 (224,081) | 0.114% |
| France | 543,940 (210,020) | 0.107% |
| Yemen | 527,968 (203,850) | 0.104% |
| Thailand | 513,120 (198,120) | 0.101% |
| Spain | 505,992 (195,365) | 0.099% |
| Turkmenistan | 488,100 (188,500) | 0.096% |
| Cameroon | 475,442 (183,569) | 0.093% |
| Papua New Guinea | 462,840 (178,700) | 0.091% |
| Sweden | 450,295 (173,860) | 0.088% |
| Uzbekistan | 447,400 (172,700) | 0.088% |
| Morocco | 446,550 (172,410) | 0.088% |
| Iraq | 438,317 (169,235) | 0.086% |
| Paraguay | 406,752 (157,048) | 0.080% |
| Zimbabwe | 390,757 (150,872) | 0.077% |
| Norway | 385,207 (148,729) | 0.076% |
| Japan | 377,976 (145,937) | 0.074% |
| Germany | 357,114 (137,882) | 0.070% |
| Republic of the Congo | 342,000 (132,000) | 0.067% |
| Finland | 338,424 (130,666) | 0.066% |
| Vietnam | 331,212 (127,882) | 0.065% |
| Malaysia | 330,803 (127,724) | 0.065% |
| Ivory Coast | 322,463 (124,504) | 0.063% |
| Poland | 312,696 (120,733) | 0.061% |
| Oman | 309,500 (119,500) | 0.061% |
| Italy | 301,339 (116,348) | 0.059% |
| Philippines | 300,000 (120,000) | 0.059% |
| Ecuador | 276,841 (106,889) | 0.054% |
| Burkina Faso | 274,222 (105,878) | 0.054% |
| New Zealand | 270,467 (104,428) | 0.053% |
| Gabon | 267,668 (103,347) | 0.052% |
| Guinea | 245,857 (94,926) | 0.048% |
| United Kingdom | 242,495 (93,628) | 0.048% |
| Uganda | 241,550 (93,260) | 0.047% |
| Ghana | 238,533 (92,098) | 0.047% |
| Romania | 238,397 (92,046) | 0.047% |
| Laos | 236,800 (91,400) | 0.046% |
| Guyana | 214,969 (83,000) | 0.042% |
| Belarus | 207,600 (80,200) | 0.041% |
| Kyrgyzstan | 199,951 (77,202) | 0.039% |
| Senegal | 196,722 (75,955) | 0.039% |
| Syria | 185,180 (71,500) | 0.036% |
| Cambodia | 181,035 (69,898) | 0.035% |
| Uruguay | 176,215 (68,037) | 0.035% |
| Somaliland | 176,120 (68,000) | 0.035% |
| Suriname | 163,820 (63,250) | 0.032% |
| Tunisia | 163,610 (63,170) | 0.032% |
| Bangladesh | 148,460 (57,320) | 0.029% |
| Nepal | 147,181 (56,827) | 0.029% |
| Tajikistan | 143,100 (55,300) | 0.028% |
| Greece | 131,957 (50,949) | 0.026% |
| Nicaragua | 130,373 (50,337) | 0.026% |
| North Korea | 120,540 (46,540) | 0.024% |
| Malawi | 118,484 (45,747) | 0.023% |
| Eritrea | 117,600 (45,400) | 0.023% |
| Benin | 114,763 (44,310) | 0.022% |
| Honduras | 112,492 (43,433) | 0.022% |
| Liberia | 111,369 (43,000) | 0.022% |
| Bulgaria | 111,002 (42,858) | 0.022% |
| Cuba | 109,884 (42,426) | 0.022% |
| Guatemala | 108,889 (42,042) | 0.021% |
| Iceland | 103,000 (40,000) | 0.020% |
| South Korea | 100,210 (38,690) | 0.020% |
| Hungary | 93,028 (35,918) | 0.018% |
| Portugal | 92,226 (35,609) | 0.018% |
| Jordan | 89,342 (34,495) | 0.018% |
| Serbia | 88,361 (34,116) | 0.017% |
| Azerbaijan | 86,600 (33,400) | 0.017% |
| Austria | 83,871 (32,383) | 0.016% |
| United Arab Emirates | 83,600 (32,300) | 0.016% |
| Czech Republic | 78,865 (30,450) | 0.015% |
| Panama | 75,417 (29,119) | 0.015% |
| Sierra Leone | 71,740 (27,700) | 0.014% |
| Ireland | 70,273 (27,133) | 0.014% |
| Georgia | 69,700 (26,900) | 0.014% |
| Sri Lanka | 65,610 (25,330) | 0.013% |
| Lithuania | 65,300 (25,200) | 0.013% |
| Latvia | 64,559 (24,926) | 0.013% |
| Togo | 56,785 (21,925) | 0.011% |
| Croatia | 56,594 (21,851) | 0.011% |
| Bosnia and Herzegovina | 51,209 (19,772) | 0.010% |
| Costa Rica | 51,100 (19,700) | 0.010% |
| Slovakia | 49,037 (18,933) | 0.010% |
| Dominican Republic | 48,671 (18,792) | 0.010% |
| Estonia | 45,227 (17,462) | 0.009% |
| Denmark | 43,094 (16,639) | 0.008% |
| Netherlands | 41,850 (16,160) | 0.008% |
| Switzerland | 41,284 (15,940) | 0.008% |
| Bhutan | 38,394 (14,824) | 0.008% |
| Taiwan | 36,193 (13,974) | 0.007% |
| Guinea-Bissau | 36,125 (13,948) | 0.007% |
| Moldova | 33,846 (13,068) | 0.007% |
| Belgium | 30,528 (11,787) | 0.006% |
| Lesotho | 30,355 (11,720) | 0.006% |
| Armenia | 29,743 (11,484) | 0.006% |
| Solomon Islands | 28,896 (11,157) | 0.006% |
| Albania | 28,748 (11,100) | 0.006% |
| Equatorial Guinea | 28,051 (10,831) | 0.005% |
| Burundi | 27,834 (10,747) | 0.005% |
| Haiti | 27,750 (10,710) | 0.005% |
| Rwanda | 26,338 (10,169) | 0.005% |
| North Macedonia | 25,713 (9,928) | 0.005% |
| Djibouti | 23,200 (9,000) | 0.005% |
| Belize | 22,966 (8,867) | 0.005% |
| El Salvador | 21,041 (8,124) | 0.004% |
| Israel | 20,770 (8,020) | 0.004% |
| Slovenia | 20,273 (7,827) | 0.004% |
| Fiji | 18,272 (7,055) | 0.004% |
| Kuwait | 17,818 (6,880) | 0.003% |
| Eswatini | 17,364 (6,704) | 0.003% |
| East Timor | 14,919 (5,760) | 0.003% |
| The Bahamas | 13,943 (5,383) | 0.003% |
| Montenegro | 13,812 (5,333) | 0.003% |
| Vanuatu | 12,189 (4,706) | 0.002% |
| Qatar | 11,586 (4,473) | 0.002% |
| The Gambia | 11,295 (4,361) | 0.002% |
| Jamaica | 10,991 (4,244) | 0.002% |
| Kosovo | 10,887 (4,203) | 0.002% |
| Lebanon | 10,452 (4,036) | 0.002% |
| Cyprus | 9,251 (3,572) | 0.002% |
| State of Palestine | 6,020 (2,320) | 0.001% |
| Brunei | 5,765 (2,226) | 0.001% |
| Trinidad and Tobago | 5,130 (1,980) | 0.001% |
| Cape Verde | 4,033 (1,557) | 0.001% |
| Samoa | 2,842 (1,097) | 0.001% |
| Luxembourg | 2,586 (998) | 0.001% |
| Mauritius | 2,040 (790) | 0.000% |
| Comoros | 1,862 (719) | 0.000% |
| São Tomé and Príncipe | 964 (372) | 0.000% |
| Kiribati | 811 (313) | 0.000% |
| Bahrain | 778 (300) | 0.000% |
| Dominica | 751 (290) | 0.000% |
| Tonga | 747 (288) | 0.000% |
| Singapore | 728 (281) | 0.000% |
| Federated States of Micronesia | 702 (271) | 0.000% |
| Saint Lucia | 616 (238) | 0.000% |
| Andorra | 468 (181) | 0.000% |
| Palau | 459 (177) | 0.000% |
| Seychelles | 452 (175) | 0.000% |
| Antigua and Barbuda | 442 (171) | 0.000% |
| Barbados | 430 (170) | 0.000% |
| Saint Vincent and the Grenadines | 389 (150) | 0.000% |
| Grenada | 344 (133) | 0.000% |
| Malta | 316 (122) | 0.000% |
| Maldives | 300 (120) | 0.000% |
| Saint Kitts and Nevis | 261 (101) | 0.000% |
| Marshall Islands | 181 (70) | 0.000% |
| Liechtenstein | 160 (62) | 0.000% |
| San Marino | 61 (24) | 0.000% |
| Tuvalu | 26 (10) | 0.000% |
| Nauru | 21 (8.1) | 0.000% |
| Monaco | 2.02 (0.78) | 0.000% |
| Vatican City | 0.49 (0.19) | 0.000% |
Antarctica, although not a country, covers the second largest amount of land overall at 2.75%. Meanwhile, the other nations that surpass the 1% mark for surface area include the United States (1.87%), Brazil (1.67%), and Australia (1.51%).
The remaining 195 countries and regions below 1%, combined, account for the other half of Earth’s land surface. Among the world’s smallest countries are the island nations of the Caribbean and the South Pacific Ocean. However, the tiniest of the tiny are Vatican City and Monaco, which combine for a total area of just 2.51 km².
The remaining 70% of Earth’s surface is water: 27% territorial waters and 43% international waters or areas beyond national jurisdiction.
Areas Beyond National Jurisdiction
In the past, nations adhered to the freedom-of-the-seas doctrine, a 17th century principle that limited jurisdiction over the oceans to a narrow area along a nation’s coastline. The rest of the seas did not belong to any nation and were free for countries to travel and exploit.
This situation lasted into the 20th century, but by mid-century there was an effort to extend national claims as competition for offshore resources became increasingly fierce and ocean pollution became an issue.
In 1982, the United Nations adopted the Law of the Sea Convention which extended international law over the extra-territorial waters. The convention established freedom-of-navigation rights and set territorial sea boundaries 12 miles (19 km) offshore with exclusive economic zones up to 200 miles (322 km) offshore, extending a country’s influence over maritime resources.
Does Size Matter?
The size of countries is the outcome of politics, economics, history, and geography. Put simply, borders can change over time.
In 1946, there were 76 independent countries in the world, and today there are 195. There are forces that push together or pull apart landscapes over time. While physical geography plays a role in the identity of nations, Sheikh Zayed bin Sultan Al Nahyan, the former ruler of UAE, a tiny Gulf nation, put it best:
“A country is not measured by the size of its area on the map. A country is truly measured by its heritage and culture.”


Misc
How Hard Is It to Get Into an Ivy League School?
We detail the admission rates and average annual cost for Ivy League schools, as well as the median SAT scores required to be accepted.


How Hard Is It to Get Into an Ivy League School?
This was originally posted on our Voronoi app. Download the app for free on iOS or Android and discover incredible data-driven charts from a variety of trusted sources.
Ivy League institutions are renowned worldwide for their academic excellence and long-standing traditions. But how hard is it to get into one of the top universities in the U.S.?
In this graphic, we detail the admission rates and average annual cost for Ivy League schools, as well as the median SAT scores required to be accepted. The data comes from the National Center for Education Statistics and was compiled by 24/7 Wall St.
Note that “average annual cost” represents the net price a student pays after subtracting the average value of grants and/or scholarships received.
Harvard is the Most Selective
The SAT is a standardized test commonly used for college admissions in the United States. It’s taken by high school juniors and seniors to assess their readiness for college-level academic work.
When comparing SAT scores, Harvard and Dartmouth are among the most challenging universities to gain admission to. The median SAT scores for their students are 760 for reading and writing and 790 for math. Still, Harvard has half the admission rate (3.2%) compared to Dartmouth (6.4%).
| School | Admission rate (%) | SAT Score: Reading & Writing | SAT Score: Math | Avg Annual Cost* |
|---|---|---|---|---|
| Harvard University | 3.2 | 760 | 790 | $13,259 |
| Columbia University | 3.9 | 750 | 780 | $12,836 |
| Yale University | 4.6 | 760 | 780 | $16,341 |
| Brown University | 5.1 | 760 | 780 | $26,308 |
| Princeton University | 5.7 | 760 | 780 | $11,080 |
| Dartmouth College | 6.4 | 760 | 790 | $33,023 |
| University of Pennsylvania | 6.5 | 750 | 790 | $14,851 |
| Cornell University | 7.5 | 750 | 780 | $29,011 |
*Costs after receiving federal financial aid.
Additionally, Dartmouth has the highest average annual cost at $33,000. Princeton has the lowest at $11,100.
While student debt has surged in the United States in recent years, hitting $1.73 trillion in 2023, the worth of obtaining a degree from any of the schools listed surpasses mere academics. This is evidenced by the substantial incomes earned by former students.
Harvard grads, for example, have the highest average starting salary in the country, at $91,700.

-

 Mining1 week ago
Gold vs. S&P 500: Which Has Grown More Over Five Years?
-

 Markets2 weeks ago
Ranked: The Most Valuable Housing Markets in America
-

 Money2 weeks ago
Which States Have the Highest Minimum Wage in America?
-

 AI2 weeks ago
Ranked: Semiconductor Companies by Industry Revenue Share
-

 Markets2 weeks ago
Ranked: The World’s Top Flight Routes, by Revenue
-

 Countries2 weeks ago
Population Projections: The World’s 6 Largest Countries in 2075
-

 Markets2 weeks ago
The Top 10 States by Real GDP Growth in 2023
-

 Demographics2 weeks ago
The Smallest Gender Wage Gaps in OECD Countries