Misc
The Cost of Living Around the World

The Cost of Living Around the World
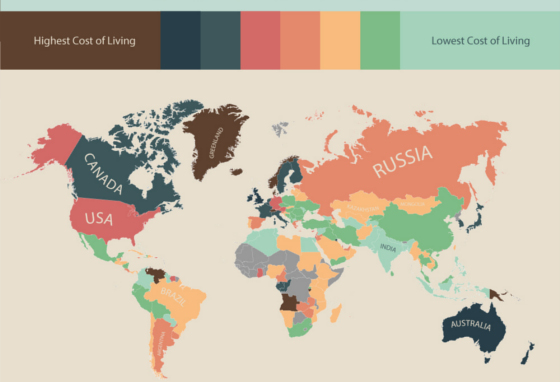
Imagine that users submitted hundreds of thousands of prices for everyday items, and that they all got compiled into a massive database. Then, suppose a worldwide index of prices was created that compared the cost of living across different places by using these many data points.
Well, that’s already happened at Numbeo which is the world’s largest database of user contributed data about cities and countries.
This infographic uses this information to show the most expensive and cheapest places to live by country. While it is missing some of the granularity of looking closer at individual regions and cities, it does do a good job of showing a broad perspective on living costs.
Switzerland and Norway may not surprise you as two of the most expensive countries. However, Venezuela might not have been a place that was on your radar. Of course, in retrospect, when you have inflation spiraling out of control at a rate of 64% per year, that will make things a bit pricey.
Want cheap goods and services? Head over to India, Nepal, and Pakistan. With about 1.5 billion people spread between those three countries, labour is cheap and the cost of living is very low.
Original graphic from: Movehub


Misc
How Hard Is It to Get Into an Ivy League School?
We detail the admission rates and average annual cost for Ivy League schools, as well as the median SAT scores required to be accepted.


How Hard Is It to Get Into an Ivy League School?
This was originally posted on our Voronoi app. Download the app for free on iOS or Android and discover incredible data-driven charts from a variety of trusted sources.
Ivy League institutions are renowned worldwide for their academic excellence and long-standing traditions. But how hard is it to get into one of the top universities in the U.S.?
In this graphic, we detail the admission rates and average annual cost for Ivy League schools, as well as the median SAT scores required to be accepted. The data comes from the National Center for Education Statistics and was compiled by 24/7 Wall St.
Note that “average annual cost” represents the net price a student pays after subtracting the average value of grants and/or scholarships received.
Harvard is the Most Selective
The SAT is a standardized test commonly used for college admissions in the United States. It’s taken by high school juniors and seniors to assess their readiness for college-level academic work.
When comparing SAT scores, Harvard and Dartmouth are among the most challenging universities to gain admission to. The median SAT scores for their students are 760 for reading and writing and 790 for math. Still, Harvard has half the admission rate (3.2%) compared to Dartmouth (6.4%).
| School | Admission rate (%) | SAT Score: Reading & Writing | SAT Score: Math | Avg Annual Cost* |
|---|---|---|---|---|
| Harvard University | 3.2 | 760 | 790 | $13,259 |
| Columbia University | 3.9 | 750 | 780 | $12,836 |
| Yale University | 4.6 | 760 | 780 | $16,341 |
| Brown University | 5.1 | 760 | 780 | $26,308 |
| Princeton University | 5.7 | 760 | 780 | $11,080 |
| Dartmouth College | 6.4 | 760 | 790 | $33,023 |
| University of Pennsylvania | 6.5 | 750 | 790 | $14,851 |
| Cornell University | 7.5 | 750 | 780 | $29,011 |
*Costs after receiving federal financial aid.
Additionally, Dartmouth has the highest average annual cost at $33,000. Princeton has the lowest at $11,100.
While student debt has surged in the United States in recent years, hitting $1.73 trillion in 2023, the worth of obtaining a degree from any of the schools listed surpasses mere academics. This is evidenced by the substantial incomes earned by former students.
Harvard grads, for example, have the highest average starting salary in the country, at $91,700.

-

 Green2 weeks ago
Ranked: Top Countries by Total Forest Loss Since 2001
-

 Travel1 week ago
Ranked: The World’s Top Flight Routes, by Revenue
-

 Technology1 week ago
Ranked: Semiconductor Companies by Industry Revenue Share
-

 Money2 weeks ago
Which States Have the Highest Minimum Wage in America?
-

 Real Estate2 weeks ago
Ranked: The Most Valuable Housing Markets in America
-

 Markets2 weeks ago
Charted: Big Four Market Share by S&P 500 Audits
-

 AI2 weeks ago
The Stock Performance of U.S. Chipmakers So Far in 2024
-

 Automotive2 weeks ago
Almost Every EV Stock is Down After Q1 2024