Green
The Emissions Impact of Coronavirus Lockdowns, As Shown by Satellites
The Emissions Impact of Coronavirus Lockdowns
There’s a high chance you’re reading this while practicing social distancing, or while your corner of the world is under some type of advised or enforced lockdown.
While these are necessary measures to contain the spread of the COVID-19 pandemic, such economic interruption is unprecedented in many ways—resulting in some surprising side effects.
The Evidence is in NO₂ Emissions
Nitrogen dioxide (NO₂) emissions, a major air pollutant, are closely linked to factory output and vehicles operating on the road.
As both industry and transport come to a halt during this pandemic, NO₂ emissions can be a good indicator of global economic activity—and the changes are visible from space.
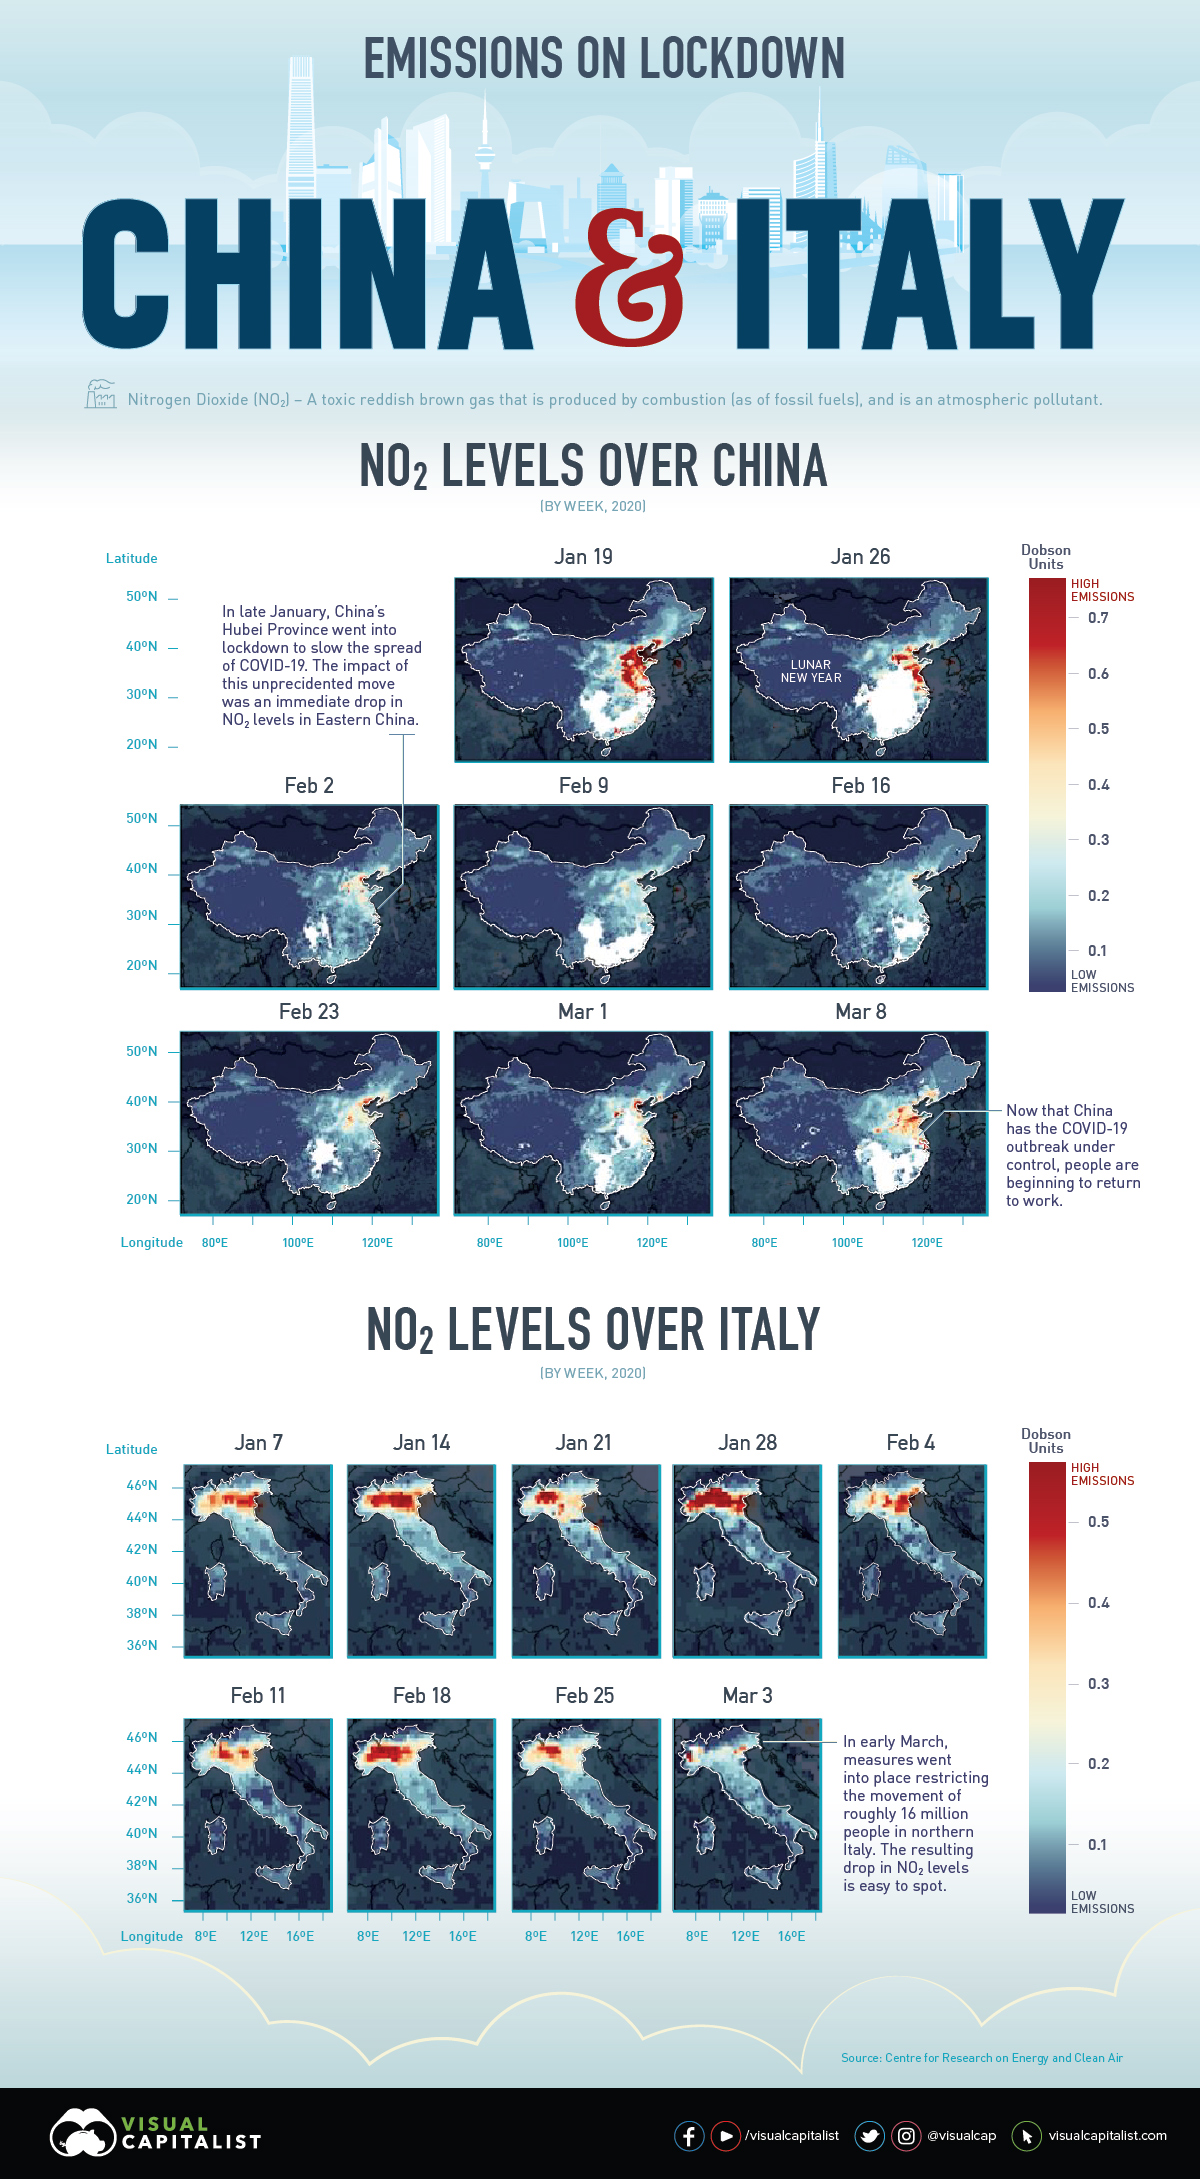
These images from the Centre for Research on Energy and Clean Air (CREA), as well as satellite footage from NASA and the European Space Agency (ESA), show a drastic decline in NO₂ emissions over recent months, particularly across Italy and China.
NO₂ Emissions Across Italy
In Italy, the number of active COVID-19 cases has surpassed China (including the death toll). Amid emergency actions to lock down the entire nation, everything from schools and shops, to restaurants and even some churches, are closed.
Italy is also an industrial hub, with the sector accounting for nearly 24% of GDP. With many Italians urged to work from home if possible, visible economic activity has dropped considerably.
This 10-day moving average animation (from January 1st—March 11th, 2020) of nitrogen dioxide emissions across Europe clearly demonstrates how the drop in Italy’s economic activity has impacted the environment.
Source: European Space Agency (ESA)
That’s not all: a drop in boat traffic also means that Venice’s canals are clear for the time being, as small fish have begun inhabiting the waterways again. Experts are cautious to note that this does not necessarily mean the water quality is better.
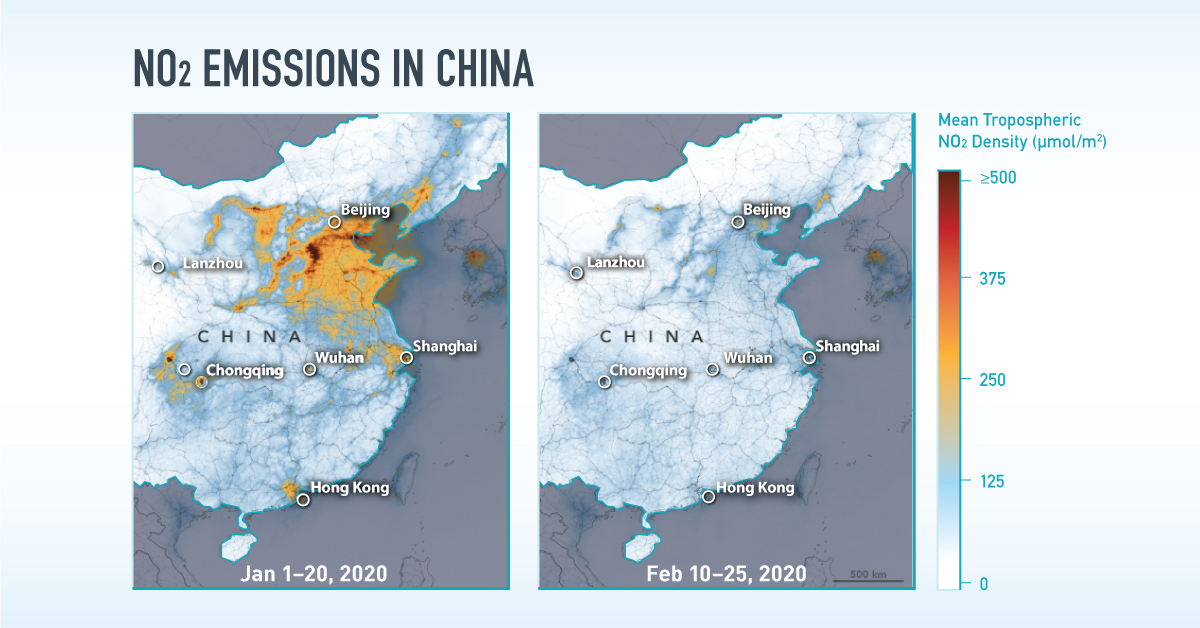
NO₂ Emissions Across China
The emissions changes above China are possibly even more obvious to the eye. China is the world’s most important manufacturing hub and a significant contributor to greenhouse gases globally. But in the month following Lunar New Year (a week-long festival in early February), satellite imagery painted a different picture.
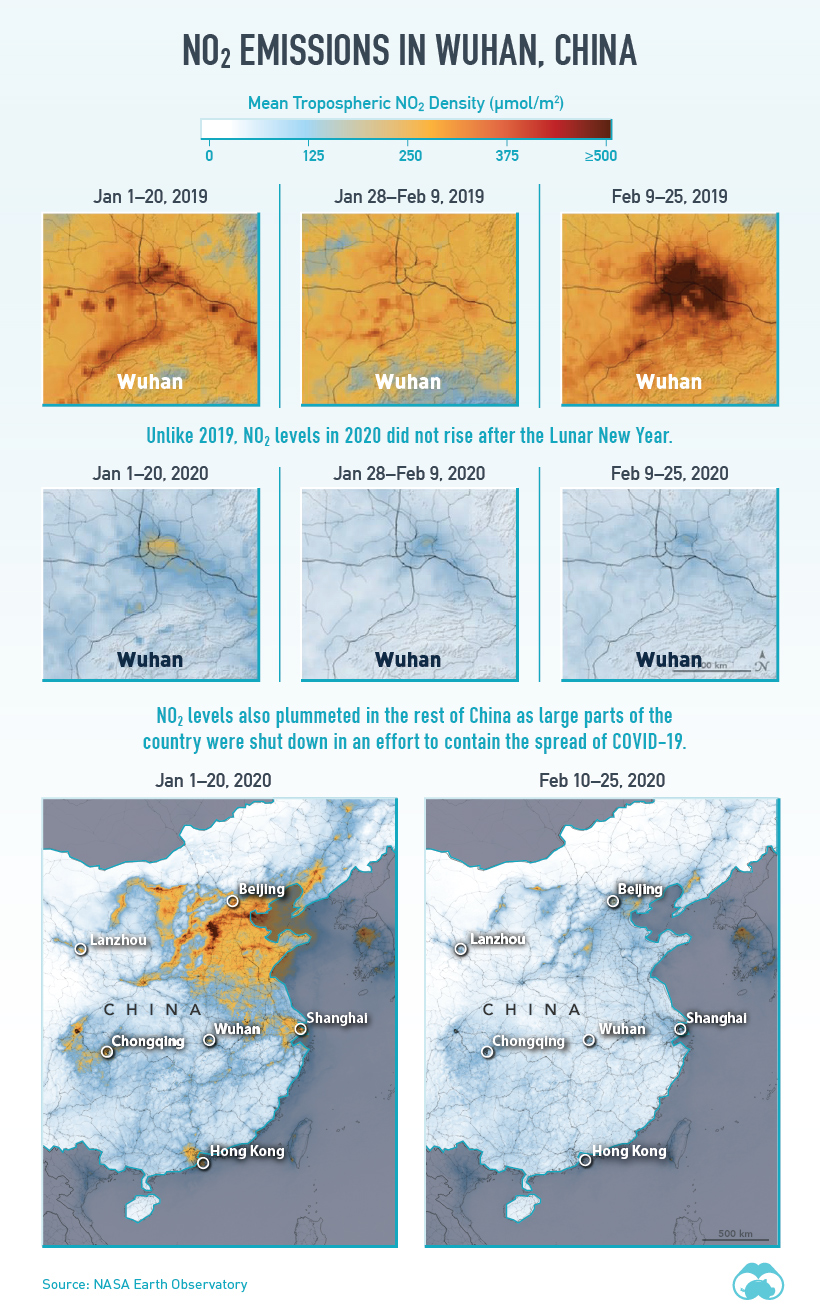
Source: NASA Earth Observatory
NO₂ emissions around the Hubei province, the original epicenter of the virus, steeply dropped as factories were forced to shutter their doors for the time being.
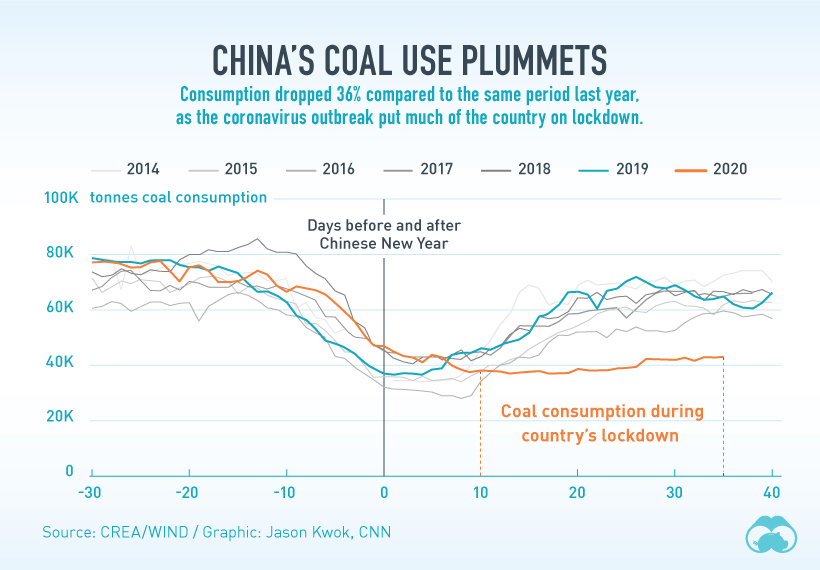
What’s more, there were measurable effects in the decline of other emission types from the drop in coal use during the same time, compared to years prior.
Back to the Status Quo?
In recent weeks, China has been able to flatten the curve of its total COVID-19 cases. As a result, the government is beginning to ease its restrictions—and it’s clear that social and economic activities are starting to pick back up in March.
Source: European Space Agency (ESA)
With the regular chain of events beginning to resume, it remains to be seen whether NO₂ emissions will rebound right back to their pre-pandemic levels.
This bounce-back effect—which can sometimes reverse any overall drop in emissions—is [called] “revenge pollution”. And in China, it has precedent.
—Li Shuo, Senior climate policy advisor, Greenpeace East Asia


Green
How Carbon Credits Can Help Close the Climate Funding Gap
To keep a 1.5℃ world within reach, global emissions need to fall by as much as 45% by 2030, and carbon credits could help close the gap.


How Carbon Credits Can Help Close the Climate Funding Gap
Governments around the world have committed to the goals of the Paris Agreement, but their climate pledges are insufficient. To keep a 1.5℃ world within reach, global emissions need to fall by as much as 45% by 2030.
Bold and immediate action is essential, but so are resources that will make it happen.
In this graphic, we have partnered with Carbon Streaming to look at the role that the voluntary carbon market and carbon credits can play in closing that gap.
More Funds are Needed for Climate Finance
According to data from the Climate Policy Initiative, climate finance, which includes funds for both adaptation and mitigation, needs to increase at least five-fold, from $1.3T in 2021/2022, to an average $8.6T annually until 2030, and then to just over $10T in the two decades leading up to 2050.
That adds up to a very large number, but consider that in 2022, $7.0T went to fossil fuel subsidies, which almost covers the annual estimated outlay. And the world has shown that when pressed, governments can come up with the money, if the global pandemic is any indication.
Mobilizing Carbon Finance to the Developing World
But the same cannot be said of the developing world, where debt, inequality, and poverty reduce the ability of governments to act. And this is where carbon credits can play an important role. According to analyses from Ecosystem Marketplace, carbon credits help move capital from developed countries, to where funds are needed in the developing world.
For example, in 2019, 69.2% of the carbon credits by volume in the voluntary carbon market were purchased by buyers in Europe, and nearly a third from North America. Compare that to over 90% of the volume of carbon credits sold in the voluntary carbon market in 2022 came from projects that were located outside of those two regions.
Carbon Credits Can Complement Decarbonization Efforts
Carbon credits can also complement decarbonization efforts in the corporate world, where more and more companies have been signing up to reduce emissions. According to the 2022 monitoring report from the Science Based Targets initiative, 4,230 companies around the world had approved targets and commitments, which represented an 88% increase from the prior year. However, as of year end 2022, combined scope 1 and 2 emissions covered by science-based targets totaled approximately 2 GtCO2e, which represents just a fraction of global emissions.
The fine print is that this is just scope 1 and 2 emissions, and doesn’t include scope 3 emissions, which can account for more than 70% of a company’s total emissions. And as these emissions come under greater and greater scrutiny the closer we get to 2030 and beyond, the voluntary carbon credit market could expand exponentially to help meet the need to compensate for these emissions.
Potential Carbon Credit Market Size in 2030
OK, but how big? In 2022, the voluntary carbon credit market was around $2B, but some analysts predict that it could grow to between $5–250 billion by 2030.
| Firm | Low Estimate | High Estimate |
|---|---|---|
| Bain & Company | $15B | $30B |
| Barclays | N/A | $250B |
| Citigroup | $5B | $50B |
| McKinsey & Company | $5B | $50B |
| Morgan Stanley | N/A | $100B |
| Shell / Boston Consulting Group | $10B | $40B |
Morgan Stanley and Barclays were the most bullish on the size of the voluntary carbon credit market in 2030, but the latter firm was even more optimistic about 2050, and predicted that the voluntary carbon credit market could grow to a colossal $1.5 trillion.
Carbon Streaming is Focused on Carbon Credit Integrity
Ultimately, carbon credits could have an important role to play in marshaling the resources needed to keep the world on track to net zero by 2050, and avoiding the worst consequences of a warming world.
Carbon Streaming uses streaming transactions, a proven and flexible funding model, to scale high-integrity carbon credit projects to advance global climate action and UN Sustainable Development Goals.
Learn more at www.carbonstreaming.com.

-

 Green1 week ago
Ranking the Top 15 Countries by Carbon Tax Revenue
This graphic highlights France and Canada as the global leaders when it comes to generating carbon tax revenue.
-

 Green1 week ago
Ranked: The Countries With the Most Air Pollution in 2023
South Asian nations are the global hotspot for pollution. In this graphic, we rank the world’s most polluted countries according to IQAir.
-

 Environment2 weeks ago
Top Countries By Forest Growth Since 2001
One country is taking reforestation very seriously, registering more than 400,000 square km of forest growth in two decades.
-

 Green3 weeks ago
Ranked: Top Countries by Total Forest Loss Since 2001
The country with the most forest loss since 2001 lost as much forest cover as the next four countries combined.
-

 Markets2 months ago
The World’s Top Cocoa Producing Countries
Here are the largest cocoa producing countries globally—from Côte d’Ivoire to Brazil—as cocoa prices hit record highs.
-

 Environment2 months ago
Charted: Share of World Forests by Country
We visualize which countries have the biggest share of world forests by area—and while country size plays a factor, so too, does the environment.


-

 Mining1 week ago
Gold vs. S&P 500: Which Has Grown More Over Five Years?
-

 Markets2 weeks ago
Ranked: The Most Valuable Housing Markets in America
-

 Money2 weeks ago
Which States Have the Highest Minimum Wage in America?
-

 AI2 weeks ago
Ranked: Semiconductor Companies by Industry Revenue Share
-

 Markets2 weeks ago
Ranked: The World’s Top Flight Routes, by Revenue
-

 Countries2 weeks ago
Population Projections: The World’s 6 Largest Countries in 2075
-

 Markets2 weeks ago
The Top 10 States by Real GDP Growth in 2023
-

 Demographics2 weeks ago
The Smallest Gender Wage Gaps in OECD Countries