Markets
How COVID-19 Consumer Spending is Impacting Industries
How COVID-19 Consumer Spending is Impacting Industries
Consumer spending is one of the most important driving forces for global economic growth.
Beyond impacting some of the factors that determine consumer spend—such as consumer confidence, unemployment levels, or the cost of living—the COVID-19 pandemic has also drastically altered how and where consumers choose to spend their hard-earned cash.
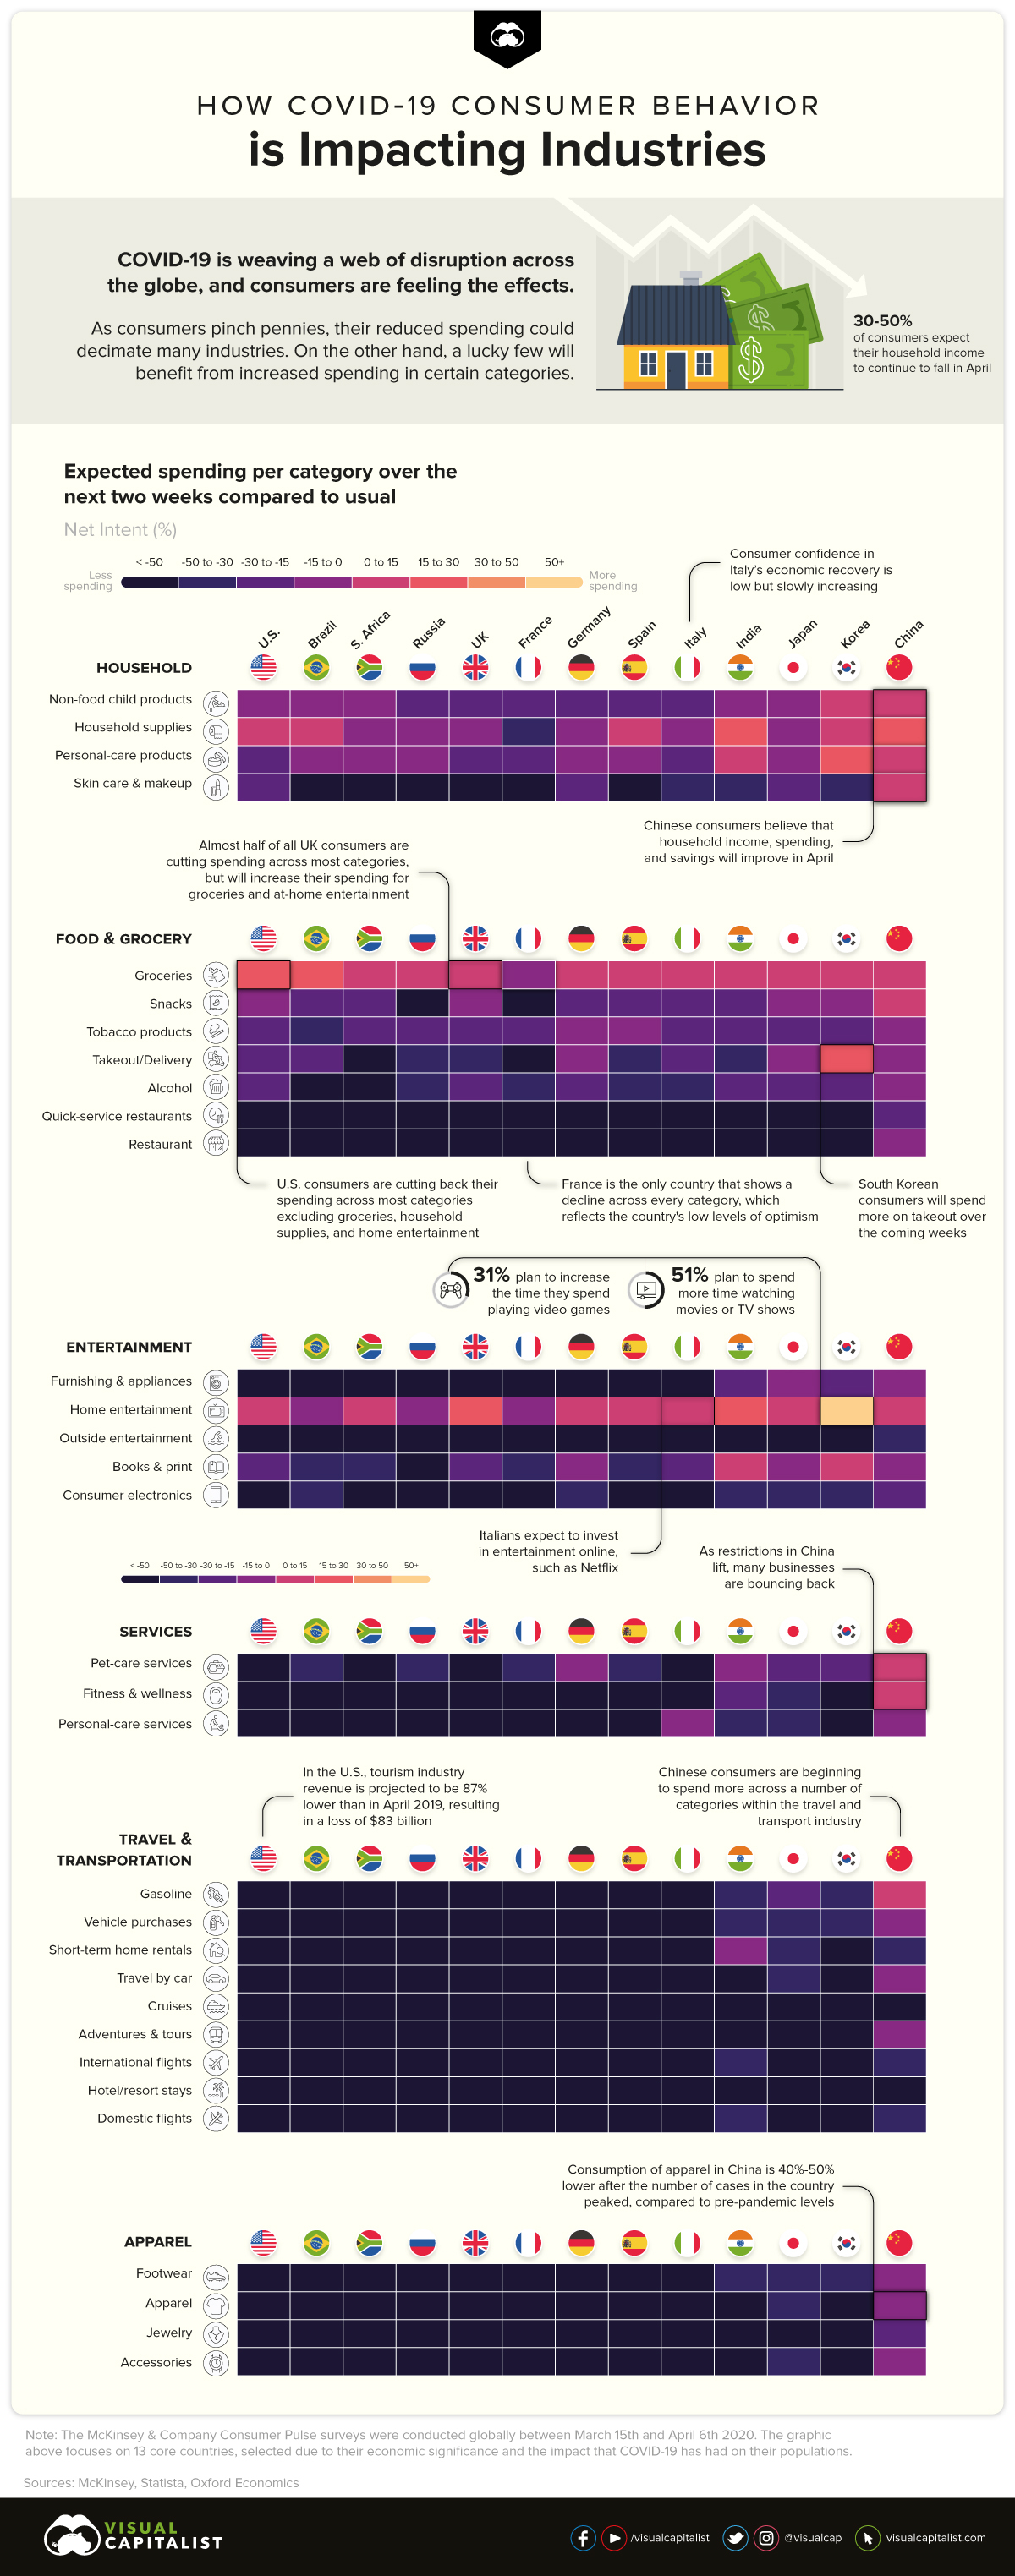
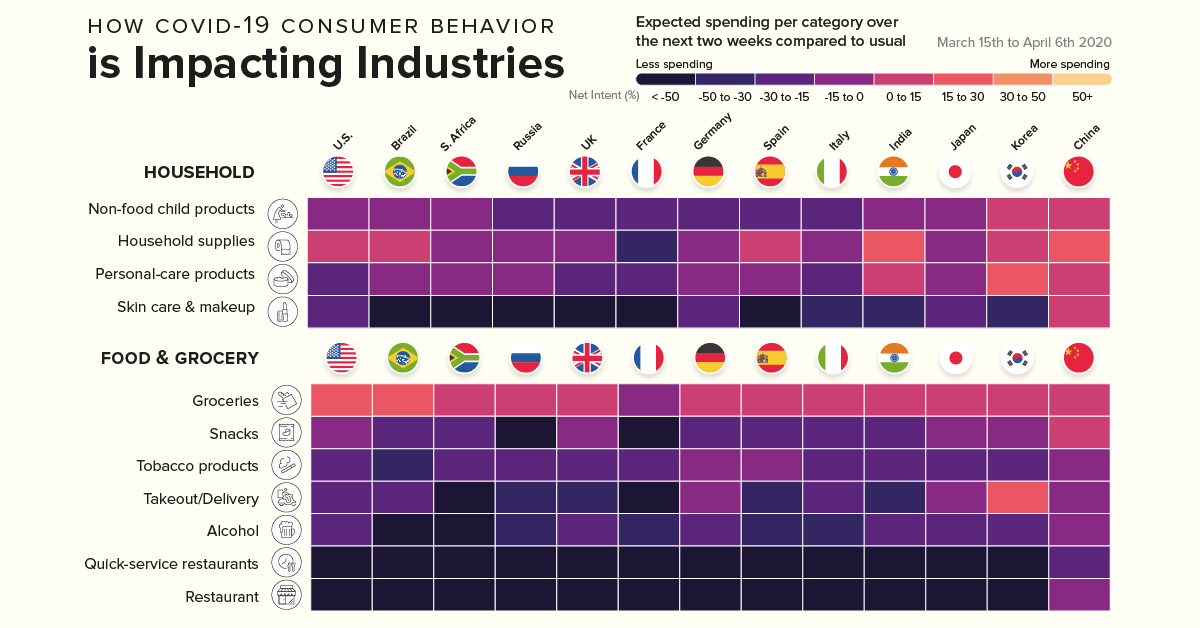
Today’s graphic pulls data from a global survey by McKinsey & Company that analyzes how consumers are reining in their spending, causing upheaval across every industry imaginable.
While some industries are in a better position to weather the impact of this storm, others could struggle to survive.
The Link Between Sentiment and Intent to Spend
As consumers grapple with uncertainty, their buying behavior becomes more erratic. What is clear however, is that they have reduced spending on all non-essential products and services.
But as each country moves along the COVID-19 curve, we can see a glimmer of increasing optimism levels, which in turn is linked to higher spending.
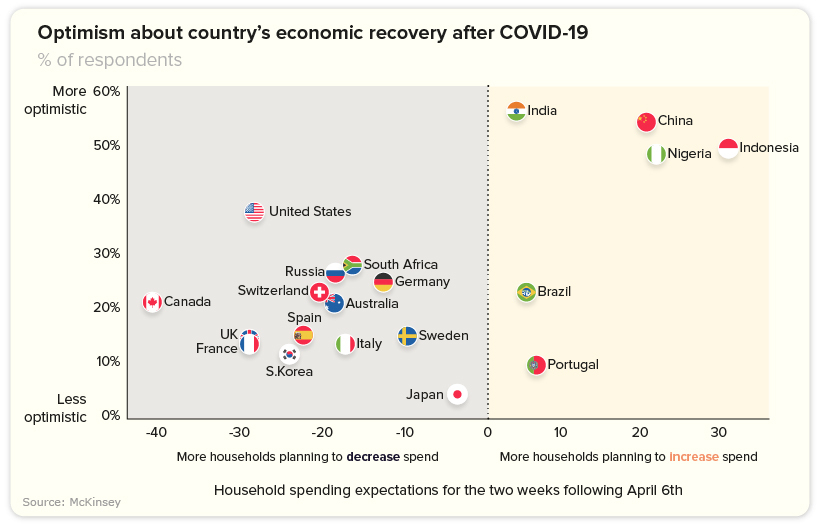
India’s consumers, for example, are displaying higher levels of optimism, with more households planning to increase spend—a trend that is also evident in China, Indonesia, and Nigeria.
Meanwhile, American consumers are still more optimistic about the future than Europeans. 37% of Americans believe the country will recover in 2 or 3 months—albeit with optimism levels at the highest for people who earn over $100K.
Strategic Consumer Spending
Globally, consumers continue to spend—and in some cases, spend more compared to pre-pandemic levels—on some necessities such as groceries and household supplies.
Due to changes in media consumption habits, consumers in almost all countries surveyed say they will increase their spend on at-home entertainment. This is especially true for Korea, a country that already boasts a massive gaming culture.
As restrictions in China lift, many categories such as gasoline, wellness, and pet-care services appear to be bouncing back, which could be a positive sign for other countries following a similar trajectory. But while consumers amp up their spending on the things they need, they also anticipate spending less in other categories.
The Industries in the Red
Categories showing an alarming decline include restaurants and out-of-home entertainment.
However, there are two particularly hard-hit industries worth noting that are showing declines across every category and country:
Travel and Transport
The inevitable decline in the travel and transportation industry is a reflection of mass social isolation levels and tightening travel restrictions.
In fact, the U.S. travel industry can expect to see an average decline in revenue of 81% for April and May. Throughout 2020, losses will equate to roughly $519 billion—translating to a broader $1.2 trillion contraction in total economic impact.
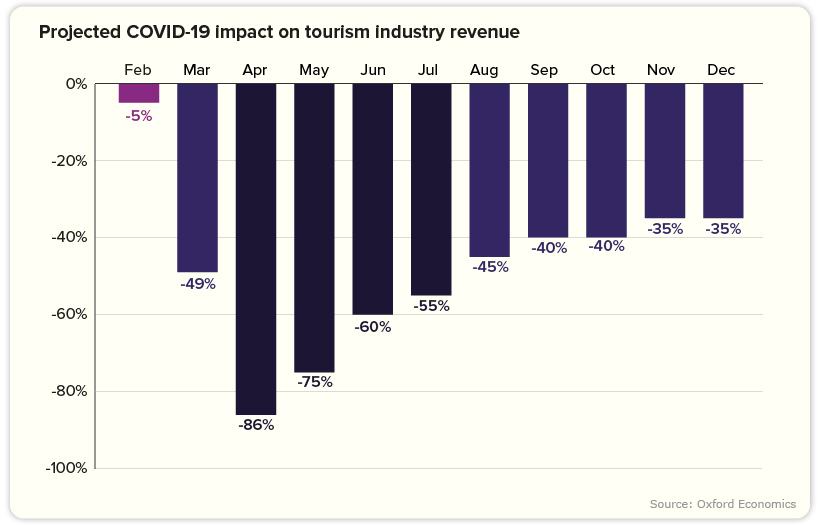
According to the World Travel and Tourism Council, a staggering 50 million jobs are at risk in the industry, with 30 million of those jobs belonging to employees in Asia.
Considering the travel and tourism industry accounts for 10.4% of global GDP, a slow recovery could have serious ramifications.
Apparel
Apparel is experiencing a similarly worrying slowdown, with consumption 40-50% lower in China compared to pre-pandemic levels. Both online and offline sales for businesses the world over are also taking a major hit.
As consumers hold back on their spending, clothing brands of all shapes and sizes are forced to scale back production, and reimagine how they position themselves.
“It’s an unprecedented interruption of an industry that has relied on speeding from one season’s sales to the next. And it is bringing with it a new sense of connectedness, responsibility and empathy.”
—Tamsin Blanchard, The Guardian
Towards an Uncertain Future
Clearly the force majeure that is COVID-19 has not impacted every industry equally.
For some, rebuilding their customer experience by appealing to changing values could result in a profitable, and perhaps much-needed revival. For other companies, there is no other choice but to play the waiting game.
Regardless, every industry faces one universal truth: life after the pandemic will look significantly different.


Markets
U.S. Debt Interest Payments Reach $1 Trillion
U.S. debt interest payments have surged past the $1 trillion dollar mark, amid high interest rates and an ever-expanding debt burden.


U.S. Debt Interest Payments Reach $1 Trillion
This was originally posted on our Voronoi app. Download the app for free on iOS or Android and discover incredible data-driven charts from a variety of trusted sources.
The cost of paying for America’s national debt crossed the $1 trillion dollar mark in 2023, driven by high interest rates and a record $34 trillion mountain of debt.
Over the last decade, U.S. debt interest payments have more than doubled amid vast government spending during the pandemic crisis. As debt payments continue to soar, the Congressional Budget Office (CBO) reported that debt servicing costs surpassed defense spending for the first time ever this year.
This graphic shows the sharp rise in U.S. debt payments, based on data from the Federal Reserve.
A $1 Trillion Interest Bill, and Growing
Below, we show how U.S. debt interest payments have risen at a faster pace than at another time in modern history:
| Date | Interest Payments | U.S. National Debt |
|---|---|---|
| 2023 | $1.0T | $34.0T |
| 2022 | $830B | $31.4T |
| 2021 | $612B | $29.6T |
| 2020 | $518B | $27.7T |
| 2019 | $564B | $23.2T |
| 2018 | $571B | $22.0T |
| 2017 | $493B | $20.5T |
| 2016 | $460B | $20.0T |
| 2015 | $435B | $18.9T |
| 2014 | $442B | $18.1T |
| 2013 | $425B | $17.2T |
| 2012 | $417B | $16.4T |
| 2011 | $433B | $15.2T |
| 2010 | $400B | $14.0T |
| 2009 | $354B | $12.3T |
| 2008 | $380B | $10.7T |
| 2007 | $414B | $9.2T |
| 2006 | $387B | $8.7T |
| 2005 | $355B | $8.2T |
| 2004 | $318B | $7.6T |
| 2003 | $294B | $7.0T |
| 2002 | $298B | $6.4T |
| 2001 | $318B | $5.9T |
| 2000 | $353B | $5.7T |
| 1999 | $353B | $5.8T |
| 1998 | $360B | $5.6T |
| 1997 | $368B | $5.5T |
| 1996 | $362B | $5.3T |
| 1995 | $357B | $5.0T |
| 1994 | $334B | $4.8T |
| 1993 | $311B | $4.5T |
| 1992 | $306B | $4.2T |
| 1991 | $308B | $3.8T |
| 1990 | $298B | $3.4T |
| 1989 | $275B | $3.0T |
| 1988 | $254B | $2.7T |
| 1987 | $240B | $2.4T |
| 1986 | $225B | $2.2T |
| 1985 | $219B | $1.9T |
| 1984 | $205B | $1.7T |
| 1983 | $176B | $1.4T |
| 1982 | $157B | $1.2T |
| 1981 | $142B | $1.0T |
| 1980 | $113B | $930.2B |
| 1979 | $96B | $845.1B |
| 1978 | $84B | $789.2B |
| 1977 | $69B | $718.9B |
| 1976 | $61B | $653.5B |
| 1975 | $55B | $576.6B |
| 1974 | $50B | $492.7B |
| 1973 | $45B | $469.1B |
| 1972 | $39B | $448.5B |
| 1971 | $36B | $424.1B |
| 1970 | $35B | $389.2B |
| 1969 | $30B | $368.2B |
| 1968 | $25B | $358.0B |
| 1967 | $23B | $344.7B |
| 1966 | $21B | $329.3B |
Interest payments represent seasonally adjusted annual rate at the end of Q4.
At current rates, the U.S. national debt is growing by a remarkable $1 trillion about every 100 days, equal to roughly $3.6 trillion per year.
As the national debt has ballooned, debt payments even exceeded Medicaid outlays in 2023—one of the government’s largest expenditures. On average, the U.S. spent more than $2 billion per day on interest costs last year. Going further, the U.S. government is projected to spend a historic $12.4 trillion on interest payments over the next decade, averaging about $37,100 per American.
Exacerbating matters is that the U.S. is running a steep deficit, which stood at $1.1 trillion for the first six months of fiscal 2024. This has accelerated due to the 43% increase in debt servicing costs along with a $31 billion dollar increase in defense spending from a year earlier. Additionally, a $30 billion increase in funding for the Federal Deposit Insurance Corporation in light of the regional banking crisis last year was a major contributor to the deficit increase.
Overall, the CBO forecasts that roughly 75% of the federal deficit’s increase will be due to interest costs by 2034.

-

 Travel1 week ago
Airline Incidents: How Do Boeing and Airbus Compare?
-

 Markets3 weeks ago
Visualizing America’s Shortage of Affordable Homes
-

 Green2 weeks ago
Ranked: Top Countries by Total Forest Loss Since 2001
-

 Money2 weeks ago
Where Does One U.S. Tax Dollar Go?
-

 Misc2 weeks ago
Almost Every EV Stock is Down After Q1 2024
-

 AI2 weeks ago
The Stock Performance of U.S. Chipmakers So Far in 2024
-

 Markets2 weeks ago
Charted: Big Four Market Share by S&P 500 Audits
-

 Real Estate2 weeks ago
Ranked: The Most Valuable Housing Markets in America