Markets
Comparing the Speed of U.S. Interest Rate Hikes (1988-2022)
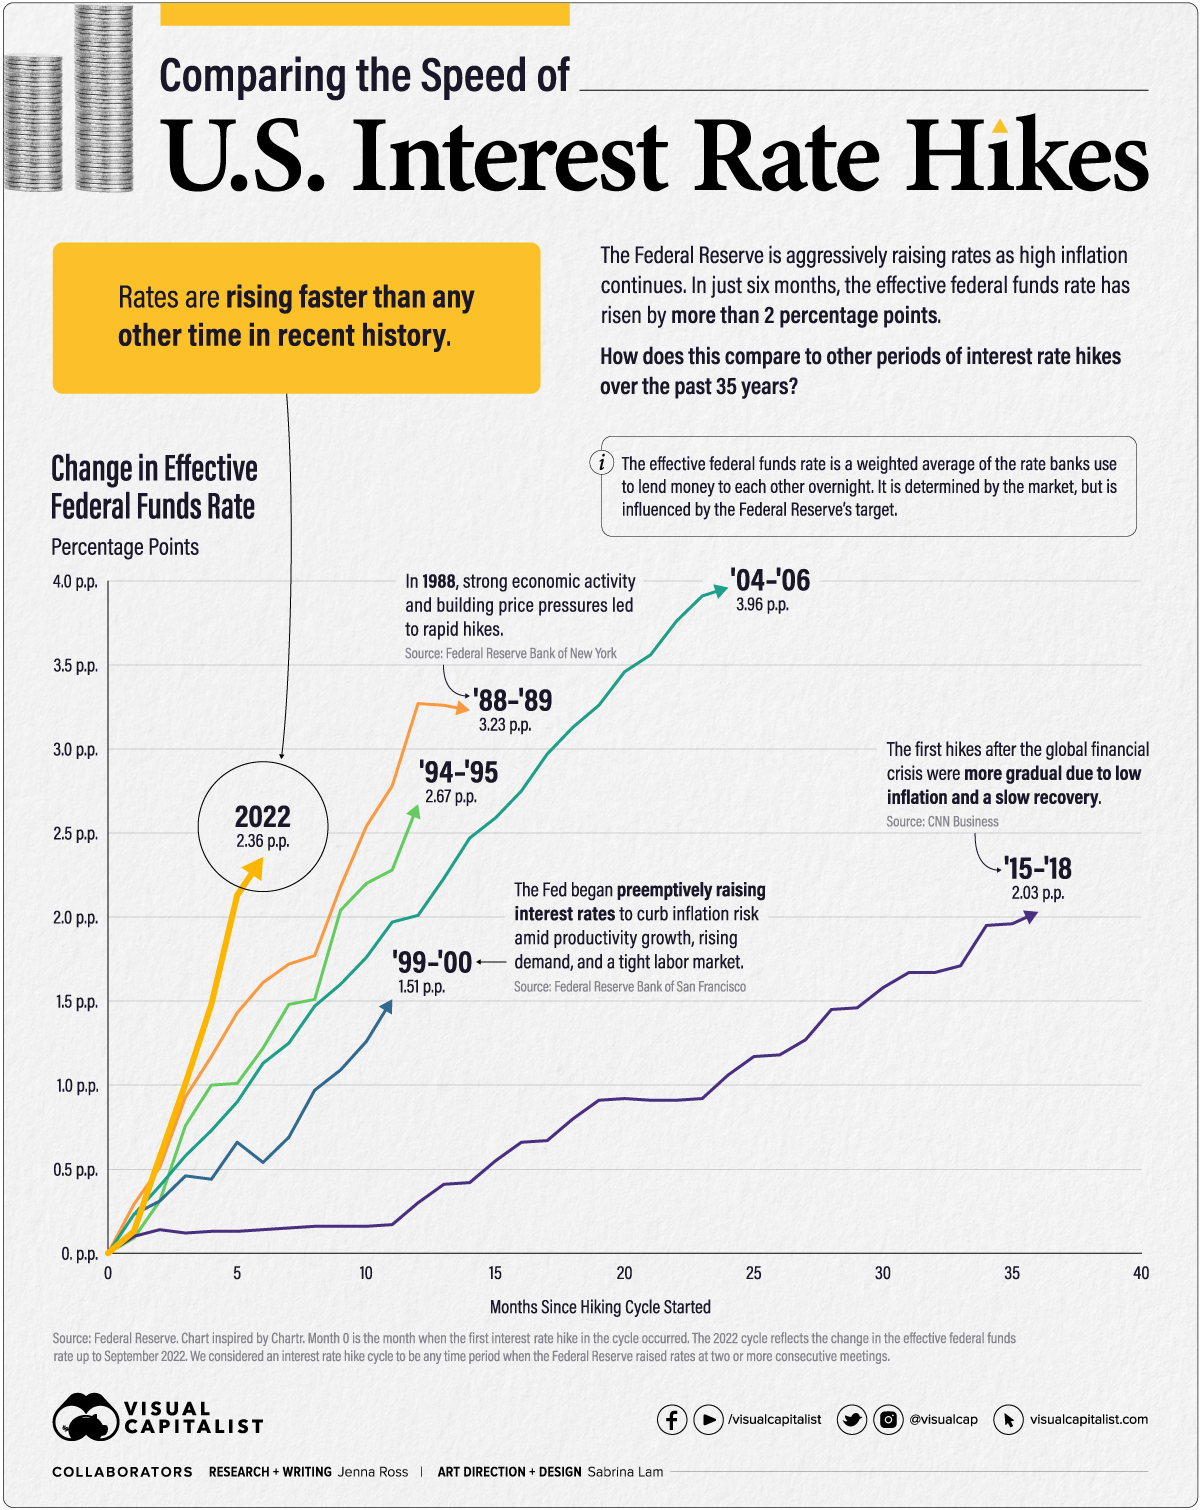


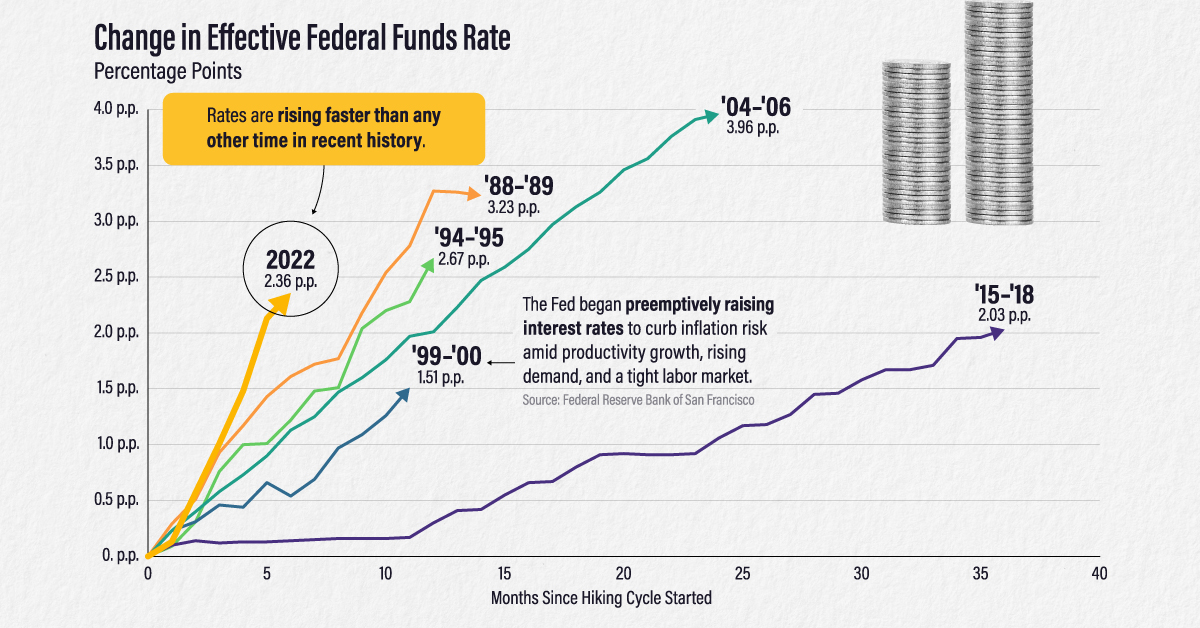
Comparing the Speed of U.S. Interest Rate Hikes
As U.S. inflation remains at multi-decade highs, the Federal Reserve has been aggressive with its interest rate hikes. In fact, rates have risen more than two percentage points in just six months.
In this graphic—which was inspired by a chart from Chartr—we compare the speed and severity of the current interest rate hikes to other periods of monetary tightening over the past 35 years.
Measuring Periods of Interest Rate Hikes
We used the effective federal funds rate (EFFR), which measures the weighted average of the rates that banks use to lend to each other overnight. It is determined by the market but influenced by the Fed’s target range. We considered the starting point for each cycle to be the EFFR during the month when the first rate hike took place.
Here is the duration and severity of each interest rate hike cycle since 1988.
| Time Period | Duration (Months) | Total Change in EFFR (Percentage Points) |
|---|---|---|
| Mar 1988 - May 1989 | 14 | 3.23 |
| Feb 1994 - Feb 1995 | 12 | 2.67 |
| Jun 1999 - May 2000 | 11 | 1.51 |
| Jun 2004 - Jun 2006 | 24 | 3.96 |
| Dec 2015 - Dec 2018 | 36 | 2.03 |
| Mar 2022 - Sep 2022 | 6 | 2.36 |
* We considered a rate hike cycle to be any time period when the Federal Reserve raised rates at two or more consecutive meetings. The 2022 rate hike cycle is ongoing with data as of September 2022.
The 2022 rate hike cycle is the fastest, reaching a 2.36 percentage point increase nearly twice as fast as the rate hike cycle of ‘88-‘89.
On the other hand, the most severe interest rate hikes occurred in the ‘04 – ‘06 cycle when the EFFR climbed by almost four percentage points. It took much longer to reach this level, however, with the hikes taking place over two years.
Timing Interest Rate Hikes
Why are 2022’s interest rate hikes so rapid? U.S. inflation far exceeds the Fed’s long-term target of 2%. In fact, when the hikes started in March 2022, inflation was the highest it’s ever been in the last six rate hike cycles.
| Time Period | Inflation Rate at Start of Cycle |
|---|---|
| Mar 1988 - May 1989 | 3.60% |
| Feb 1994 - Feb 1995 | 2.06% |
| Jun 1999 - May 2000 | 1.40% |
| Jun 2004 - Jun 2006 | 2.89% |
| Dec 2015 - Dec 2018 | 0.30% |
| Mar 2022 - Sep 2022 | 6.77% |
Inflation rate is the year-over-year change as measured by the Personal Consumption Expenditures (PCE) Index.
In contrast, three of the rate hike cycles started with inflation at or below the 2% target. Inflation was just 0.30% in December 2015 when the Fed announced its first rate hike since the global financial crisis.
Some criticized the Fed for raising rates prematurely, but the Fed’s rationale was that it can take up to three years or more for policy actions to affect economic conditions. By raising rates early and gradually, the Fed hoped to avoid surging inflation in the future.
Fast forward to today, and the picture couldn’t look more different. Inflation exceeded the 2% target for 12 months before the Fed began to raise rates. Initially, the Fed believed inflation was “transitory” or short-lived. Now, inflation is a top financial concern and there is a risk that it has gathered enough momentum that it will be difficult to bring down.
Balancing Inflation and Recession Risks
The Fed expects to raise its target rate to around 4.4% by the end of 2022, up from the current range of 3-3.25%. However, they don’t foresee inflation reaching their 2% target until 2025.
In the meantime, the rapid interest rate hikes could lead to an economic downturn. Risks of a global recession have increased as other central banks raise their rates too. The World Bank offers policymakers a number of suggestions to help avoid a recession:
- Central banks can communicate policy decisions clearly to secure inflation expectations and, hopefully, reduce how much they need to raise rates.
- Governments can carefully withdraw fiscal support, develop medium-term spending and tax policies, and provide targeted help to vulnerable households.
- Other economic policymakers can help relieve supply pressures through various measures. For instance, they can introduce policies to increase labor force participation, enhance global trade networks, and bring in measures to reduce energy consumption.
Will policymakers heed this advice and, if so, will it prove sufficient to avoid a global recession?


Markets
The European Stock Market: Attractive Valuations Offer Opportunities
On average, the European stock market has valuations that are nearly 50% lower than U.S. valuations. But how can you access the market?


European Stock Market: Attractive Valuations Offer Opportunities
Europe is known for some established brands, from L’Oréal to Louis Vuitton. However, the European stock market offers additional opportunities that may be lesser known.
The above infographic, sponsored by STOXX, outlines why investors may want to consider European stocks.
Attractive Valuations
Compared to most North American and Asian markets, European stocks offer lower or comparable valuations.
| Index | Price-to-Earnings Ratio | Price-to-Book Ratio |
|---|---|---|
| EURO STOXX 50 | 14.9 | 2.2 |
| STOXX Europe 600 | 14.4 | 2 |
| U.S. | 25.9 | 4.7 |
| Canada | 16.1 | 1.8 |
| Japan | 15.4 | 1.6 |
| Asia Pacific ex. China | 17.1 | 1.8 |
Data as of February 29, 2024. See graphic for full index names. Ratios based on trailing 12 month financials. The price to earnings ratio excludes companies with negative earnings.
On average, European valuations are nearly 50% lower than U.S. valuations, potentially offering an affordable entry point for investors.
Research also shows that lower price ratios have historically led to higher long-term returns.
Market Movements Not Closely Connected
Over the last decade, the European stock market had low-to-moderate correlation with North American and Asian equities.
The below chart shows correlations from February 2014 to February 2024. A value closer to zero indicates low correlation, while a value of one would indicate that two regions are moving in perfect unison.
| EURO STOXX 50 | STOXX EUROPE 600 | U.S. | Canada | Japan | Asia Pacific ex. China |
|
|---|---|---|---|---|---|---|
| EURO STOXX 50 | 1.00 | 0.97 | 0.55 | 0.67 | 0.24 | 0.43 |
| STOXX EUROPE 600 | 1.00 | 0.56 | 0.71 | 0.28 | 0.48 | |
| U.S. | 1.00 | 0.73 | 0.12 | 0.25 | ||
| Canada | 1.00 | 0.22 | 0.40 | |||
| Japan | 1.00 | 0.88 | ||||
| Asia Pacific ex. China | 1.00 |
Data is based on daily USD returns.
European equities had relatively independent market movements from North American and Asian markets. One contributing factor could be the differing sector weights in each market. For instance, technology makes up a quarter of the U.S. market, but health care and industrials dominate the broader European market.
Ultimately, European equities can enhance portfolio diversification and have the potential to mitigate risk for investors.
Tracking the Market
For investors interested in European equities, STOXX offers a variety of flagship indices:
| Index | Description | Market Cap |
|---|---|---|
| STOXX Europe 600 | Pan-regional, broad market | €10.5T |
| STOXX Developed Europe | Pan-regional, broad-market | €9.9T |
| STOXX Europe 600 ESG-X | Pan-regional, broad market, sustainability focus | €9.7T |
| STOXX Europe 50 | Pan-regional, blue-chip | €5.1T |
| EURO STOXX 50 | Eurozone, blue-chip | €3.5T |
Data is as of February 29, 2024. Market cap is free float, which represents the shares that are readily available for public trading on stock exchanges.
The EURO STOXX 50 tracks the Eurozone’s biggest and most traded companies. It also underlies one of the world’s largest ranges of ETFs and mutual funds. As of November 2023, there were €27.3 billion in ETFs and €23.5B in mutual fund assets under management tracking the index.
“For the past 25 years, the EURO STOXX 50 has served as an accurate, reliable and tradable representation of the Eurozone equity market.”
— Axel Lomholt, General Manager at STOXX
Partnering with STOXX to Track the European Stock Market
Are you interested in European equities? STOXX can be a valuable partner:
- Comprehensive, liquid and investable ecosystem
- European heritage, global reach
- Highly sophisticated customization capabilities
- Open architecture approach to using data
- Close partnerships with clients
- Part of ISS STOXX and Deutsche Börse Group
With a full suite of indices, STOXX can help you benchmark against the European stock market.
Learn how STOXX’s European indices offer liquid and effective market access.

-

 Economy1 day ago
Economic Growth Forecasts for G7 and BRICS Countries in 2024
The IMF has released its economic growth forecasts for 2024. How do the G7 and BRICS countries compare?
-

 Markets1 week ago
U.S. Debt Interest Payments Reach $1 Trillion
U.S. debt interest payments have surged past the $1 trillion dollar mark, amid high interest rates and an ever-expanding debt burden.
-

 United States1 week ago
Ranked: The Largest U.S. Corporations by Number of Employees
We visualized the top U.S. companies by employees, revealing the massive scale of retailers like Walmart, Target, and Home Depot.
-

 Markets2 weeks ago
The Top 10 States by Real GDP Growth in 2023
This graphic shows the states with the highest real GDP growth rate in 2023, largely propelled by the oil and gas boom.
-

 Markets2 weeks ago
Ranked: The World’s Top Flight Routes, by Revenue
In this graphic, we show the highest earning flight routes globally as air travel continued to rebound in 2023.
-

 Markets2 weeks ago
Ranked: The Most Valuable Housing Markets in America
The U.S. residential real estate market is worth a staggering $47.5 trillion. Here are the most valuable housing markets in the country.


-

 Mining1 week ago
Gold vs. S&P 500: Which Has Grown More Over Five Years?
-
Markets2 weeks ago
Ranked: The Most Valuable Housing Markets in America
-

 Money2 weeks ago
Which States Have the Highest Minimum Wage in America?
-

 AI2 weeks ago
Ranked: Semiconductor Companies by Industry Revenue Share
-
Markets2 weeks ago
Ranked: The World’s Top Flight Routes, by Revenue
-

 Demographics2 weeks ago
Population Projections: The World’s 6 Largest Countries in 2075
-
Markets2 weeks ago
The Top 10 States by Real GDP Growth in 2023
-

 Demographics2 weeks ago
The Smallest Gender Wage Gaps in OECD Countries