Misc
Animation: China’s Rapid Transit Boom (1990 – 2020)
After decades of hyper-growth and worsening pollution, China has fully embraced rapid transit as a way to keep cities moving. By 2020, China aims to have 7,000 km (4,300 mi.) of rapid transit lines, more than five times what exists in the U.S. today.
The following animation from Peter Dovak shows this rapid transit revolution playing out by year:
MIND THE GAP
In the above animation, there’s a distinct uptick in the number of projects started after 2004. It was in this year that the government lifted a ban on new metro construction, after worsening congestion and pollution caused the government to rethink their stance. There has been a rapid transit boom in the country ever since.
Soon, minimum population requirements for cities looking to build subway systems will be halved from 3 million to 1.5 million, and this move is expected to set off an even bigger wave of infrastructure investment in cities throughout the country.
RISING RATIOS
Hundreds of kilometers of track are being added each year. As a result of this unparalleled pace of metro construction, China’s ratio of Rapid Transit to Residents (RTR) has risen steeply over the last 15 years.
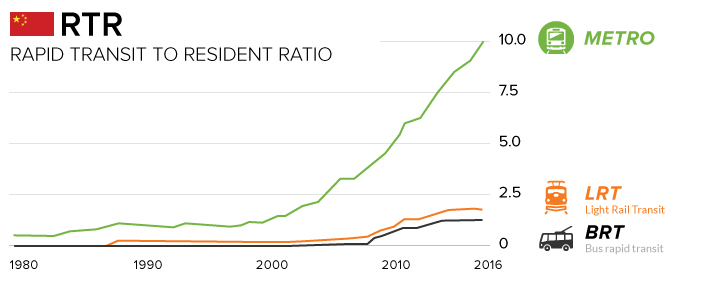
RTR is a ratio that compares the length of rapid transit lines (measured in kilometers) with the country’s urban population (measured in millions of people). As you can see, China is making great strides in building urban transit networks, though it is still catching up to countries like Germany, which has a RTR of 81.
Chinese cities have a blend of attributes that make constructing metro lines an appealing option: fewer regulatory hurdles, a low cost of labor, and a high-density urban fabric. Also, because transit is treated as an essential public service (i.e. not expected to be profitable), China’s metros provide affordable mobility to its citizens. Even with Beijing’s recent metro fare increase, most rides only cost about ¥3 to ¥8, or $0.45 to $1.45.
Shanghai is now home to the longest metro system by route length, and the Beijing Subway has the highest ridership in the world. Not bad for cities that lacked any substantive transit system until the 1990s.
By 2020, China is expected to have 220+ cities with over a million inhabitants, so as long as the government can continue to provide the resources and funding to expanding transit networks, the building boom will likely continue unabated.


Misc
How Hard Is It to Get Into an Ivy League School?
We detail the admission rates and average annual cost for Ivy League schools, as well as the median SAT scores required to be accepted.


How Hard Is It to Get Into an Ivy League School?
This was originally posted on our Voronoi app. Download the app for free on iOS or Android and discover incredible data-driven charts from a variety of trusted sources.
Ivy League institutions are renowned worldwide for their academic excellence and long-standing traditions. But how hard is it to get into one of the top universities in the U.S.?
In this graphic, we detail the admission rates and average annual cost for Ivy League schools, as well as the median SAT scores required to be accepted. The data comes from the National Center for Education Statistics and was compiled by 24/7 Wall St.
Note that “average annual cost” represents the net price a student pays after subtracting the average value of grants and/or scholarships received.
Harvard is the Most Selective
The SAT is a standardized test commonly used for college admissions in the United States. It’s taken by high school juniors and seniors to assess their readiness for college-level academic work.
When comparing SAT scores, Harvard and Dartmouth are among the most challenging universities to gain admission to. The median SAT scores for their students are 760 for reading and writing and 790 for math. Still, Harvard has half the admission rate (3.2%) compared to Dartmouth (6.4%).
| School | Admission rate (%) | SAT Score: Reading & Writing | SAT Score: Math | Avg Annual Cost* |
|---|---|---|---|---|
| Harvard University | 3.2 | 760 | 790 | $13,259 |
| Columbia University | 3.9 | 750 | 780 | $12,836 |
| Yale University | 4.6 | 760 | 780 | $16,341 |
| Brown University | 5.1 | 760 | 780 | $26,308 |
| Princeton University | 5.7 | 760 | 780 | $11,080 |
| Dartmouth College | 6.4 | 760 | 790 | $33,023 |
| University of Pennsylvania | 6.5 | 750 | 790 | $14,851 |
| Cornell University | 7.5 | 750 | 780 | $29,011 |
*Costs after receiving federal financial aid.
Additionally, Dartmouth has the highest average annual cost at $33,000. Princeton has the lowest at $11,100.
While student debt has surged in the United States in recent years, hitting $1.73 trillion in 2023, the worth of obtaining a degree from any of the schools listed surpasses mere academics. This is evidenced by the substantial incomes earned by former students.
Harvard grads, for example, have the highest average starting salary in the country, at $91,700.

-

 Real Estate2 weeks ago
Visualizing America’s Shortage of Affordable Homes
-

 Technology1 week ago
Ranked: Semiconductor Companies by Industry Revenue Share
-

 Money1 week ago
Which States Have the Highest Minimum Wage in America?
-

 Real Estate1 week ago
Ranked: The Most Valuable Housing Markets in America
-

 Business2 weeks ago
Charted: Big Four Market Share by S&P 500 Audits
-

 AI2 weeks ago
The Stock Performance of U.S. Chipmakers So Far in 2024
-

 Misc2 weeks ago
Almost Every EV Stock is Down After Q1 2024
-

 Money2 weeks ago
Where Does One U.S. Tax Dollar Go?