Markets
China’s Economy: 40 Years of Soaring Exports
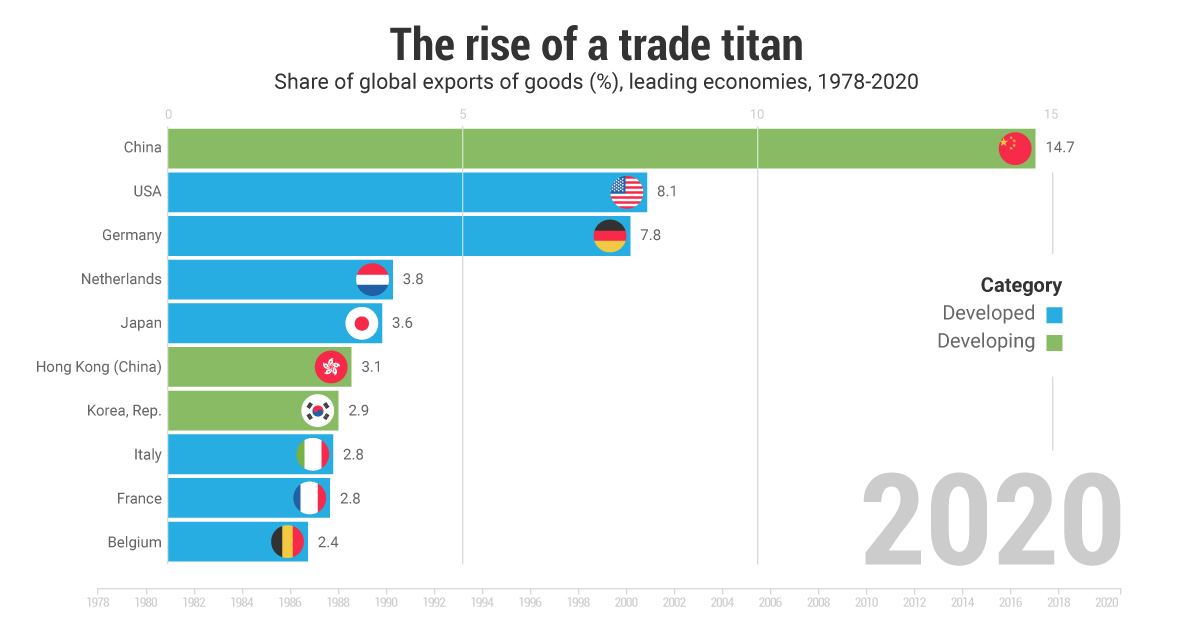
Animated Chart: 40 Years of Soaring Exports in China
China has the second highest GDP in the world, and it exports 15% of all the world’s goods. But how did this come to be?
A mere 40 years ago, China’s economy was in an entirely different situation, making up less than 1% of global exports and still in the infancy stages of building its economy. The above animated chart from the UNCTAD showcases China’s rise to global trade dominance over time.
Timeline: The Rise to Power
The China of the mid-20th century looks remarkably different when compared to the modern-day nation. Prior to the 1980s, China was going through a period of social upheaval, poverty, and dictatorship under Mao Zedong.
The 1970s
Beginning in the late 1970s, China’s share of global exports stood at less than 1%. The country had few trade hubs and little industry. In 1979, for example, Shenzhen was a city of just around 30,000 inhabitants.
In fact, China (excluding Taiwan* and Hong Kong) did not even show up in the top 10 global exporters until 1997 when it hit a 3.3% share of global exports.
| Year | Share of Global Exports | Rank |
|---|---|---|
| 2000 | 4.0% | #7 |
| 2005 | 7.3% | #3 |
| 2010 | 10.3% | #1 |
| 2015 | 13.7% | #1 |
| 2020 | 14.7% | #1 |
*Editor’s note: The above data comes from the UN, which lists Taiwan as a separate region of China for political reasons.
The 1980s
In the 1980s, several cities and regions, like the Pearl River Delta, were designated as Special Economic Zones. These SEZs had tax incentives that worked to attract foreign investment.
Additionally, in 1989, the Coastal Development Strategy was implemented to use strategic regions along the country’s coast as catalysts for economic development.
The 1990s and Onwards
By the 1990s, the world saw the rise of global value chains and transnational production lines, with China offering a cheap manufacturing hub due to low labor costs.
Rounding out the ‘90s, the Western Development Strategy was implemented in 1999, dubbed the “Open Up the West” program. This program worked to build up infrastructure and education to retain talent in China’s economy, with the goal of attracting further foreign investment.
Finally, China officially joined the World Trade Organization in 2001 which allowed the country to progress full steam ahead.
Made in China
Today China is a trade giant and manufacturing behemoth. Only the U.S. and Germany come close to its share of global exports, sitting at 8.1% and 7.8% respectively.
| Rank | Country | Share of Global Exports (2020) |
|---|---|---|
| #1 | 🇨🇳 China | 14.7% |
| #2 | 🇺🇸 U.S. | 8.1% |
| #3 | 🇩🇪 Germany | 7.8% |
| #4 | 🇳🇱 Netherlands | 3.8% |
| #5 | 🇯🇵 Japan | 3.6% |
| #6 | 🇭🇰 Hong Kong SAR | 3.1% |
| #7 | 🇰🇷 South Korea | 2.9% |
| #8 | 🇮🇹 Italy | 2.8% |
| #9 | 🇫🇷 France | 2.8% |
| #10 | 🇧🇪 Belgium | 2.4% |
China’s manufacturing industry has become dominant in producing just about anything from commonplace household items to integral pieces in automotive manufacturing. Some staples of Chinese manufacturing are:
- Precision instruments
- Semiconductors
- Industrial machinery for computers and smartphones
COVID-19 made China’s integral role in the global economy even more visceral, as major delays in the supply chain occurred when the virus hit the country.
An Economic Superpower
In 2021, China’s trade recovery from the crisis has bested most other countries—in Q1 2021, its exports grew by almost 50% compared to the previous year’s quarter, to around $710 billion.
And the country is not slowing down any time soon. Further plans for economic development are well under way, like Made in China 2025, with the goal of becoming a dominant player in global high-tech manufacturing. Additionally, the famous One Belt, One Road initiative has been funding infrastructure projects globally over the past decade, and the country is also a founding member of the RCEP—which is soon to be the world’s biggest trading bloc.
However, China still faces a series of challenges, such as:
- Population decline
- The onset of labor saving technology
- Trade wars with U.S. and sanctions from other trade partners, like Europe
- The emergence of ASEAN trade powers, like Vietnam
A declining population has many implications like a shrinking workforce and domestic market. Additionally, many companies are setting up shop in less costly manufacturing hubs like Vietnam.
Furthermore, inexpensive innovations in labor-saving technologies, such as robotics and automation, have already begun to undermine the cheap manual labor that has made China the world’s manufacturer.
All of these elements and more could potentially spell a slowing of growth in China’s export dominance. However, while the future for China may not be certain, currently, global trade and production could not function without it.


Markets
U.S. Debt Interest Payments Reach $1 Trillion
U.S. debt interest payments have surged past the $1 trillion dollar mark, amid high interest rates and an ever-expanding debt burden.


U.S. Debt Interest Payments Reach $1 Trillion
This was originally posted on our Voronoi app. Download the app for free on iOS or Android and discover incredible data-driven charts from a variety of trusted sources.
The cost of paying for America’s national debt crossed the $1 trillion dollar mark in 2023, driven by high interest rates and a record $34 trillion mountain of debt.
Over the last decade, U.S. debt interest payments have more than doubled amid vast government spending during the pandemic crisis. As debt payments continue to soar, the Congressional Budget Office (CBO) reported that debt servicing costs surpassed defense spending for the first time ever this year.
This graphic shows the sharp rise in U.S. debt payments, based on data from the Federal Reserve.
A $1 Trillion Interest Bill, and Growing
Below, we show how U.S. debt interest payments have risen at a faster pace than at another time in modern history:
| Date | Interest Payments | U.S. National Debt |
|---|---|---|
| 2023 | $1.0T | $34.0T |
| 2022 | $830B | $31.4T |
| 2021 | $612B | $29.6T |
| 2020 | $518B | $27.7T |
| 2019 | $564B | $23.2T |
| 2018 | $571B | $22.0T |
| 2017 | $493B | $20.5T |
| 2016 | $460B | $20.0T |
| 2015 | $435B | $18.9T |
| 2014 | $442B | $18.1T |
| 2013 | $425B | $17.2T |
| 2012 | $417B | $16.4T |
| 2011 | $433B | $15.2T |
| 2010 | $400B | $14.0T |
| 2009 | $354B | $12.3T |
| 2008 | $380B | $10.7T |
| 2007 | $414B | $9.2T |
| 2006 | $387B | $8.7T |
| 2005 | $355B | $8.2T |
| 2004 | $318B | $7.6T |
| 2003 | $294B | $7.0T |
| 2002 | $298B | $6.4T |
| 2001 | $318B | $5.9T |
| 2000 | $353B | $5.7T |
| 1999 | $353B | $5.8T |
| 1998 | $360B | $5.6T |
| 1997 | $368B | $5.5T |
| 1996 | $362B | $5.3T |
| 1995 | $357B | $5.0T |
| 1994 | $334B | $4.8T |
| 1993 | $311B | $4.5T |
| 1992 | $306B | $4.2T |
| 1991 | $308B | $3.8T |
| 1990 | $298B | $3.4T |
| 1989 | $275B | $3.0T |
| 1988 | $254B | $2.7T |
| 1987 | $240B | $2.4T |
| 1986 | $225B | $2.2T |
| 1985 | $219B | $1.9T |
| 1984 | $205B | $1.7T |
| 1983 | $176B | $1.4T |
| 1982 | $157B | $1.2T |
| 1981 | $142B | $1.0T |
| 1980 | $113B | $930.2B |
| 1979 | $96B | $845.1B |
| 1978 | $84B | $789.2B |
| 1977 | $69B | $718.9B |
| 1976 | $61B | $653.5B |
| 1975 | $55B | $576.6B |
| 1974 | $50B | $492.7B |
| 1973 | $45B | $469.1B |
| 1972 | $39B | $448.5B |
| 1971 | $36B | $424.1B |
| 1970 | $35B | $389.2B |
| 1969 | $30B | $368.2B |
| 1968 | $25B | $358.0B |
| 1967 | $23B | $344.7B |
| 1966 | $21B | $329.3B |
Interest payments represent seasonally adjusted annual rate at the end of Q4.
At current rates, the U.S. national debt is growing by a remarkable $1 trillion about every 100 days, equal to roughly $3.6 trillion per year.
As the national debt has ballooned, debt payments even exceeded Medicaid outlays in 2023—one of the government’s largest expenditures. On average, the U.S. spent more than $2 billion per day on interest costs last year. Going further, the U.S. government is projected to spend a historic $12.4 trillion on interest payments over the next decade, averaging about $37,100 per American.
Exacerbating matters is that the U.S. is running a steep deficit, which stood at $1.1 trillion for the first six months of fiscal 2024. This has accelerated due to the 43% increase in debt servicing costs along with a $31 billion dollar increase in defense spending from a year earlier. Additionally, a $30 billion increase in funding for the Federal Deposit Insurance Corporation in light of the regional banking crisis last year was a major contributor to the deficit increase.
Overall, the CBO forecasts that roughly 75% of the federal deficit’s increase will be due to interest costs by 2034.

-

 Technology2 weeks ago
Ranked: The Most Popular Smartphone Brands in the U.S.
-

 Automotive1 week ago
Almost Every EV Stock is Down After Q1 2024
-

 Money1 week ago
Where Does One U.S. Tax Dollar Go?
-

 Green2 weeks ago
Ranked: Top Countries by Total Forest Loss Since 2001
-

 Real Estate2 weeks ago
Visualizing America’s Shortage of Affordable Homes
-

 Maps2 weeks ago
Mapped: Average Wages Across Europe
-

 Mining2 weeks ago
Charted: The Value Gap Between the Gold Price and Gold Miners
-

 Demographics2 weeks ago
Visualizing the Size of the Global Senior Population