Markets
How China Overtook the U.S. as the World’s Major Trading Partner
How China Overtook the U.S. As the World’s Trade Partner
In 2018, trade accounted for 59% of global GDP, up nearly 1.5 times since 1980.
Over this timeframe, international trade has transformed significantly—not just in terms of volume and composition, but also in terms of the countries that the rest of the world leans on for their most important trade relationships.
Now, a critical shift is occurring in the landscape, and it may surprise you to learn that China has already usurped the U.S. as the world’s most dominant trading partner.
Trading Places: A Global Shift
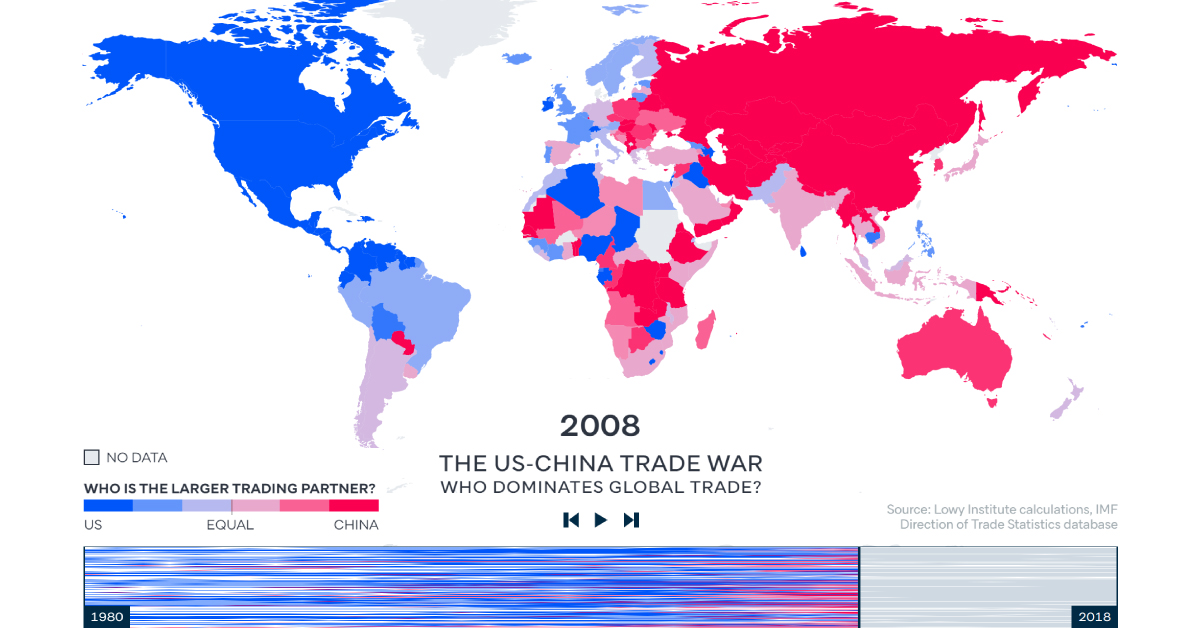
Today’s animation comes from the Lowy Institute, and it pulls data from the International Monetary Fund (IMF) database on bilateral trade flows, to determine whether the U.S. or China is a bigger trading partner for each country from 1980 to 2018.
The results are stark: before 2000, the U.S. was at the helm of global trade, as over 80% of countries traded with the U.S. more than they did with China. By 2018, that number had dropped sharply to just 30%, as China swiftly took top position in 128 of 190 countries.
The researchers pinpoint China’s 2001 entry into the World Trade Organization as a major turning point in China’s international trade relationships. The dramatic shift that followed is clearly demonstrated in the visualization above—between 2005 and 2010, a number of countries tipped towards Chinese influence, especially in Africa and Asia.
Over time, China’s dominance has grown dramatically. It’s no wonder then, that China and the U.S. have a contentious trade relationship themselves, as both nations battle it out for first place.
A Tale of Two Economies
The United States and China are competitors in many ways, but to be successful they must rely on each other for mutually beneficial trade. However, it’s also the major issue on which they are struggling to reach a common ground.
The U.S. has been vocal about negotiating more balanced trade agreements with China. In fact, a mid-2018 poll shows that 62% of Americans consider their trade relationship with China to be unfair.
Since 2018, both parties have faced a fraught relationship, imposing major tariffs on consumer and industrial goods—and retaliations are reaching greater and greater heights:
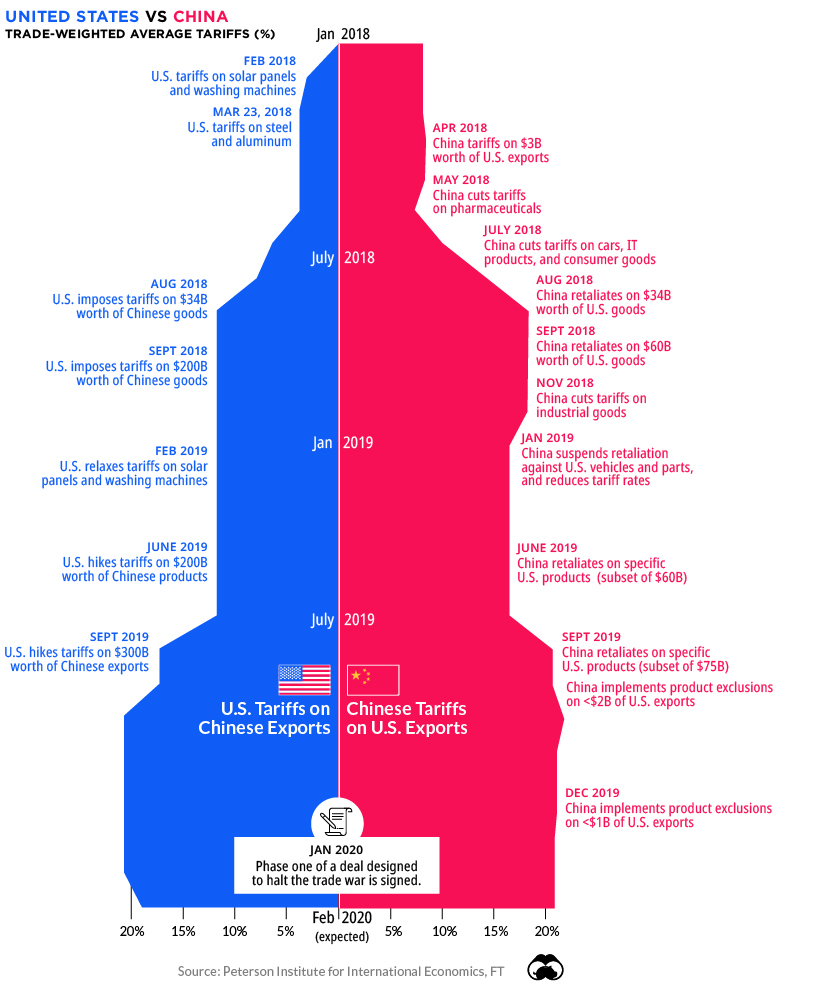
While a delicate truce has been reached at the moment, the trade war has caused a significant drag on global growth, and the World Bank estimates it will continue to have an effect into 2021.
At the same time, China’s sphere of influence continues to grow.
One Belt, One Road, One Trade Direction?
China seems to have a finger in every pie. The nation is financing a flurry of megaprojects across Asia and Africa—but one broader initiative stands above the rest.
China’s “One Belt, One Road” (OBOR) Initiative, planned for a 2049 completion, is advancing at a furious pace. In 2019 alone, Chinese companies signed contracts worth up to $128 billion to start Chinese large-scale infrastructure projects in various countries.
While building new highways and ports abroad is beneficial for Chinese financiers, OBOR is also about creating new markets and trade routes for Chinese goods in Asia. Recent research found that the OBOR program’s infrastructure expansion and logistics performance improvements led to positive effects on China’s exports.
Nevertheless, it’s clear the new infrastructure network is already transforming global trade, possibly cementing China’s position as the world’s major trading partner for years to come.


Markets
U.S. Debt Interest Payments Reach $1 Trillion
U.S. debt interest payments have surged past the $1 trillion dollar mark, amid high interest rates and an ever-expanding debt burden.


U.S. Debt Interest Payments Reach $1 Trillion
This was originally posted on our Voronoi app. Download the app for free on iOS or Android and discover incredible data-driven charts from a variety of trusted sources.
The cost of paying for America’s national debt crossed the $1 trillion dollar mark in 2023, driven by high interest rates and a record $34 trillion mountain of debt.
Over the last decade, U.S. debt interest payments have more than doubled amid vast government spending during the pandemic crisis. As debt payments continue to soar, the Congressional Budget Office (CBO) reported that debt servicing costs surpassed defense spending for the first time ever this year.
This graphic shows the sharp rise in U.S. debt payments, based on data from the Federal Reserve.
A $1 Trillion Interest Bill, and Growing
Below, we show how U.S. debt interest payments have risen at a faster pace than at another time in modern history:
| Date | Interest Payments | U.S. National Debt |
|---|---|---|
| 2023 | $1.0T | $34.0T |
| 2022 | $830B | $31.4T |
| 2021 | $612B | $29.6T |
| 2020 | $518B | $27.7T |
| 2019 | $564B | $23.2T |
| 2018 | $571B | $22.0T |
| 2017 | $493B | $20.5T |
| 2016 | $460B | $20.0T |
| 2015 | $435B | $18.9T |
| 2014 | $442B | $18.1T |
| 2013 | $425B | $17.2T |
| 2012 | $417B | $16.4T |
| 2011 | $433B | $15.2T |
| 2010 | $400B | $14.0T |
| 2009 | $354B | $12.3T |
| 2008 | $380B | $10.7T |
| 2007 | $414B | $9.2T |
| 2006 | $387B | $8.7T |
| 2005 | $355B | $8.2T |
| 2004 | $318B | $7.6T |
| 2003 | $294B | $7.0T |
| 2002 | $298B | $6.4T |
| 2001 | $318B | $5.9T |
| 2000 | $353B | $5.7T |
| 1999 | $353B | $5.8T |
| 1998 | $360B | $5.6T |
| 1997 | $368B | $5.5T |
| 1996 | $362B | $5.3T |
| 1995 | $357B | $5.0T |
| 1994 | $334B | $4.8T |
| 1993 | $311B | $4.5T |
| 1992 | $306B | $4.2T |
| 1991 | $308B | $3.8T |
| 1990 | $298B | $3.4T |
| 1989 | $275B | $3.0T |
| 1988 | $254B | $2.7T |
| 1987 | $240B | $2.4T |
| 1986 | $225B | $2.2T |
| 1985 | $219B | $1.9T |
| 1984 | $205B | $1.7T |
| 1983 | $176B | $1.4T |
| 1982 | $157B | $1.2T |
| 1981 | $142B | $1.0T |
| 1980 | $113B | $930.2B |
| 1979 | $96B | $845.1B |
| 1978 | $84B | $789.2B |
| 1977 | $69B | $718.9B |
| 1976 | $61B | $653.5B |
| 1975 | $55B | $576.6B |
| 1974 | $50B | $492.7B |
| 1973 | $45B | $469.1B |
| 1972 | $39B | $448.5B |
| 1971 | $36B | $424.1B |
| 1970 | $35B | $389.2B |
| 1969 | $30B | $368.2B |
| 1968 | $25B | $358.0B |
| 1967 | $23B | $344.7B |
| 1966 | $21B | $329.3B |
Interest payments represent seasonally adjusted annual rate at the end of Q4.
At current rates, the U.S. national debt is growing by a remarkable $1 trillion about every 100 days, equal to roughly $3.6 trillion per year.
As the national debt has ballooned, debt payments even exceeded Medicaid outlays in 2023—one of the government’s largest expenditures. On average, the U.S. spent more than $2 billion per day on interest costs last year. Going further, the U.S. government is projected to spend a historic $12.4 trillion on interest payments over the next decade, averaging about $37,100 per American.
Exacerbating matters is that the U.S. is running a steep deficit, which stood at $1.1 trillion for the first six months of fiscal 2024. This has accelerated due to the 43% increase in debt servicing costs along with a $31 billion dollar increase in defense spending from a year earlier. Additionally, a $30 billion increase in funding for the Federal Deposit Insurance Corporation in light of the regional banking crisis last year was a major contributor to the deficit increase.
Overall, the CBO forecasts that roughly 75% of the federal deficit’s increase will be due to interest costs by 2034.

-

 Technology2 weeks ago
Ranked: The Most Popular Smartphone Brands in the U.S.
-

 Automotive1 week ago
Almost Every EV Stock is Down After Q1 2024
-

 Money1 week ago
Where Does One U.S. Tax Dollar Go?
-

 Green2 weeks ago
Ranked: Top Countries by Total Forest Loss Since 2001
-

 Real Estate2 weeks ago
Visualizing America’s Shortage of Affordable Homes
-

 Maps2 weeks ago
Mapped: Average Wages Across Europe
-

 Mining2 weeks ago
Charted: The Value Gap Between the Gold Price and Gold Miners
-

 Demographics2 weeks ago
Visualizing the Size of the Global Senior Population