Investor Education
China: An Investment Opportunity Too Big To Ignore
Since the implementation of the initial Open Door Policy in 1978, China has experienced rapid development—making it the world’s second largest economy in nominal terms.
In the next year, the country will move into the next phase of opening up its economy by lifting restrictions on the foreign ownership of securities, insurance, and fund management firms, and this will make the economy more accessible to the outside world than ever before.
An Opportunity Too Big To Ignore
Today’s infographic from BlackRock explores the steps China’s markets have taken to attract foreign capital on a global scale.
China’s moves are funding the nation’s next stage of growth, and are also creating new investment opportunities for foreign investors.

The China Investment Opportunity
Currently, foreign investors hold just 3% of total Chinese securities, despite the country having the world’s second largest stock and bond market globally.
As the onshore equity and fixed income markets open up, investors have the opportunity to gain exposure to more sectors, particularly those that focus on the domestic economy.
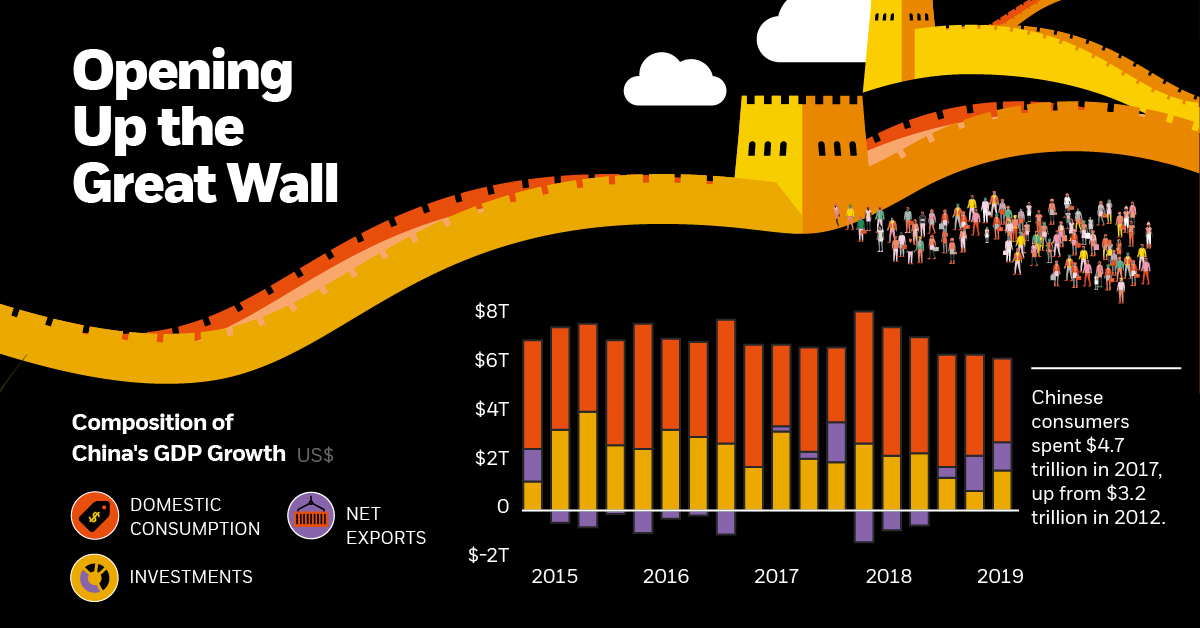
China’s large consumption base of 1.3 billion consumers is a powerful engine of growth, with consumer spending increasing to $4.7 trillion in 2017, from $3.2 trillion in 2012.
Ensuring Sustainable Growth
There are structural reform gaps that need to be addressed in order to ensure China’s growth is sustainable.
These reforms, which seek to correct imbalances caused by uneven economic growth, cover many areas of the economy. They affect the government, as well as corporate, financial and household sectors.
Some of these key reforms include:
- Capital reallocation: Debt reduction and interest rate liberalisation
- Income redistribution: Property, household and corporate tax reduction
- Market regulation: Supply-side reform and environmental protection
- Institutional framework: Intellectual property protection, and reformation of the hukou— China’s registration program, which serves to regulate population distribution and rural-to-urban migration
With 22 reforms currently in progress, the long-term impact is expected to be tremendously positive for growth.
Opening Up the Great Wall
China has shown great support for economic globalisation, and has already been making strides to open its markets to the rest of the world.
- 2002: Qualified Foreign Institutional Investor (QFII) scheme launches
- 2011: Renminbi Qualified Foreign Institutional Investor (RQFII) scheme launches
- 2014: Shanghai/Hong Kong Stock Connect launches
- 2016: Shenzhen/Hong Kong Stock Connect launches
- 2017: Bond Connect scheme launches
- 2018: MSCI announces 20% inclusion factor of A-shares
- 2019: Bloomberg Barclays Global Aggregate Index begins including yuan-denominated bonds
- 2020: JPMorgan Chase & Co. plans to add Chinese government debt to index
These index inclusions will result in a substantial inflow of new investor funds. According to Goldman Sachs, Bloomberg’s decision to increase the weighting of Renminbi-denominated government and policy bank securities in the Bloomberg Barclays Global Aggregate Index could attract between $120-$150 billion in new investments into Chinese debt markets.
New China vs. Old China
China has transformed from an export-driven and rural country, into a global manufacturing and technology superpower.
Foreign direct investment (FDI) inflows into China’s tech sector have been rising significantly, and currently account for almost a third of total FDI.
China already has the world’s largest robot market, and the government is actively promoting the robotics industry with tax reductions and special R&D funding.
—Victoria Mio, CIO Chinese Equities, Robeco
China’s ambitious “Made in China 2025” ten year plan will lower its dependency on imported technology and make China a dominant player in global technology manufacturing.
An Economic Force To Be Reckoned With
China will inevitably face challenges as it proceeds to lead global economic growth. However, its changing economy is creating a new landscape of opportunity for potential growth, and may continue to do so for the coming years.
The continuous expansion of market access, combined with new policies that promote foreign investment, have helped improve investor confidence. If foreign investors exclude China from their portfolio, they risk missing out on the huge potential of this rapidly expanding market.


Investor Education
How MSCI Builds Thematic Indexes: A Step-by-Step Guide
From developing an index objective to choosing relevant stocks, this graphic breaks down how MSCI builds thematic indexes using examples.


How MSCI Builds Thematic Indexes: A Step-by-Step Guide
Have you ever wondered how MSCI builds its thematic indexes?
To capture long-term, structural trends that could drive business performance in the future, the company follows a systematic approach. This graphic from MSCI breaks down each step in the process used to create its thematic indexes.
Step 1: Develop an Index Objective
MSCI first builds a broad statement of what the theme aims to capture based on extensive research and insights from industry experts.
Steps 2 and 3: List Sub-Themes, Generate Keyword List
Together with experts, MSCI creates a list of sub-themes or “seedwords” to identify aligned business activities.
The team then assembles a collection of suitable documents describing the theme. Natural language processing efficiently analyzes word frequency and relevance to generate a more detailed set of keywords contextually similar to the seedwords.
Step 4: Find Relevant Companies
By analyzing financial reports, MSCI picks companies relevant to the theme using two methods:
- Direct approach: Revenue from a company’s business segment is considered 100% relevant if the segment name matches a theme keyword. Standard Industrial Classification (SIC) codes from these directly-matched segments make up the eligible SIC code list used in the indirect approach.
- Indirect approach: If a segment name doesn’t match theme keywords, MSCI will:
- Analyze the density of theme keywords mentioned in the company’s description. A minimum of two unique keywords is required.
- The keyword density determines a “discount factor” to reflect lower certainty in theme alignment.
- Revenue from business segments with an eligible SIC code, regardless of how they are named, is scaled down by the discount factor.
The total percentage of revenue applicable to the theme from both approaches determines a company’s relevance score.
Step 5: Select the Stocks
Finally, MSCI narrows down the stocks that will be included:
- Global parent universe: The ACWI Investable Market Index (IMI) is the starting point for standard thematic indexes.
- Relevance filter: The universe is filtered for companies with a relevance score of at least 25%.
- False positive control: Eligible companies that are mapped to un-related GICS sub-industries are removed.
Companies with higher relevance scores and market caps have a higher weighting in the index, with the maximum weighting for any one issuer capped at 5%. The final selected stocks span various sectors.
MSCI Thematic Indexes: Regularly Updated and Rules-Based
Once an index is built, it is reviewed semi-annually and updated based on:
- Changes to the parent index
- Changes at individual companies
- Theme developments based on expert input
Theme keywords are reviewed yearly in May. Overall, MSCI’s thematic index construction process is objective, scalable, and flexible. The process can be customized based on the theme(s) you want to capture.
Learn more about MSCI’s thematic indexes.

-

 Investor Education6 months ago
The 20 Most Common Investing Mistakes, in One Chart
Here are the most common investing mistakes to avoid, from emotionally-driven investing to paying too much in fees.
-

 Stocks10 months ago
Visualizing BlackRock’s Top Equity Holdings
BlackRock is the world’s largest asset manager, with over $9 trillion in holdings. Here are the company’s top equity holdings.
-

 Investor Education11 months ago
10-Year Annualized Forecasts for Major Asset Classes
This infographic visualizes 10-year annualized forecasts for both equities and fixed income using data from Vanguard.
-

 Investor Education1 year ago
Visualizing 90 Years of Stock and Bond Portfolio Performance
How have investment returns for different portfolio allocations of stocks and bonds compared over the last 90 years?
-

 Debt2 years ago
Countries with the Highest Default Risk in 2022
In this infographic, we examine new data that ranks the top 25 countries by their default risk.
-

 Markets2 years ago
The Best Months for Stock Market Gains
This infographic analyzes over 30 years of stock market performance to identify the best and worst months for gains.


-

 Markets1 week ago
U.S. Debt Interest Payments Reach $1 Trillion
-

 Markets2 weeks ago
Ranked: The Most Valuable Housing Markets in America
-

 Money2 weeks ago
Which States Have the Highest Minimum Wage in America?
-

 AI2 weeks ago
Ranked: Semiconductor Companies by Industry Revenue Share
-

 Markets2 weeks ago
Ranked: The World’s Top Flight Routes, by Revenue
-

 Countries2 weeks ago
Population Projections: The World’s 6 Largest Countries in 2075
-

 Markets2 weeks ago
The Top 10 States by Real GDP Growth in 2023
-

 Money2 weeks ago
The Smallest Gender Wage Gaps in OECD Countries