Datastream
China Displaces U.S. as the EU’s Largest Trade Partner


The Briefing
- In a pandemic year, the U.S. has lost out as the EU’s top trading partner
- The EU trade relationship with China has grown towards €586B ($709B) in 2020, compared to €554B ($671B) with the U.S.
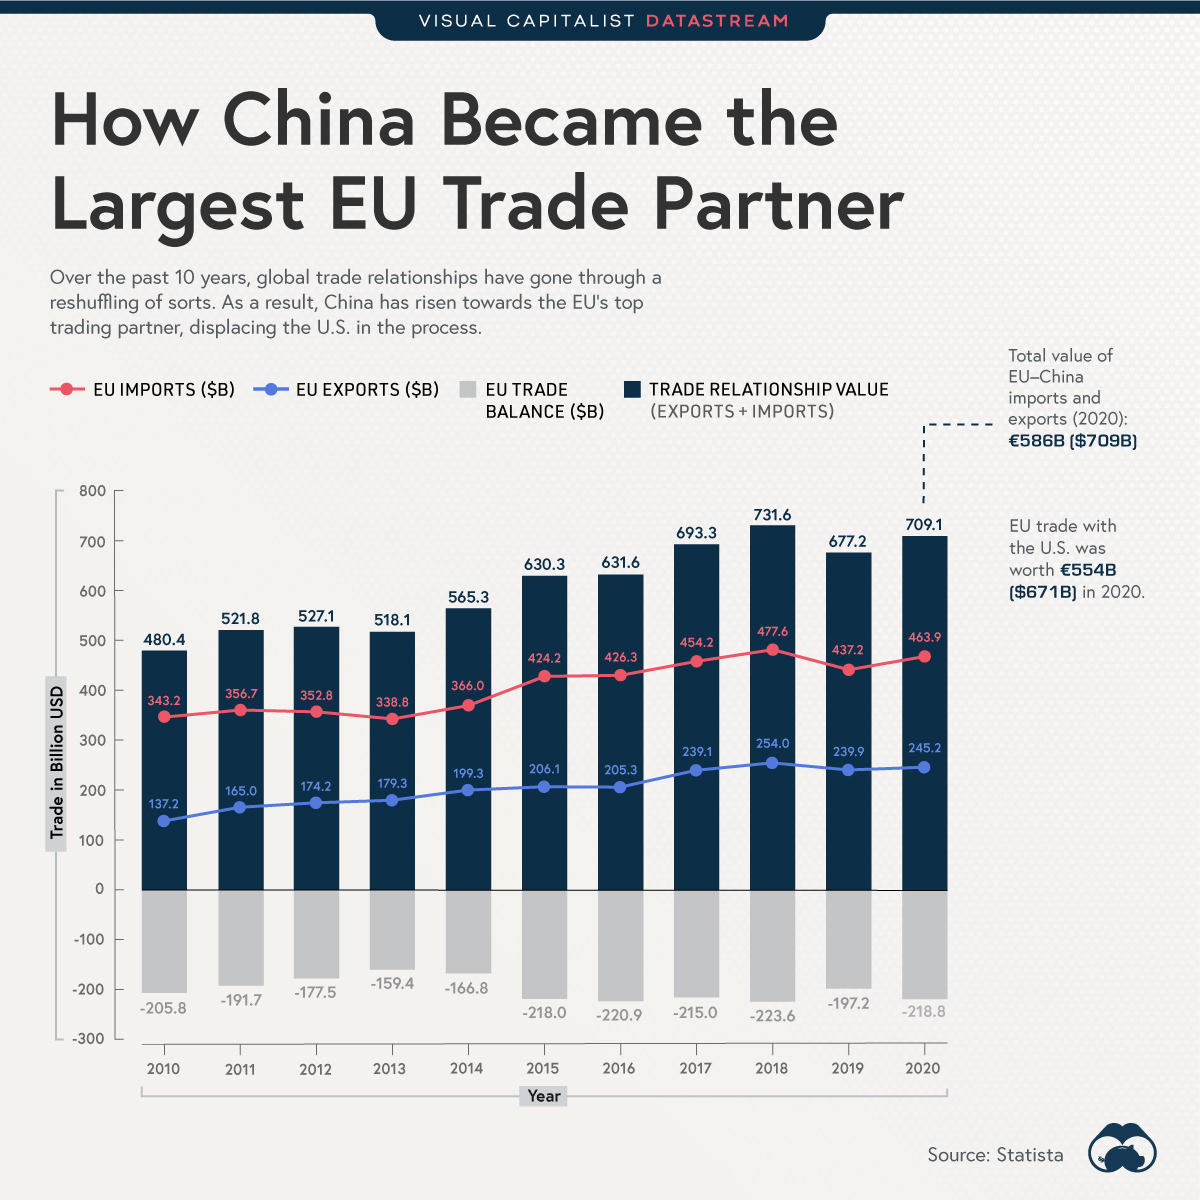
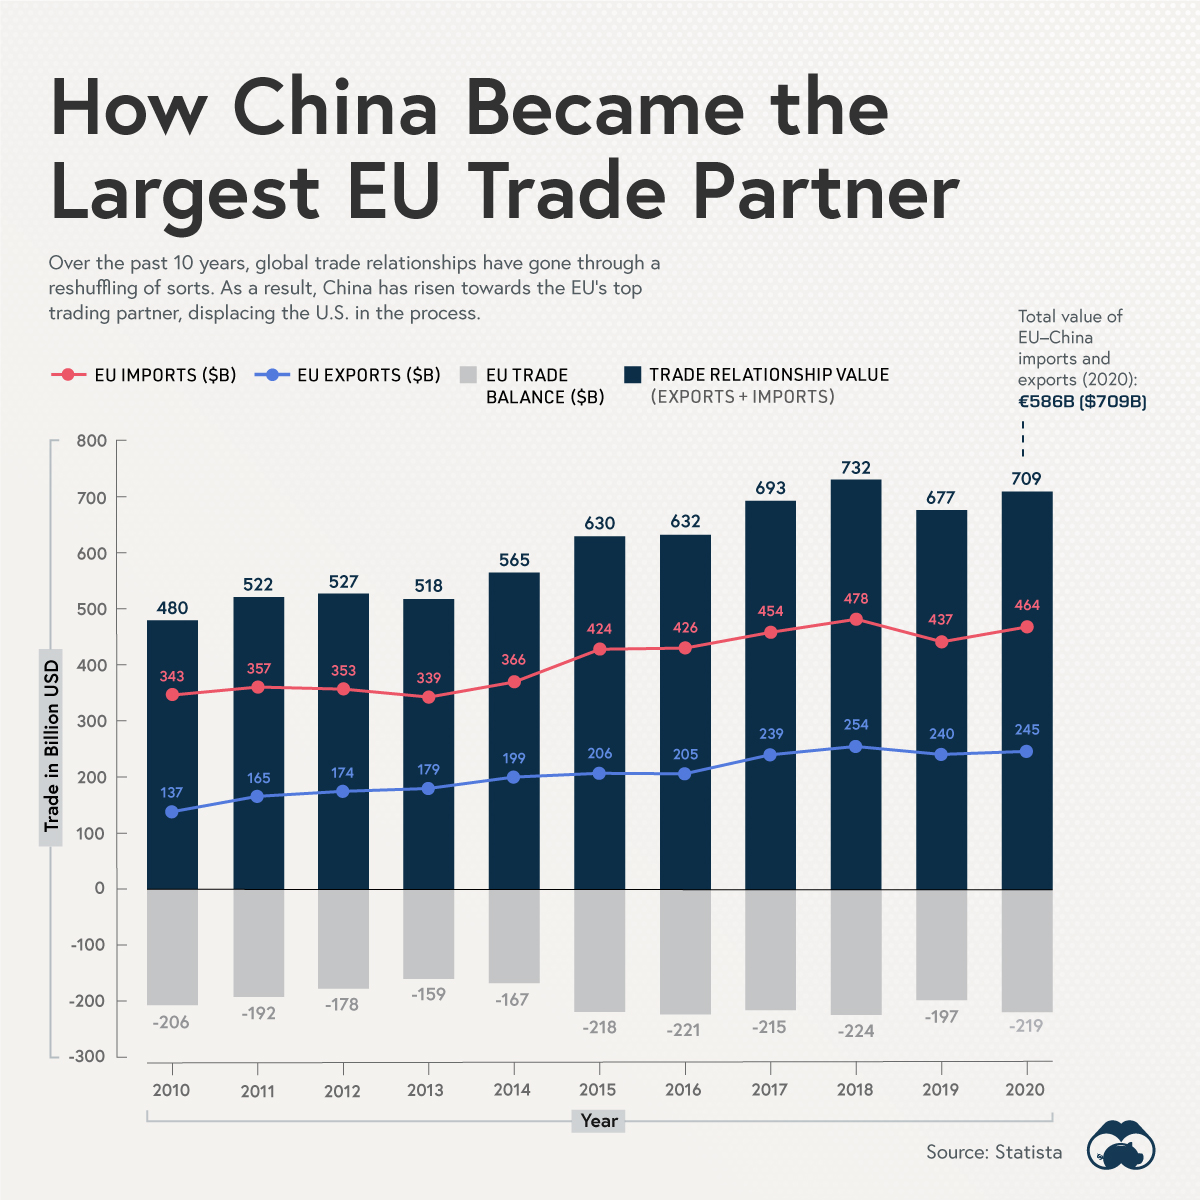
How China Became the Largest EU Trade Partner
Historically, America has long been the EU’s top country to trade with, but in 2020, that trend came to a screeching halt.
A $26.7 billion boost for Chinese imports, in addition to a $5.3 billion increase in EU exports, has resulted in China officially becoming the EU’s largest trade partner.
This data looks at a decade of growing trade between the EU and China.
| Year | Imports from China ($B) | Exports to China ($B) | Total Trade Value ($B) |
|---|---|---|---|
| 2020 | 463.9 | 245.1 | 709.1 |
| 2019 | 437.1 | 239.9 | 677.2 |
| 2018 | 477.5 | 253.9 | 731.6 |
| 2017 | 454.2 | 239.0 | 693.3 |
| 2016 | 426.2 | 205.3 | 631.6 |
| 2015 | 424.2 | 206.0 | 630.3 |
| 2014 | 366.0 | 199.2 | 565.3 |
| 2013 | 338.8 | 179.3 | 518.1 |
| 2012 | 352.8 | 174.2 | 527.1 |
| 2011 | 356.7 | 165.0 | 521.8 |
| 2010 | 343.1 | 137.2 | 480.4 |
Playing Catch Up
Displacing the U.S. as a trade partner serves as yet another reminder that China is playing catch up to America’s economy. In 2020, there was an approximate $5.6 trillion gap in nominal GDP between the two nations. A decade ago, the gap was larger at $9 trillion.
The gap continues to shrink due to the differing growth rates in GDP. Between 2010-2020, U.S. nominal GDP growth was in the 1-2% range. During the same time, China’s GDP growth ranged from a high of 10.6% to a low of 6.1%.
An Economic Love Story
If you’re counting on China to run out of stuff to sell, don’t hold your breath. China is a manufacturing titan, and has become a top trading partner of 128 countries. EU imports from China grew 35% in the last decade, and overall imports were worth around $463 billion in 2020.
The EU buys much more from China than what it sells. Exports valued at $245 billion make up just over half (52%) of what it imports. As a result, the EU has a ballooning trade deficit.
Past Rivals
Challenging the U.S. for the economic throne is hardly a new endeavor. In the post-WWII era, Japan experienced a similar economic trajectory. And at the time, concerns about Japan surpassing America were alive and well. At one point, Japanese equities collectively represented some 46% of global stock market capitalization, and the value of the Imperial Palace in Tokyo was notionally worth more than all the real estate in California.
But eventually things began to subside, and a new challenger in China emerged. Today, China is experiencing similar milestones that hint at a growing economic power. Such as Beijing becoming the top city for global billionaires.
Will the 21st century mimic the 20th? Or will we witness the U.S. fall from the top of the economic food chain?
Where does this data come from?
Source: Statista
Notes: Data published on April 1, 2021


Datastream
Can You Calculate Your Daily Carbon Footprint?
Discover how the average person’s carbon footprint impacts the environment and learn how carbon credits can offset your carbon footprint.


The Briefing
- A person’s carbon footprint is substantial, with activities such as food consumption creating as much as 4,500 g of CO₂ emissions daily.
- By purchasing carbon credits from Carbon Streaming Corporation, you can offset your own emissions and fund positive climate action.
Your Everyday Carbon Footprint
While many large businesses and countries have committed to net-zero goals, it is essential to acknowledge that your everyday activities also contribute to global emissions.
In this graphic, sponsored by Carbon Streaming Corporation, we will explore how the choices we make and the products we use have a profound impact on our carbon footprint.
Carbon Emissions by Activity
Here are some of the daily activities and products of the average person and their carbon footprint, according to Clever Carbon.
| Household Activities & Products | CO2 Emissions (g) |
|---|---|
| 💡 Standard Light Bulb (100 watts, four hours) | 172 g |
| 📱 Mobile Phone Use (195 minutes per day)* | 189 g |
| 👕 Washing Machine (0.63 kWh) | 275 g |
| 🔥 Electric Oven (1.56 kWh) | 675 g |
| ♨️ Tumble Dryer (2.5 kWh) | 1,000 g |
| 🧻 Toilet Roll (2 ply) | 1,300 g |
| 🚿 Hot Shower (10 mins) | 2,000 g |
| 🚙 Daily Commute (one hour, by car) | 3,360 g |
| 🍽️ Average Daily Food Consumption (three meals of 600 calories) | 4,500 g |
| *Phone use based on yearly use of 69kg per the source, Reboxed | |
Your choice of transportation plays a crucial role in determining your carbon footprint. For instance, a 15 km daily commute to work on public transport generates an average of 1,464 g of CO₂ emissions. Compared to 3,360 g—twice the volume for a journey the same length by car.
By opting for more sustainable modes of transport, such as cycling, walking, or public transportation, you can significantly reduce your carbon footprint.
Addressing Your Carbon Footprint
One way to compensate for your emissions is by purchasing high-quality carbon credits.
Carbon credits are used to help fund projects that avoid, reduce or remove CO₂ emissions. This includes nature-based solutions such as reforestation and improved forest management, or technology-based solutions such as the production of biochar and carbon capture and storage (CCS).
While carbon credits offer a potential solution for individuals to help reduce global emissions, public awareness remains a significant challenge. A BCG-Patch survey revealed that only 34% of U.S. consumers are familiar with carbon credits, and only 3% have purchased them in the past.
About Carbon Streaming
By financing the creation or expansion of carbon projects, Carbon Streaming Corporation secures the rights to future carbon credits generated by these sustainable projects. You can then purchase these carbon credits to help fund climate solutions around the world and compensate for your own emissions.
Ready to get involved?
>> Learn more about purchasing carbon credits at Carbon Streaming

-

 Maps2 weeks ago
Mapped: Average Wages Across Europe
-

 Money1 week ago
Which States Have the Highest Minimum Wage in America?
-

 Real Estate1 week ago
Ranked: The Most Valuable Housing Markets in America
-

 Markets1 week ago
Charted: Big Four Market Share by S&P 500 Audits
-

 AI1 week ago
The Stock Performance of U.S. Chipmakers So Far in 2024
-

 Automotive2 weeks ago
Almost Every EV Stock is Down After Q1 2024
-

 Money2 weeks ago
Where Does One U.S. Tax Dollar Go?
-

 Green2 weeks ago
Ranked: Top Countries by Total Forest Loss Since 2001