Markets
Charted: Tesla’s Unrivaled Profit Margins
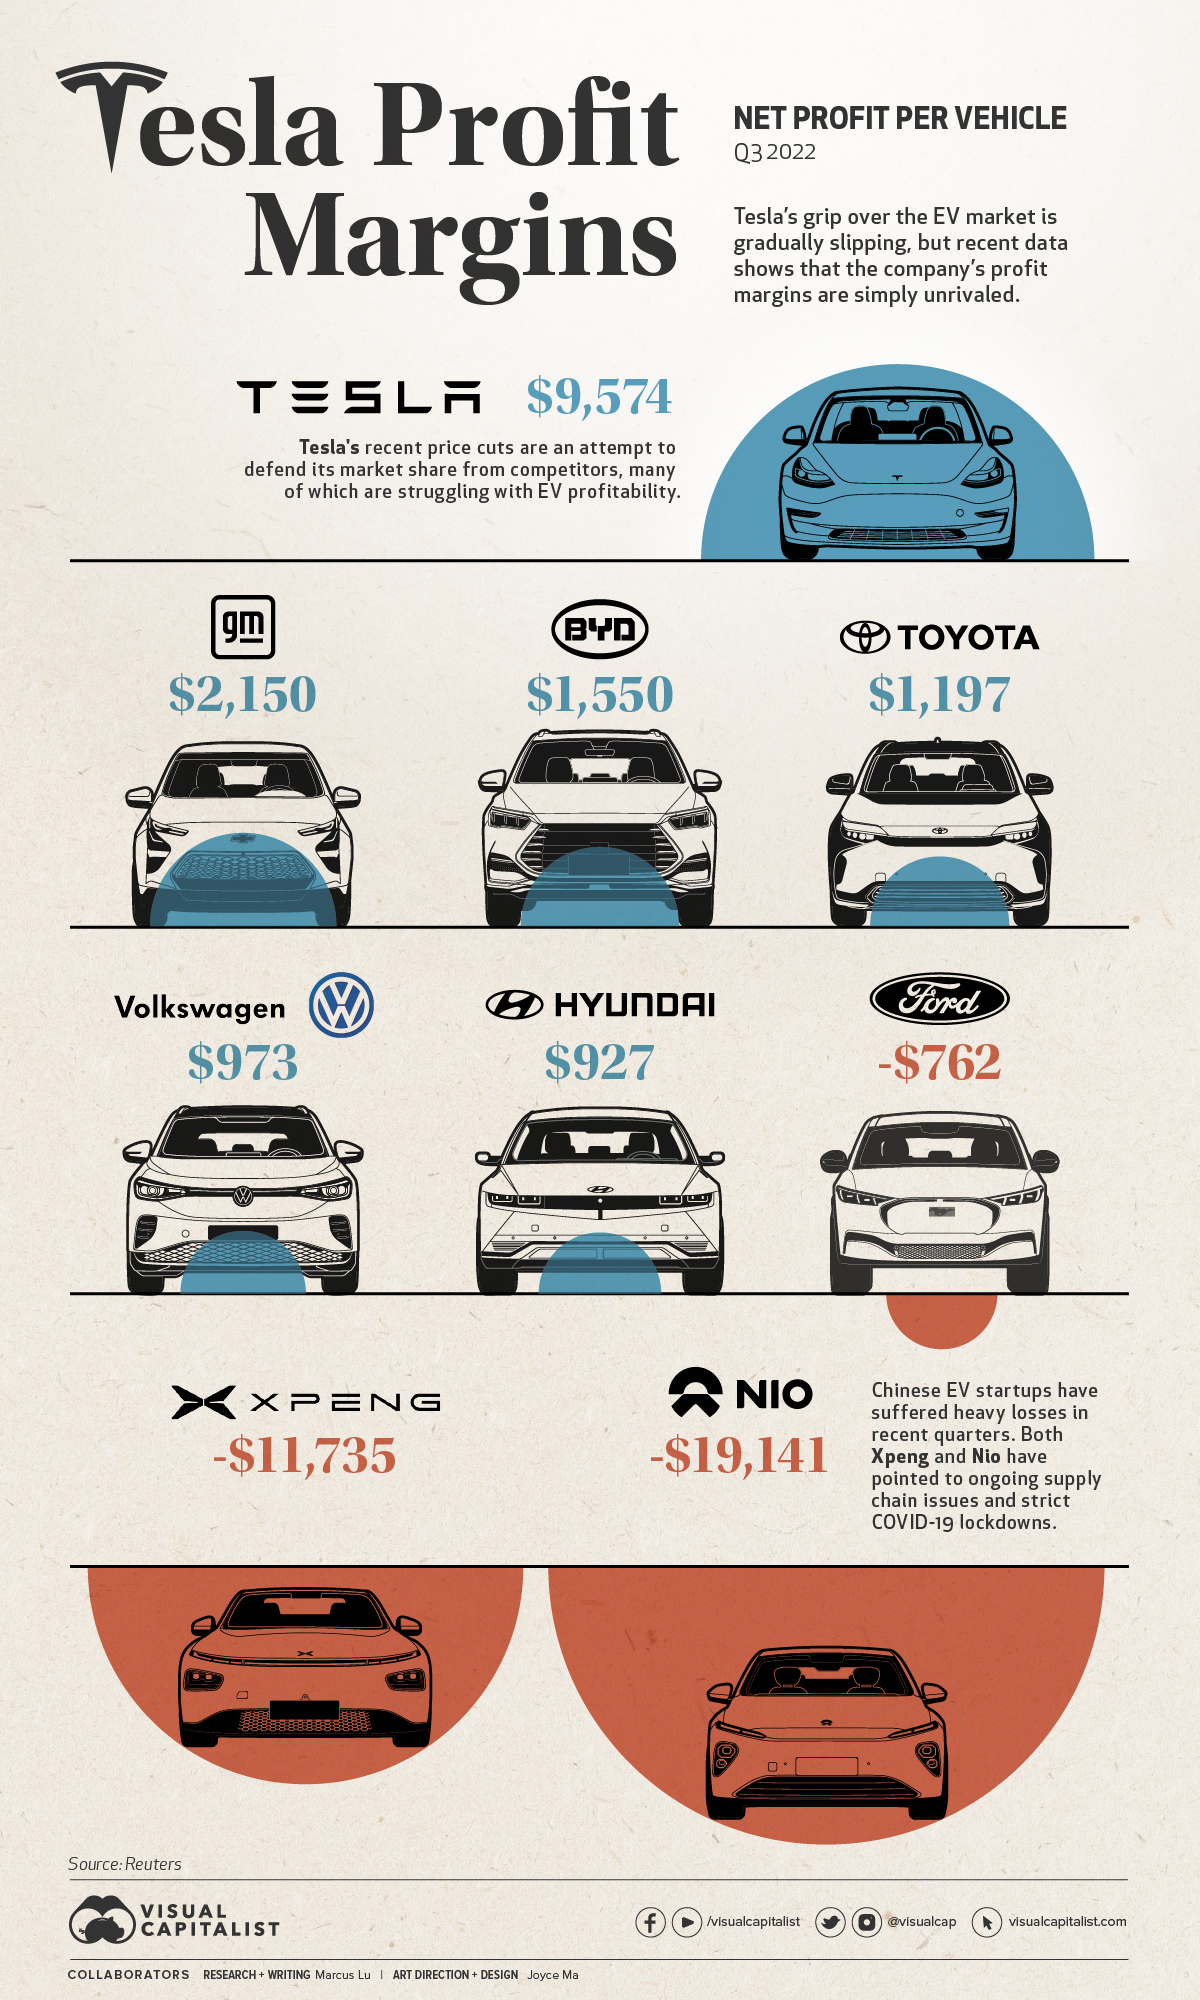


Chart: Tesla’s Unrivaled Profit Margins
In January this year, Tesla made the surprising announcement that it would be cutting prices on its vehicles by as much as 20%.
While price cuts are not new in the automotive world, they are for Tesla. The company, which historically has been unable to keep up with demand, has seen its order backlog shrink from 476,000 units in July 2022, to 74,000 in December 2022.
This has been attributed to Tesla’s robust production growth, which saw 2022 production increase 41% over 2021 (from 930,422 to 1,313,851 units).
With the days of “endless” demand seemingly over, Tesla is going on the offensive by reducing its prices—a move that puts pressure on competitors, but has also angered existing owners.
Cranking up the Heat
Tesla’s price cuts are an attempt to protect its market share, but they’re not exactly the desperation move some media outlets have claimed them to be.
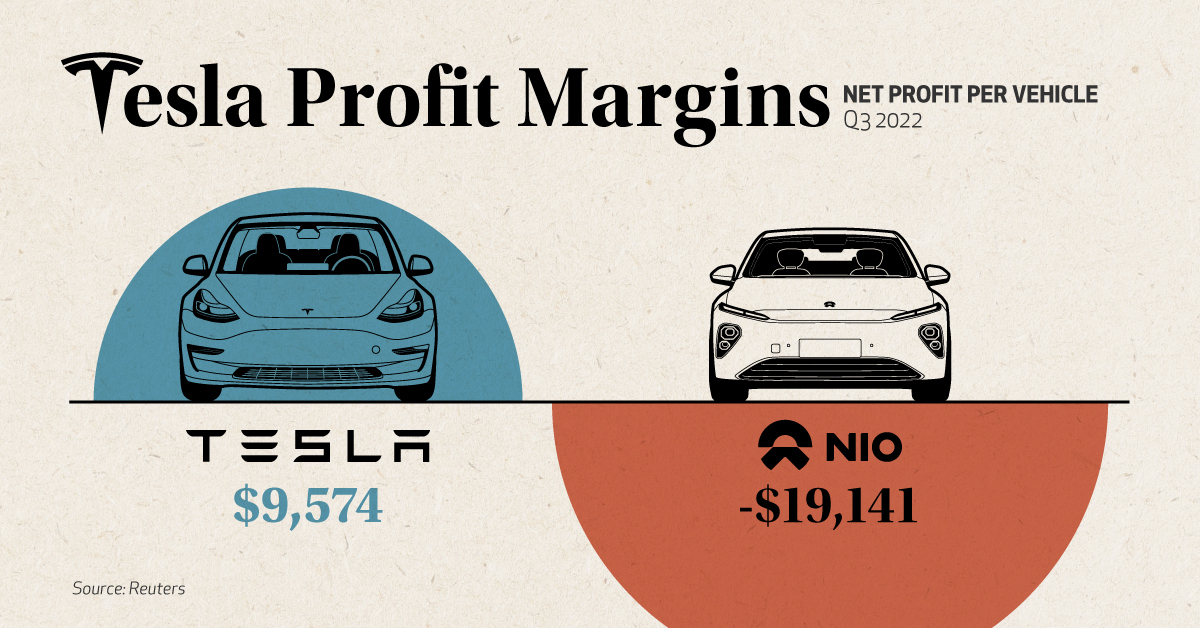
Recent data compiled by Reuters shows that Tesla’s margins are significantly higher than those of its rivals, both in terms of gross and net profit. Our graphic only illustrates the net figures, but gross profits are also included in the table below.
| Company | Gross profit per car | Net profit per car |
|---|---|---|
| 🇺🇸 Tesla | $15,653 | $9,574 |
| 🇺🇸 GM | $3,818 | $2,150 |
| 🇨🇳 BYD | $5,456 | $1,550 |
| 🇯🇵 Toyota | $3,925 | $1,197 |
| 🇩🇪 VW | $6,034 | $973 |
| 🇰🇷 Hyundai | $5,362 | $927 |
| 🇺🇸 Ford | $3,115 | -$762 |
| 🇨🇳 Xpeng | $4,565 | -$11,735 |
| 🇨🇳 Nio | $8,036 | -$19,141 |
Data from Q3 2022
Price cutting has its drawbacks, but one could argue that the benefits for Tesla are worth it based on this data—especially in a critical market like China.
Tesla has taken the nuclear option to bully the weaker, thin margin players off the table.
– Bill Russo, Automobility
In the case of Chinese EV startups Xpeng and Nio, net profits are non-existent, meaning it’s unlikely they’ll be able to match Tesla’s reductions in price. Both firms have reported year-on-year sales declines in January.
As for Tesla, Chinese media outlets have claimed that the firm received 30,000 orders within three days of its price cut announcement. Note that this hasn’t been officially confirmed by anyone within the company.
Tit for Tat
Ford made headlines recently for announcing its own price cuts on the Mustang Mach-E electric SUV. The model is a direct competitor to Tesla’s best-selling Model Y.
Chevrolet and Hyundai have also adjusted some of their EV prices in recent months, as listed in the following table.
| Model | Old Price | New Price | Discount |
|---|---|---|---|
| Tesla Model Y Long Range | $65,990 | $53,490 | 18.9% |
| Chevrolet Bolt EUV 2023 | $33,500 | $27,200 | 18.8% |
| Tesla Model Y Performance | $69,990 | $56,990 | 18.6% |
| Chevrolet Bolt 2023 | $31,600 | $26,500 | 16.1% |
| Tesla Model 3 Performance | $62,990 | $53,990 | 14.3% |
| Hyundai Kona Electric 2022 | $37,390 | $34,000 | 9.1% |
| Ford Mustang Mach-E GT Extended Range | $69,900 | $64,000 | 8.4% |
| Tesla Model 3 Long Range | $46,990 | $43,990 | 6.4% |
| Ford Mustang Mach-E Premium AWD | $57,675 | $53,995 | 6.4% |
| Ford Mustang Mach-E RWD Standard Range | $46,900 | $46,000 | 1.9% |
Source: Observer (Feb 2023)
Volkswagen is a noteworthy player missing from this table. The company has been gaining ground on Tesla, especially in the European market.
We have a clear pricing strategy and are focusing on reliability. We trust in the strength of our products and brands.
– Oliver Blume, CEO, VW Group
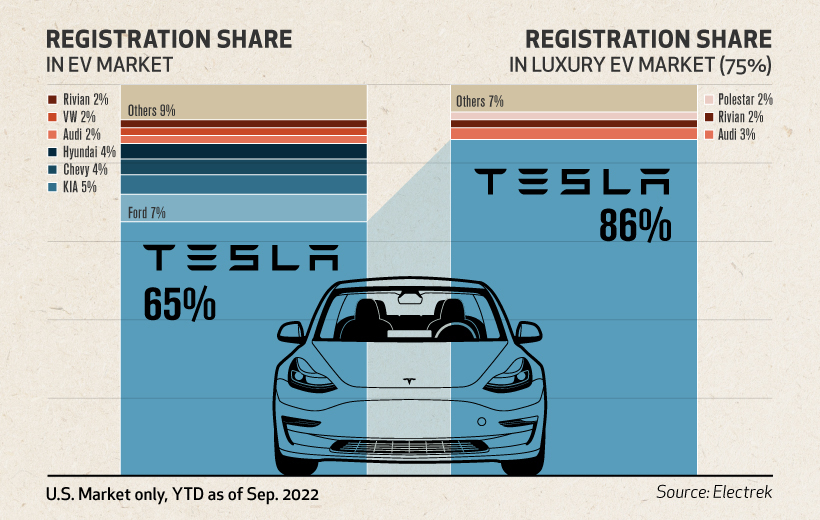
This decision could hamper Volkswagen’s goal of becoming a dominant player in EVs, especially if more automakers join Tesla in cutting prices. For now, Tesla still holds a strong grip on the US market.
Thanks, Elon
Recent Tesla buyers became outraged when the company announced it would be slashing prices on its cars. In China, buyers even staged protests at Tesla stores and delivery centers.
Recent buyers not only missed out on a better price, but their cars have effectively depreciated by the amount of the cut. This is a bitter turn of events, given Musk’s 2019 claims that a Tesla would be an appreciating asset.
I think the most profound thing is that if you buy a Tesla today, I believe you are buying an appreciating asset – not a depreciating asset.
– Elon Musk, CEO, Tesla
These comments were made in reference to Tesla’s full self-driving (FSD) capabilities, which Elon claimed would enable owners to turn their cars into robotaxis.


Markets
U.S. Debt Interest Payments Reach $1 Trillion
U.S. debt interest payments have surged past the $1 trillion dollar mark, amid high interest rates and an ever-expanding debt burden.


U.S. Debt Interest Payments Reach $1 Trillion
This was originally posted on our Voronoi app. Download the app for free on iOS or Android and discover incredible data-driven charts from a variety of trusted sources.
The cost of paying for America’s national debt crossed the $1 trillion dollar mark in 2023, driven by high interest rates and a record $34 trillion mountain of debt.
Over the last decade, U.S. debt interest payments have more than doubled amid vast government spending during the pandemic crisis. As debt payments continue to soar, the Congressional Budget Office (CBO) reported that debt servicing costs surpassed defense spending for the first time ever this year.
This graphic shows the sharp rise in U.S. debt payments, based on data from the Federal Reserve.
A $1 Trillion Interest Bill, and Growing
Below, we show how U.S. debt interest payments have risen at a faster pace than at another time in modern history:
| Date | Interest Payments | U.S. National Debt |
|---|---|---|
| 2023 | $1.0T | $34.0T |
| 2022 | $830B | $31.4T |
| 2021 | $612B | $29.6T |
| 2020 | $518B | $27.7T |
| 2019 | $564B | $23.2T |
| 2018 | $571B | $22.0T |
| 2017 | $493B | $20.5T |
| 2016 | $460B | $20.0T |
| 2015 | $435B | $18.9T |
| 2014 | $442B | $18.1T |
| 2013 | $425B | $17.2T |
| 2012 | $417B | $16.4T |
| 2011 | $433B | $15.2T |
| 2010 | $400B | $14.0T |
| 2009 | $354B | $12.3T |
| 2008 | $380B | $10.7T |
| 2007 | $414B | $9.2T |
| 2006 | $387B | $8.7T |
| 2005 | $355B | $8.2T |
| 2004 | $318B | $7.6T |
| 2003 | $294B | $7.0T |
| 2002 | $298B | $6.4T |
| 2001 | $318B | $5.9T |
| 2000 | $353B | $5.7T |
| 1999 | $353B | $5.8T |
| 1998 | $360B | $5.6T |
| 1997 | $368B | $5.5T |
| 1996 | $362B | $5.3T |
| 1995 | $357B | $5.0T |
| 1994 | $334B | $4.8T |
| 1993 | $311B | $4.5T |
| 1992 | $306B | $4.2T |
| 1991 | $308B | $3.8T |
| 1990 | $298B | $3.4T |
| 1989 | $275B | $3.0T |
| 1988 | $254B | $2.7T |
| 1987 | $240B | $2.4T |
| 1986 | $225B | $2.2T |
| 1985 | $219B | $1.9T |
| 1984 | $205B | $1.7T |
| 1983 | $176B | $1.4T |
| 1982 | $157B | $1.2T |
| 1981 | $142B | $1.0T |
| 1980 | $113B | $930.2B |
| 1979 | $96B | $845.1B |
| 1978 | $84B | $789.2B |
| 1977 | $69B | $718.9B |
| 1976 | $61B | $653.5B |
| 1975 | $55B | $576.6B |
| 1974 | $50B | $492.7B |
| 1973 | $45B | $469.1B |
| 1972 | $39B | $448.5B |
| 1971 | $36B | $424.1B |
| 1970 | $35B | $389.2B |
| 1969 | $30B | $368.2B |
| 1968 | $25B | $358.0B |
| 1967 | $23B | $344.7B |
| 1966 | $21B | $329.3B |
Interest payments represent seasonally adjusted annual rate at the end of Q4.
At current rates, the U.S. national debt is growing by a remarkable $1 trillion about every 100 days, equal to roughly $3.6 trillion per year.
As the national debt has ballooned, debt payments even exceeded Medicaid outlays in 2023—one of the government’s largest expenditures. On average, the U.S. spent more than $2 billion per day on interest costs last year. Going further, the U.S. government is projected to spend a historic $12.4 trillion on interest payments over the next decade, averaging about $37,100 per American.
Exacerbating matters is that the U.S. is running a steep deficit, which stood at $1.1 trillion for the first six months of fiscal 2024. This has accelerated due to the 43% increase in debt servicing costs along with a $31 billion dollar increase in defense spending from a year earlier. Additionally, a $30 billion increase in funding for the Federal Deposit Insurance Corporation in light of the regional banking crisis last year was a major contributor to the deficit increase.
Overall, the CBO forecasts that roughly 75% of the federal deficit’s increase will be due to interest costs by 2034.

-

 Green1 week ago
Ranked: The Countries With the Most Air Pollution in 2023
-

 Misc2 weeks ago
Almost Every EV Stock is Down After Q1 2024
-

 AI2 weeks ago
The Stock Performance of U.S. Chipmakers So Far in 2024
-

 Markets2 weeks ago
Charted: Big Four Market Share by S&P 500 Audits
-

 Real Estate2 weeks ago
Ranked: The Most Valuable Housing Markets in America
-

 Money2 weeks ago
Which States Have the Highest Minimum Wage in America?
-

 AI2 weeks ago
Ranked: Semiconductor Companies by Industry Revenue Share
-

 Travel2 weeks ago
Ranked: The World’s Top Flight Routes, by Revenue