Markets
Charted: Tesla’s Unrivaled Profit Margins
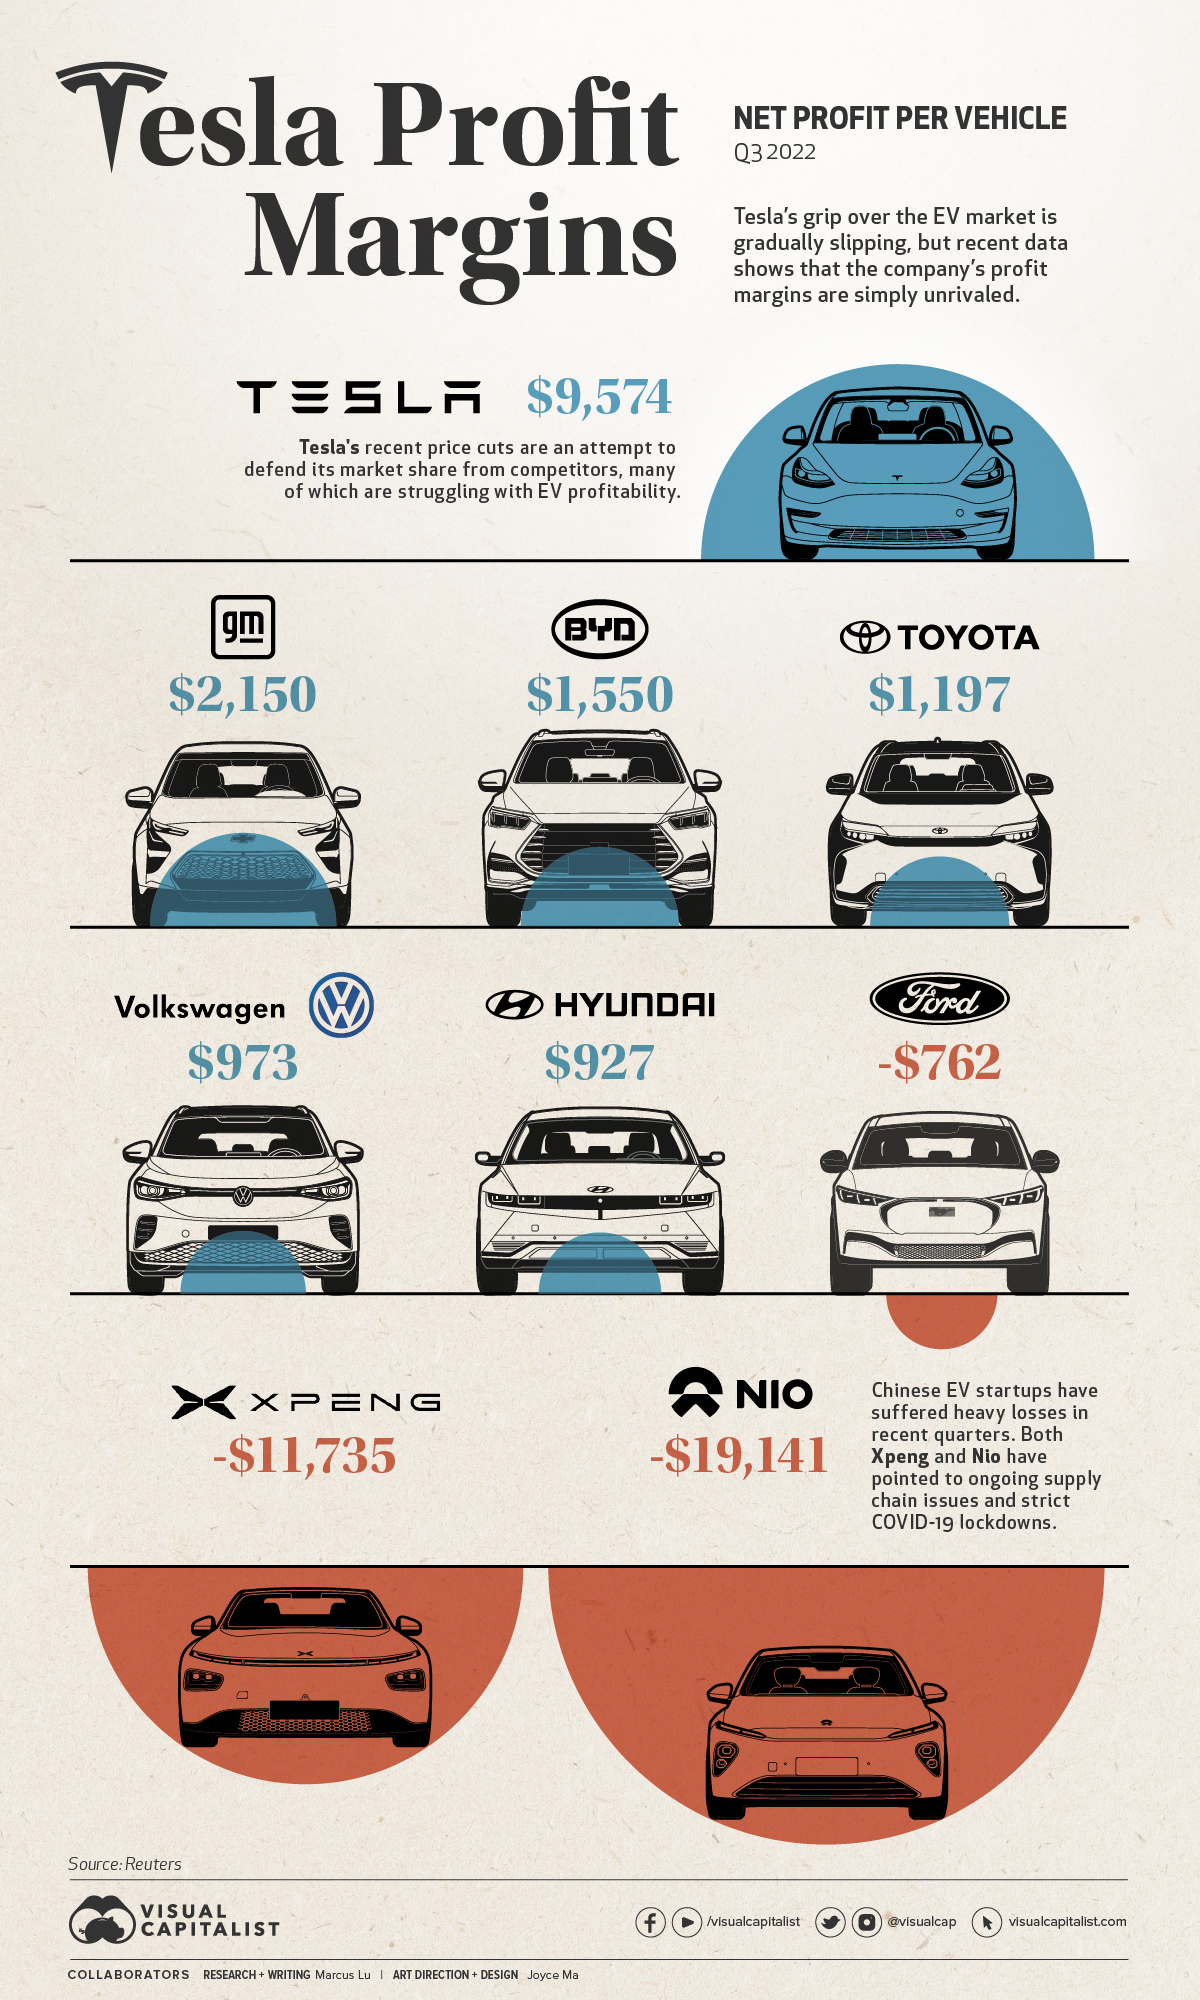


Chart: Tesla’s Unrivaled Profit Margins
In January this year, Tesla made the surprising announcement that it would be cutting prices on its vehicles by as much as 20%.
While price cuts are not new in the automotive world, they are for Tesla. The company, which historically has been unable to keep up with demand, has seen its order backlog shrink from 476,000 units in July 2022, to 74,000 in December 2022.
This has been attributed to Tesla’s robust production growth, which saw 2022 production increase 41% over 2021 (from 930,422 to 1,313,851 units).
With the days of “endless” demand seemingly over, Tesla is going on the offensive by reducing its prices—a move that puts pressure on competitors, but has also angered existing owners.
Cranking up the Heat
Tesla’s price cuts are an attempt to protect its market share, but they’re not exactly the desperation move some media outlets have claimed them to be.
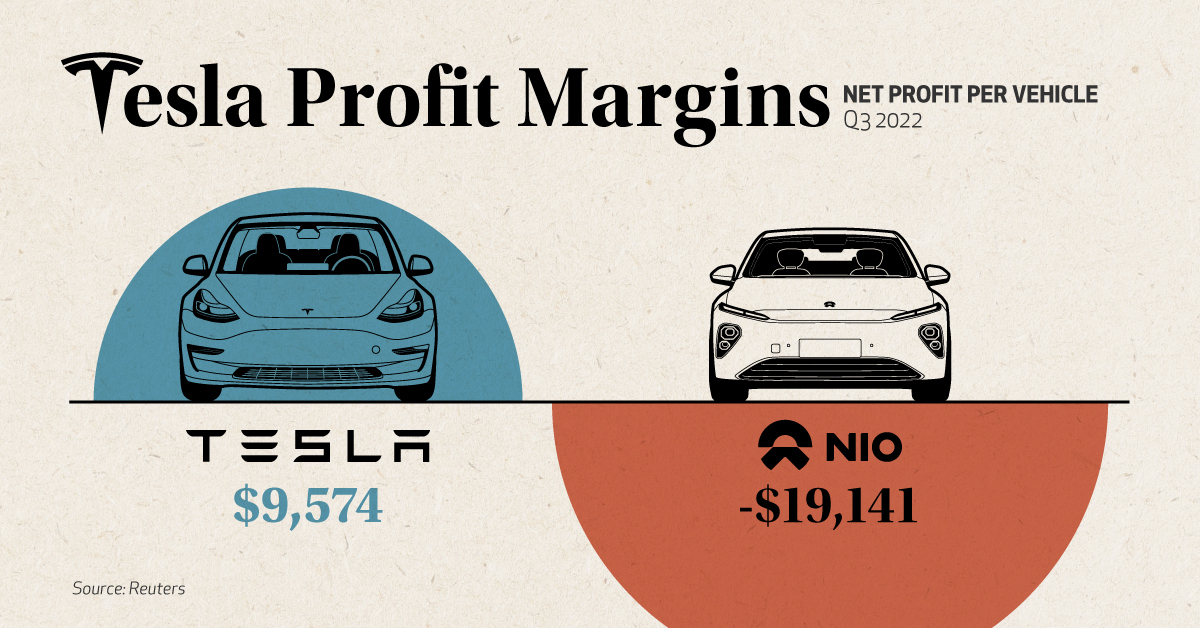
Recent data compiled by Reuters shows that Tesla’s margins are significantly higher than those of its rivals, both in terms of gross and net profit. Our graphic only illustrates the net figures, but gross profits are also included in the table below.
| Company | Gross profit per car | Net profit per car |
|---|---|---|
| 🇺🇸 Tesla | $15,653 | $9,574 |
| 🇺🇸 GM | $3,818 | $2,150 |
| 🇨🇳 BYD | $5,456 | $1,550 |
| 🇯🇵 Toyota | $3,925 | $1,197 |
| 🇩🇪 VW | $6,034 | $973 |
| 🇰🇷 Hyundai | $5,362 | $927 |
| 🇺🇸 Ford | $3,115 | -$762 |
| 🇨🇳 Xpeng | $4,565 | -$11,735 |
| 🇨🇳 Nio | $8,036 | -$19,141 |
Data from Q3 2022
Price cutting has its drawbacks, but one could argue that the benefits for Tesla are worth it based on this data—especially in a critical market like China.
Tesla has taken the nuclear option to bully the weaker, thin margin players off the table.
– Bill Russo, Automobility
In the case of Chinese EV startups Xpeng and Nio, net profits are non-existent, meaning it’s unlikely they’ll be able to match Tesla’s reductions in price. Both firms have reported year-on-year sales declines in January.
As for Tesla, Chinese media outlets have claimed that the firm received 30,000 orders within three days of its price cut announcement. Note that this hasn’t been officially confirmed by anyone within the company.
Tit for Tat
Ford made headlines recently for announcing its own price cuts on the Mustang Mach-E electric SUV. The model is a direct competitor to Tesla’s best-selling Model Y.
Chevrolet and Hyundai have also adjusted some of their EV prices in recent months, as listed in the following table.
| Model | Old Price | New Price | Discount |
|---|---|---|---|
| Tesla Model Y Long Range | $65,990 | $53,490 | 18.9% |
| Chevrolet Bolt EUV 2023 | $33,500 | $27,200 | 18.8% |
| Tesla Model Y Performance | $69,990 | $56,990 | 18.6% |
| Chevrolet Bolt 2023 | $31,600 | $26,500 | 16.1% |
| Tesla Model 3 Performance | $62,990 | $53,990 | 14.3% |
| Hyundai Kona Electric 2022 | $37,390 | $34,000 | 9.1% |
| Ford Mustang Mach-E GT Extended Range | $69,900 | $64,000 | 8.4% |
| Tesla Model 3 Long Range | $46,990 | $43,990 | 6.4% |
| Ford Mustang Mach-E Premium AWD | $57,675 | $53,995 | 6.4% |
| Ford Mustang Mach-E RWD Standard Range | $46,900 | $46,000 | 1.9% |
Source: Observer (Feb 2023)
Volkswagen is a noteworthy player missing from this table. The company has been gaining ground on Tesla, especially in the European market.
We have a clear pricing strategy and are focusing on reliability. We trust in the strength of our products and brands.
– Oliver Blume, CEO, VW Group
This decision could hamper Volkswagen’s goal of becoming a dominant player in EVs, especially if more automakers join Tesla in cutting prices. For now, Tesla still holds a strong grip on the US market.
Thanks, Elon
Recent Tesla buyers became outraged when the company announced it would be slashing prices on its cars. In China, buyers even staged protests at Tesla stores and delivery centers.
Recent buyers not only missed out on a better price, but their cars have effectively depreciated by the amount of the cut. This is a bitter turn of events, given Musk’s 2019 claims that a Tesla would be an appreciating asset.
I think the most profound thing is that if you buy a Tesla today, I believe you are buying an appreciating asset – not a depreciating asset.
– Elon Musk, CEO, Tesla
These comments were made in reference to Tesla’s full self-driving (FSD) capabilities, which Elon claimed would enable owners to turn their cars into robotaxis.


Markets
The European Stock Market: Attractive Valuations Offer Opportunities
On average, the European stock market has valuations that are nearly 50% lower than U.S. valuations. But how can you access the market?


European Stock Market: Attractive Valuations Offer Opportunities
Europe is known for some established brands, from L’Oréal to Louis Vuitton. However, the European stock market offers additional opportunities that may be lesser known.
The above infographic, sponsored by STOXX, outlines why investors may want to consider European stocks.
Attractive Valuations
Compared to most North American and Asian markets, European stocks offer lower or comparable valuations.
| Index | Price-to-Earnings Ratio | Price-to-Book Ratio |
|---|---|---|
| EURO STOXX 50 | 14.9 | 2.2 |
| STOXX Europe 600 | 14.4 | 2 |
| U.S. | 25.9 | 4.7 |
| Canada | 16.1 | 1.8 |
| Japan | 15.4 | 1.6 |
| Asia Pacific ex. China | 17.1 | 1.8 |
Data as of February 29, 2024. See graphic for full index names. Ratios based on trailing 12 month financials. The price to earnings ratio excludes companies with negative earnings.
On average, European valuations are nearly 50% lower than U.S. valuations, potentially offering an affordable entry point for investors.
Research also shows that lower price ratios have historically led to higher long-term returns.
Market Movements Not Closely Connected
Over the last decade, the European stock market had low-to-moderate correlation with North American and Asian equities.
The below chart shows correlations from February 2014 to February 2024. A value closer to zero indicates low correlation, while a value of one would indicate that two regions are moving in perfect unison.
| EURO STOXX 50 | STOXX EUROPE 600 | U.S. | Canada | Japan | Asia Pacific ex. China |
|
|---|---|---|---|---|---|---|
| EURO STOXX 50 | 1.00 | 0.97 | 0.55 | 0.67 | 0.24 | 0.43 |
| STOXX EUROPE 600 | 1.00 | 0.56 | 0.71 | 0.28 | 0.48 | |
| U.S. | 1.00 | 0.73 | 0.12 | 0.25 | ||
| Canada | 1.00 | 0.22 | 0.40 | |||
| Japan | 1.00 | 0.88 | ||||
| Asia Pacific ex. China | 1.00 |
Data is based on daily USD returns.
European equities had relatively independent market movements from North American and Asian markets. One contributing factor could be the differing sector weights in each market. For instance, technology makes up a quarter of the U.S. market, but health care and industrials dominate the broader European market.
Ultimately, European equities can enhance portfolio diversification and have the potential to mitigate risk for investors.
Tracking the Market
For investors interested in European equities, STOXX offers a variety of flagship indices:
| Index | Description | Market Cap |
|---|---|---|
| STOXX Europe 600 | Pan-regional, broad market | €10.5T |
| STOXX Developed Europe | Pan-regional, broad-market | €9.9T |
| STOXX Europe 600 ESG-X | Pan-regional, broad market, sustainability focus | €9.7T |
| STOXX Europe 50 | Pan-regional, blue-chip | €5.1T |
| EURO STOXX 50 | Eurozone, blue-chip | €3.5T |
Data is as of February 29, 2024. Market cap is free float, which represents the shares that are readily available for public trading on stock exchanges.
The EURO STOXX 50 tracks the Eurozone’s biggest and most traded companies. It also underlies one of the world’s largest ranges of ETFs and mutual funds. As of November 2023, there were €27.3 billion in ETFs and €23.5B in mutual fund assets under management tracking the index.
“For the past 25 years, the EURO STOXX 50 has served as an accurate, reliable and tradable representation of the Eurozone equity market.”
— Axel Lomholt, General Manager at STOXX
Partnering with STOXX to Track the European Stock Market
Are you interested in European equities? STOXX can be a valuable partner:
- Comprehensive, liquid and investable ecosystem
- European heritage, global reach
- Highly sophisticated customization capabilities
- Open architecture approach to using data
- Close partnerships with clients
- Part of ISS STOXX and Deutsche Börse Group
With a full suite of indices, STOXX can help you benchmark against the European stock market.
Learn how STOXX’s European indices offer liquid and effective market access.

-

 Economy1 day ago
Economic Growth Forecasts for G7 and BRICS Countries in 2024
The IMF has released its economic growth forecasts for 2024. How do the G7 and BRICS countries compare?
-

 Markets1 week ago
U.S. Debt Interest Payments Reach $1 Trillion
U.S. debt interest payments have surged past the $1 trillion dollar mark, amid high interest rates and an ever-expanding debt burden.
-

 United States1 week ago
Ranked: The Largest U.S. Corporations by Number of Employees
We visualized the top U.S. companies by employees, revealing the massive scale of retailers like Walmart, Target, and Home Depot.
-

 Markets2 weeks ago
The Top 10 States by Real GDP Growth in 2023
This graphic shows the states with the highest real GDP growth rate in 2023, largely propelled by the oil and gas boom.
-

 Markets2 weeks ago
Ranked: The World’s Top Flight Routes, by Revenue
In this graphic, we show the highest earning flight routes globally as air travel continued to rebound in 2023.
-

 Markets2 weeks ago
Ranked: The Most Valuable Housing Markets in America
The U.S. residential real estate market is worth a staggering $47.5 trillion. Here are the most valuable housing markets in the country.


-

 Mining1 week ago
Gold vs. S&P 500: Which Has Grown More Over Five Years?
-
Markets2 weeks ago
Ranked: The Most Valuable Housing Markets in America
-

 Money2 weeks ago
Which States Have the Highest Minimum Wage in America?
-

 AI2 weeks ago
Ranked: Semiconductor Companies by Industry Revenue Share
-
Markets2 weeks ago
Ranked: The World’s Top Flight Routes, by Revenue
-

 Demographics2 weeks ago
Population Projections: The World’s 6 Largest Countries in 2075
-
Markets2 weeks ago
The Top 10 States by Real GDP Growth in 2023
-

 Demographics2 weeks ago
The Smallest Gender Wage Gaps in OECD Countries