Markets
Charted: Tesla’s Unrivaled Profit Margins
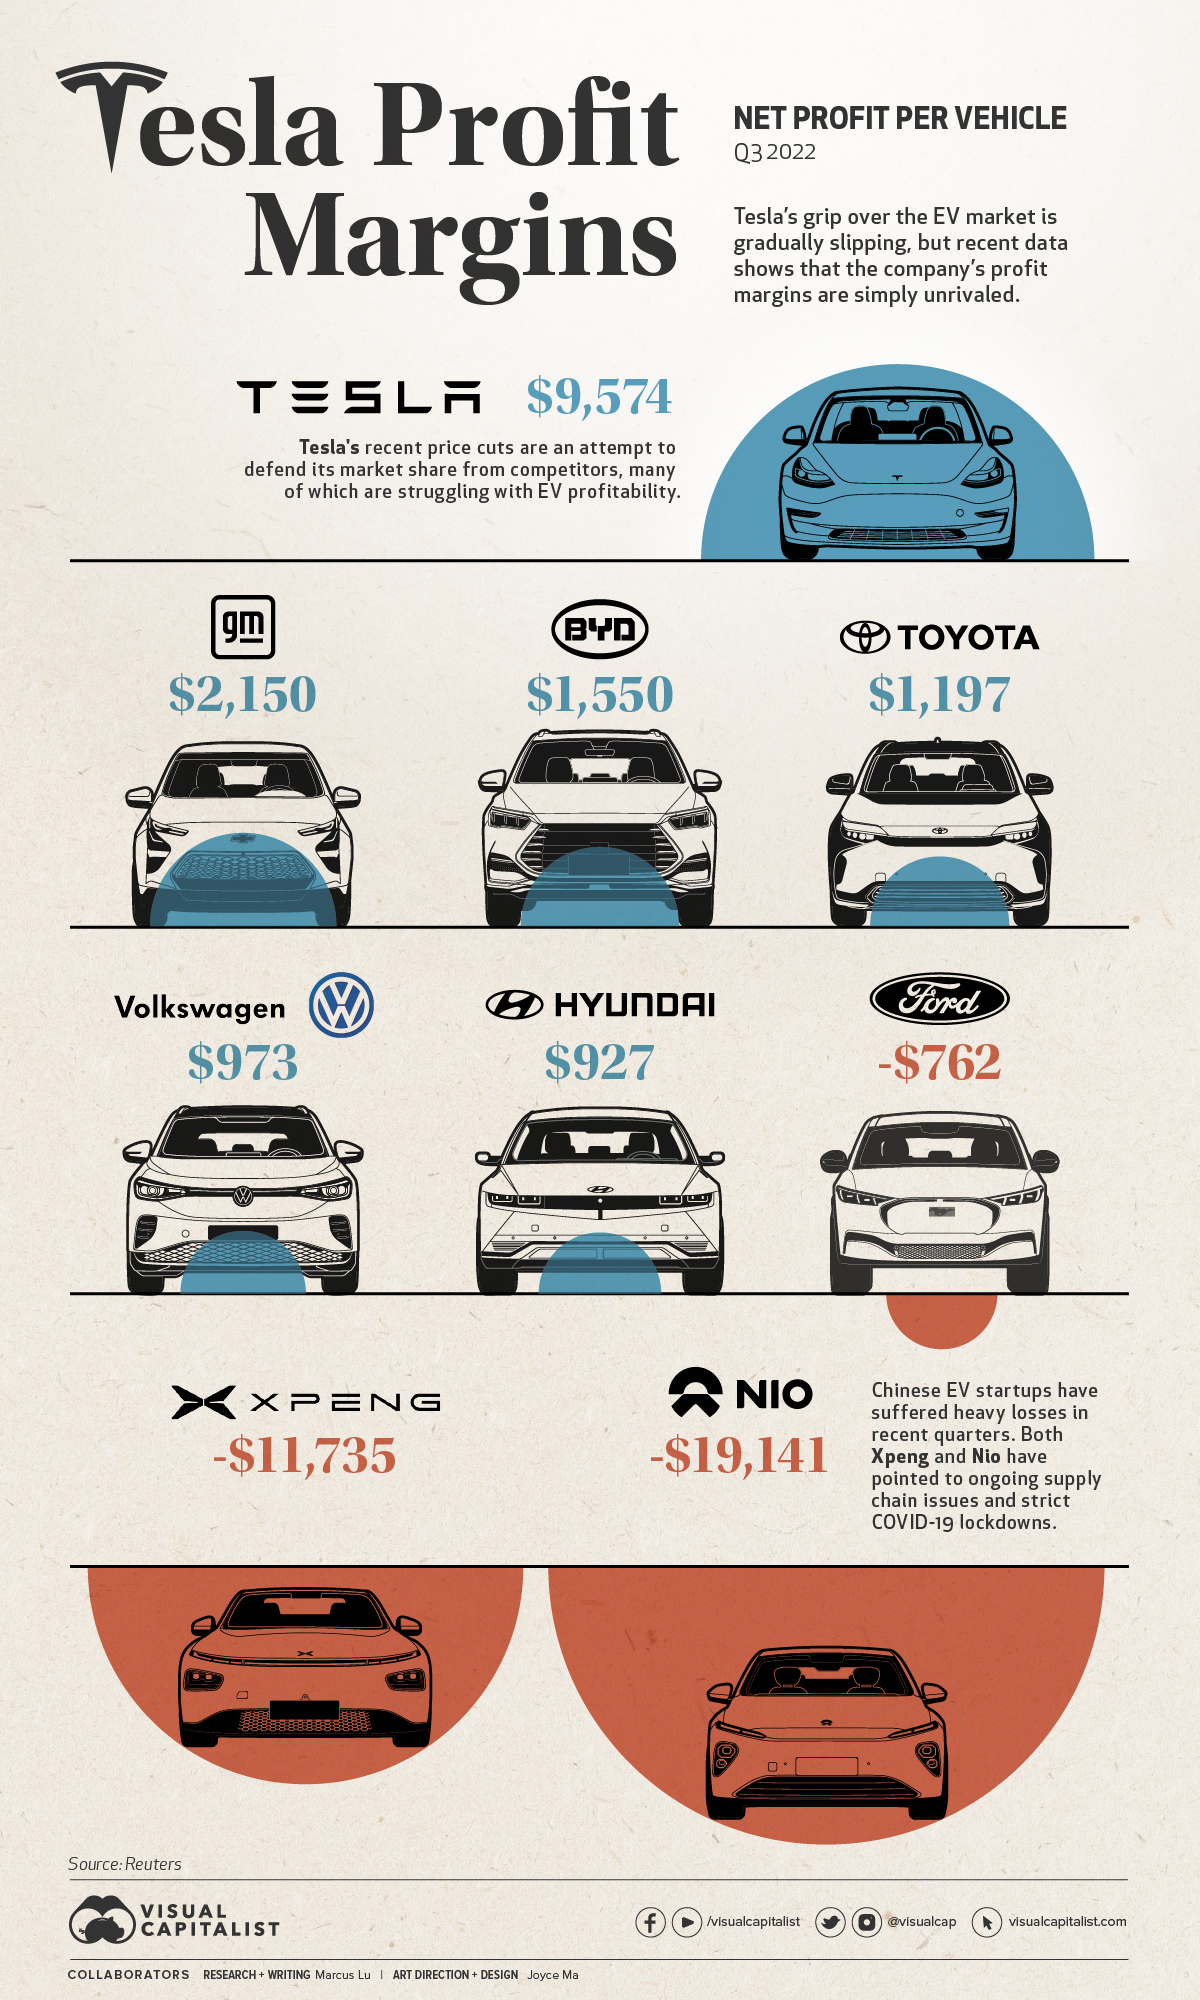


Chart: Tesla’s Unrivaled Profit Margins
In January this year, Tesla made the surprising announcement that it would be cutting prices on its vehicles by as much as 20%.
While price cuts are not new in the automotive world, they are for Tesla. The company, which historically has been unable to keep up with demand, has seen its order backlog shrink from 476,000 units in July 2022, to 74,000 in December 2022.
This has been attributed to Tesla’s robust production growth, which saw 2022 production increase 41% over 2021 (from 930,422 to 1,313,851 units).
With the days of “endless” demand seemingly over, Tesla is going on the offensive by reducing its prices—a move that puts pressure on competitors, but has also angered existing owners.
Cranking up the Heat
Tesla’s price cuts are an attempt to protect its market share, but they’re not exactly the desperation move some media outlets have claimed them to be.
Recent data compiled by Reuters shows that Tesla’s margins are significantly higher than those of its rivals, both in terms of gross and net profit. Our graphic only illustrates the net figures, but gross profits are also included in the table below.
| Company | Gross profit per car | Net profit per car |
|---|---|---|
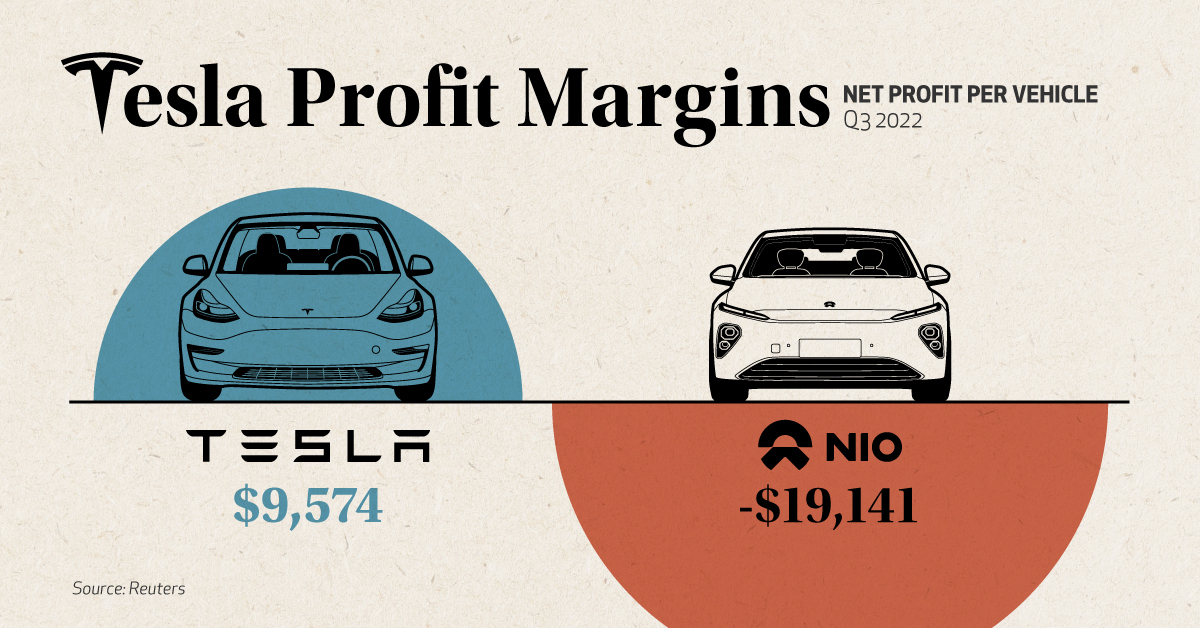
| 🇺🇸 Tesla | $15,653 | $9,574 |
| 🇺🇸 GM | $3,818 | $2,150 |
| 🇨🇳 BYD | $5,456 | $1,550 |
| 🇯🇵 Toyota | $3,925 | $1,197 |
| 🇩🇪 VW | $6,034 | $973 |
| 🇰🇷 Hyundai | $5,362 | $927 |
| 🇺🇸 Ford | $3,115 | -$762 |
| 🇨🇳 Xpeng | $4,565 | -$11,735 |
| 🇨🇳 Nio | $8,036 | -$19,141 |
Data from Q3 2022
Price cutting has its drawbacks, but one could argue that the benefits for Tesla are worth it based on this data—especially in a critical market like China.
Tesla has taken the nuclear option to bully the weaker, thin margin players off the table.
– Bill Russo, Automobility
In the case of Chinese EV startups Xpeng and Nio, net profits are non-existent, meaning it’s unlikely they’ll be able to match Tesla’s reductions in price. Both firms have reported year-on-year sales declines in January.
As for Tesla, Chinese media outlets have claimed that the firm received 30,000 orders within three days of its price cut announcement. Note that this hasn’t been officially confirmed by anyone within the company.
Tit for Tat
Ford made headlines recently for announcing its own price cuts on the Mustang Mach-E electric SUV. The model is a direct competitor to Tesla’s best-selling Model Y.
Chevrolet and Hyundai have also adjusted some of their EV prices in recent months, as listed in the following table.
| Model | Old Price | New Price | Discount |
|---|---|---|---|
| Tesla Model Y Long Range | $65,990 | $53,490 | 18.9% |
| Chevrolet Bolt EUV 2023 | $33,500 | $27,200 | 18.8% |
| Tesla Model Y Performance | $69,990 | $56,990 | 18.6% |
| Chevrolet Bolt 2023 | $31,600 | $26,500 | 16.1% |
| Tesla Model 3 Performance | $62,990 | $53,990 | 14.3% |
| Hyundai Kona Electric 2022 | $37,390 | $34,000 | 9.1% |
| Ford Mustang Mach-E GT Extended Range | $69,900 | $64,000 | 8.4% |
| Tesla Model 3 Long Range | $46,990 | $43,990 | 6.4% |
| Ford Mustang Mach-E Premium AWD | $57,675 | $53,995 | 6.4% |
| Ford Mustang Mach-E RWD Standard Range | $46,900 | $46,000 | 1.9% |
Source: Observer (Feb 2023)
Volkswagen is a noteworthy player missing from this table. The company has been gaining ground on Tesla, especially in the European market.
We have a clear pricing strategy and are focusing on reliability. We trust in the strength of our products and brands.
– Oliver Blume, CEO, VW Group
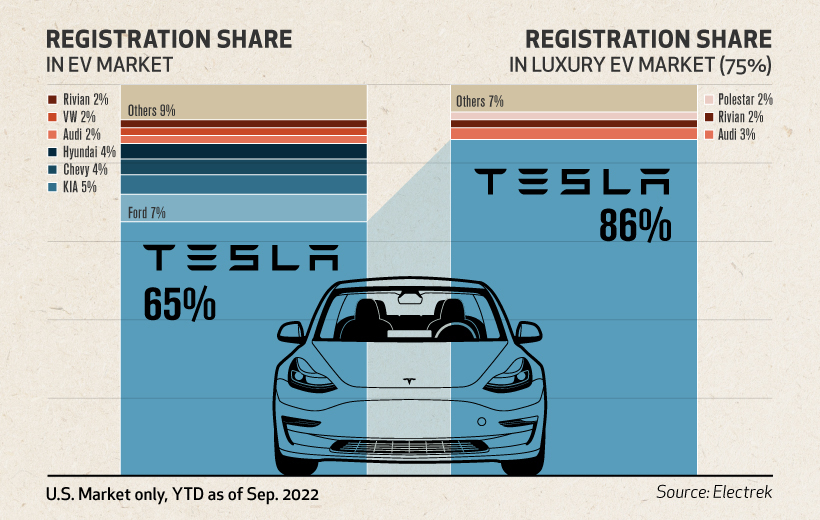
This decision could hamper Volkswagen’s goal of becoming a dominant player in EVs, especially if more automakers join Tesla in cutting prices. For now, Tesla still holds a strong grip on the US market.
Thanks, Elon
Recent Tesla buyers became outraged when the company announced it would be slashing prices on its cars. In China, buyers even staged protests at Tesla stores and delivery centers.
Recent buyers not only missed out on a better price, but their cars have effectively depreciated by the amount of the cut. This is a bitter turn of events, given Musk’s 2019 claims that a Tesla would be an appreciating asset.
I think the most profound thing is that if you buy a Tesla today, I believe you are buying an appreciating asset – not a depreciating asset.
– Elon Musk, CEO, Tesla
These comments were made in reference to Tesla’s full self-driving (FSD) capabilities, which Elon claimed would enable owners to turn their cars into robotaxis.


Economy
Economic Growth Forecasts for G7 and BRICS Countries in 2024
The IMF has released its economic growth forecasts for 2024. How do the G7 and BRICS countries compare?


G7 & BRICS Real GDP Growth Forecasts for 2024
The International Monetary Fund’s (IMF) has released its real gross domestic product (GDP) growth forecasts for 2024, and while global growth is projected to stay steady at 3.2%, various major nations are seeing declining forecasts.
This chart visualizes the 2024 real GDP growth forecasts using data from the IMF’s 2024 World Economic Outlook for G7 and BRICS member nations along with Saudi Arabia, which is still considering an invitation to join the bloc.
Get the Key Insights of the IMF’s World Economic Outlook
Want a visual breakdown of the insights from the IMF’s 2024 World Economic Outlook report?
This visual is part of a special dispatch of the key takeaways exclusively for VC+ members.
Get the full dispatch of charts by signing up to VC+.
Mixed Economic Growth Prospects for Major Nations in 2024
Economic growth projections by the IMF for major nations are mixed, with the majority of G7 and BRICS countries forecasted to have slower growth in 2024 compared to 2023.
Only three BRICS-invited or member countries, Saudi Arabia, the UAE, and South Africa, have higher projected real GDP growth rates in 2024 than last year.
| Group | Country | Real GDP Growth (2023) | Real GDP Growth (2024P) |
|---|---|---|---|
| G7 | 🇺🇸 U.S. | 2.5% | 2.7% |
| G7 | 🇨🇦 Canada | 1.1% | 1.2% |
| G7 | 🇯🇵 Japan | 1.9% | 0.9% |
| G7 | 🇫🇷 France | 0.9% | 0.7% |
| G7 | 🇮🇹 Italy | 0.9% | 0.7% |
| G7 | 🇬🇧 UK | 0.1% | 0.5% |
| G7 | 🇩🇪 Germany | -0.3% | 0.2% |
| BRICS | 🇮🇳 India | 7.8% | 6.8% |
| BRICS | 🇨🇳 China | 5.2% | 4.6% |
| BRICS | 🇦🇪 UAE | 3.4% | 3.5% |
| BRICS | 🇮🇷 Iran | 4.7% | 3.3% |
| BRICS | 🇷🇺 Russia | 3.6% | 3.2% |
| BRICS | 🇪🇬 Egypt | 3.8% | 3.0% |
| BRICS-invited | 🇸🇦 Saudi Arabia | -0.8% | 2.6% |
| BRICS | 🇧🇷 Brazil | 2.9% | 2.2% |
| BRICS | 🇿🇦 South Africa | 0.6% | 0.9% |
| BRICS | 🇪🇹 Ethiopia | 7.2% | 6.2% |
| 🌍 World | 3.2% | 3.2% |
China and India are forecasted to maintain relatively high growth rates in 2024 at 4.6% and 6.8% respectively, but compared to the previous year, China is growing 0.6 percentage points slower while India is an entire percentage point slower.
On the other hand, four G7 nations are set to grow faster than last year, which includes Germany making its comeback from its negative real GDP growth of -0.3% in 2023.
Faster Growth for BRICS than G7 Nations
Despite mostly lower growth forecasts in 2024 compared to 2023, BRICS nations still have a significantly higher average growth forecast at 3.6% compared to the G7 average of 1%.
While the G7 countries’ combined GDP is around $15 trillion greater than the BRICS nations, with continued higher growth rates and the potential to add more members, BRICS looks likely to overtake the G7 in economic size within two decades.
BRICS Expansion Stutters Before October 2024 Summit
BRICS’ recent expansion has stuttered slightly, as Argentina’s newly-elected president Javier Milei declined its invitation and Saudi Arabia clarified that the country is still considering its invitation and has not joined BRICS yet.
Even with these initial growing pains, South Africa’s Foreign Minister Naledi Pandor told reporters in February that 34 different countries have submitted applications to join the growing BRICS bloc.
Any changes to the group are likely to be announced leading up to or at the 2024 BRICS summit which takes place October 22-24 in Kazan, Russia.
Get the Full Analysis of the IMF’s Outlook on VC+
This visual is part of an exclusive special dispatch for VC+ members which breaks down the key takeaways from the IMF’s 2024 World Economic Outlook.
For the full set of charts and analysis, sign up for VC+.

-

 Markets1 week ago
U.S. Debt Interest Payments Reach $1 Trillion
-

 Business2 weeks ago
Charted: Big Four Market Share by S&P 500 Audits
-

 Real Estate2 weeks ago
Ranked: The Most Valuable Housing Markets in America
-

 Money2 weeks ago
Which States Have the Highest Minimum Wage in America?
-

 AI2 weeks ago
Ranked: Semiconductor Companies by Industry Revenue Share
-

 Markets2 weeks ago
Ranked: The World’s Top Flight Routes, by Revenue
-

 Demographics2 weeks ago
Population Projections: The World’s 6 Largest Countries in 2075
-

 Markets2 weeks ago
The Top 10 States by Real GDP Growth in 2023