Markets
The Trump Effect on Currencies
The Trump Effect on Currencies
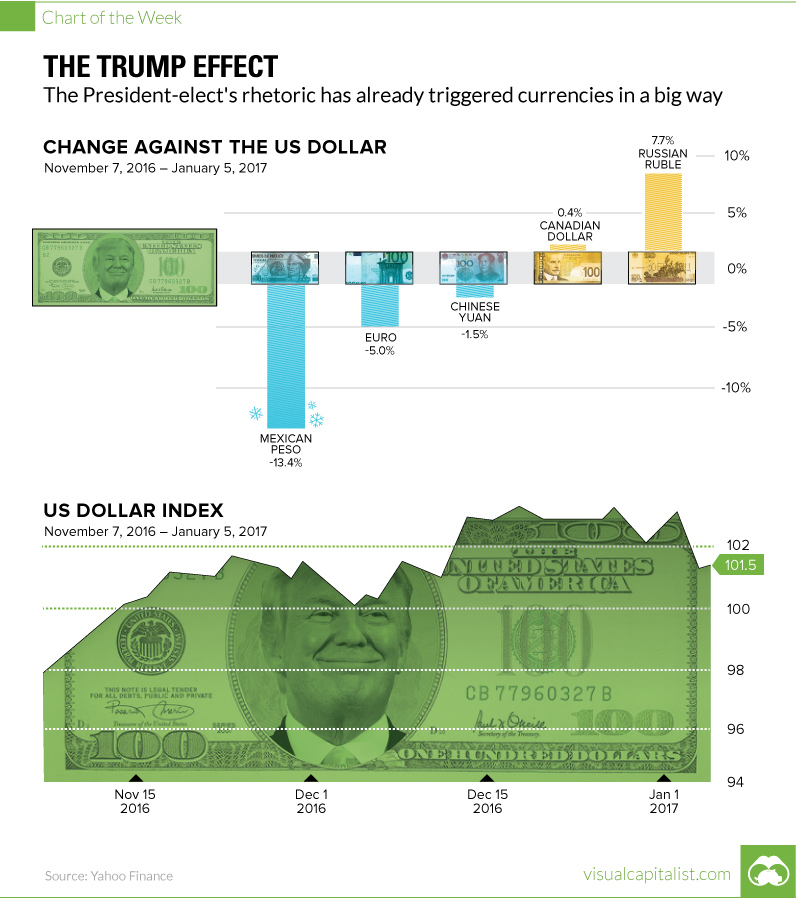
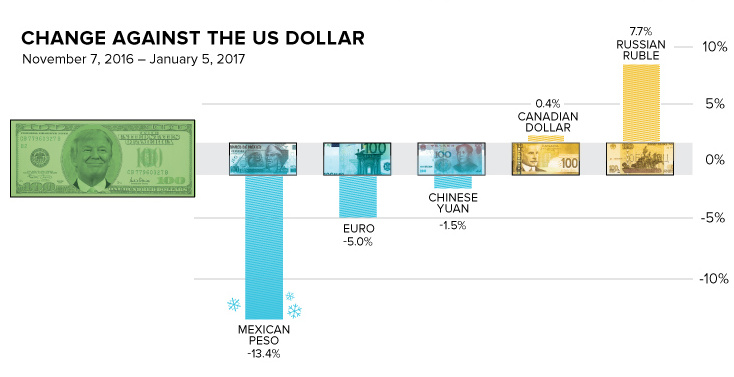
Rhetoric has already had an impact on currencies in a big way
The Chart of the Week is a weekly Visual Capitalist feature on Fridays.
Targeting companies or entire nations on Twitter is an unprecedented and controversial method of communication for a President-elect – but one can’t argue with its effectiveness so far.
In today’s chart, we take a look at Donald Trump’s rather unconventional form of “monetary policy”, and how it has potentially influenced the U.S. dollar and five other major currencies since his election in November.
Ready, Aim, Tweet
A preview of President-elect Trump’s “America First” directive can already be seen on Twitter.
Trump’s infamous account, which is followed by 18.8 million people, is being used every day to highlight the potential winners and losers of future policies.
And markets are listening.
| Currency | % Change (vs. USD) |
|---|---|
| Russian Ruble | 7.7% |
| Canadian Dollar | 0.4% |
| Chinese Yuan | -1.5% |
| Euro | -5.0% |
| Mexican Peso | -13.4% |
The above table shows change in the value of foreign currencies against the U.S. dollar between November 7th, 2016 and today. To be fair, it is worth noting that oil prices have also rallied over this time, and oil also has a pronounced effect on some currencies.
Individual Cases
Central to “America First” is a Trump-branded form of protectionism, which aims to keep jobs and dollars in the U.S at all costs. The President-elect has repeatedly blasted China for currency manipulation, as well as automotive companies which seek to produce cars in Mexico.
General Motors is sending Mexican made model of Chevy Cruze to U.S. car dealers-tax free across border. Make in U.S.A.or pay big border tax!
— Donald J. Trump (@realDonaldTrump) January 3, 2017
China, as one of the world’s major economic powers, has some leeway in any war of words with Trump. While the country sends 18% of its exports to the United States, it could also theoretically benefit economically with the U.S. taking a step back from foreign entanglements. China also holds $1.12 trillion of U.S. treasuries, which gives it some additional leverage.
On the other hand, Mexico has a lot more to worry about. The country sends 80.3% of its exports north of the border and could conceivably lose significant amounts of business if NAFTA is scrapped and tariffs are re-introduced. As a result, even with oil’s gains over the last two months, the peso has dropped -13.4% in value since Trump’s election in November.
An Unlikely Friend
On the opposite side of the spectrum, Trump has been making moves to warm up relations with Russia – a protectionist country that isn’t really a “threat” to U.S. jobs.
Great move on delay (by V. Putin) – I always knew he was very smart!
— Donald J. Trump (@realDonaldTrump) December 30, 2016
Russia, which has been on Trump’s “good side” so far, has had its ruble trade 7.7% higher since the election. These gains partially reflect the future easing of sanctions that were put in place after Moscow’s aggression toward Ukraine in 2014.


Markets
The European Stock Market: Attractive Valuations Offer Opportunities
On average, the European stock market has valuations that are nearly 50% lower than U.S. valuations. But how can you access the market?


European Stock Market: Attractive Valuations Offer Opportunities
Europe is known for some established brands, from L’Oréal to Louis Vuitton. However, the European stock market offers additional opportunities that may be lesser known.
The above infographic, sponsored by STOXX, outlines why investors may want to consider European stocks.
Attractive Valuations
Compared to most North American and Asian markets, European stocks offer lower or comparable valuations.
| Index | Price-to-Earnings Ratio | Price-to-Book Ratio |
|---|---|---|
| EURO STOXX 50 | 14.9 | 2.2 |
| STOXX Europe 600 | 14.4 | 2 |
| U.S. | 25.9 | 4.7 |
| Canada | 16.1 | 1.8 |
| Japan | 15.4 | 1.6 |
| Asia Pacific ex. China | 17.1 | 1.8 |
Data as of February 29, 2024. See graphic for full index names. Ratios based on trailing 12 month financials. The price to earnings ratio excludes companies with negative earnings.
On average, European valuations are nearly 50% lower than U.S. valuations, potentially offering an affordable entry point for investors.
Research also shows that lower price ratios have historically led to higher long-term returns.
Market Movements Not Closely Connected
Over the last decade, the European stock market had low-to-moderate correlation with North American and Asian equities.
The below chart shows correlations from February 2014 to February 2024. A value closer to zero indicates low correlation, while a value of one would indicate that two regions are moving in perfect unison.
| EURO STOXX 50 | STOXX EUROPE 600 | U.S. | Canada | Japan | Asia Pacific ex. China |
|
|---|---|---|---|---|---|---|
| EURO STOXX 50 | 1.00 | 0.97 | 0.55 | 0.67 | 0.24 | 0.43 |
| STOXX EUROPE 600 | 1.00 | 0.56 | 0.71 | 0.28 | 0.48 | |
| U.S. | 1.00 | 0.73 | 0.12 | 0.25 | ||
| Canada | 1.00 | 0.22 | 0.40 | |||
| Japan | 1.00 | 0.88 | ||||
| Asia Pacific ex. China | 1.00 |
Data is based on daily USD returns.
European equities had relatively independent market movements from North American and Asian markets. One contributing factor could be the differing sector weights in each market. For instance, technology makes up a quarter of the U.S. market, but health care and industrials dominate the broader European market.
Ultimately, European equities can enhance portfolio diversification and have the potential to mitigate risk for investors.
Tracking the Market
For investors interested in European equities, STOXX offers a variety of flagship indices:
| Index | Description | Market Cap |
|---|---|---|
| STOXX Europe 600 | Pan-regional, broad market | €10.5T |
| STOXX Developed Europe | Pan-regional, broad-market | €9.9T |
| STOXX Europe 600 ESG-X | Pan-regional, broad market, sustainability focus | €9.7T |
| STOXX Europe 50 | Pan-regional, blue-chip | €5.1T |
| EURO STOXX 50 | Eurozone, blue-chip | €3.5T |
Data is as of February 29, 2024. Market cap is free float, which represents the shares that are readily available for public trading on stock exchanges.
The EURO STOXX 50 tracks the Eurozone’s biggest and most traded companies. It also underlies one of the world’s largest ranges of ETFs and mutual funds. As of November 2023, there were €27.3 billion in ETFs and €23.5B in mutual fund assets under management tracking the index.
“For the past 25 years, the EURO STOXX 50 has served as an accurate, reliable and tradable representation of the Eurozone equity market.”
— Axel Lomholt, General Manager at STOXX
Partnering with STOXX to Track the European Stock Market
Are you interested in European equities? STOXX can be a valuable partner:
- Comprehensive, liquid and investable ecosystem
- European heritage, global reach
- Highly sophisticated customization capabilities
- Open architecture approach to using data
- Close partnerships with clients
- Part of ISS STOXX and Deutsche Börse Group
With a full suite of indices, STOXX can help you benchmark against the European stock market.
Learn how STOXX’s European indices offer liquid and effective market access.

-

 Economy1 day ago
Economic Growth Forecasts for G7 and BRICS Countries in 2024
The IMF has released its economic growth forecasts for 2024. How do the G7 and BRICS countries compare?
-

 Markets1 week ago
U.S. Debt Interest Payments Reach $1 Trillion
U.S. debt interest payments have surged past the $1 trillion dollar mark, amid high interest rates and an ever-expanding debt burden.
-

 United States1 week ago
Ranked: The Largest U.S. Corporations by Number of Employees
We visualized the top U.S. companies by employees, revealing the massive scale of retailers like Walmart, Target, and Home Depot.
-

 Markets2 weeks ago
The Top 10 States by Real GDP Growth in 2023
This graphic shows the states with the highest real GDP growth rate in 2023, largely propelled by the oil and gas boom.
-

 Markets2 weeks ago
Ranked: The World’s Top Flight Routes, by Revenue
In this graphic, we show the highest earning flight routes globally as air travel continued to rebound in 2023.
-

 Markets2 weeks ago
Ranked: The Most Valuable Housing Markets in America
The U.S. residential real estate market is worth a staggering $47.5 trillion. Here are the most valuable housing markets in the country.


-

 Mining1 week ago
Gold vs. S&P 500: Which Has Grown More Over Five Years?
-
Markets2 weeks ago
Ranked: The Most Valuable Housing Markets in America
-

 Money2 weeks ago
Which States Have the Highest Minimum Wage in America?
-

 AI2 weeks ago
Ranked: Semiconductor Companies by Industry Revenue Share
-
Markets2 weeks ago
Ranked: The World’s Top Flight Routes, by Revenue
-

 Demographics2 weeks ago
Population Projections: The World’s 6 Largest Countries in 2075
-
Markets2 weeks ago
The Top 10 States by Real GDP Growth in 2023
-

 Demographics2 weeks ago
The Smallest Gender Wage Gaps in OECD Countries