Markets
Chart: The Trillion Dollar Club of Asset Managers
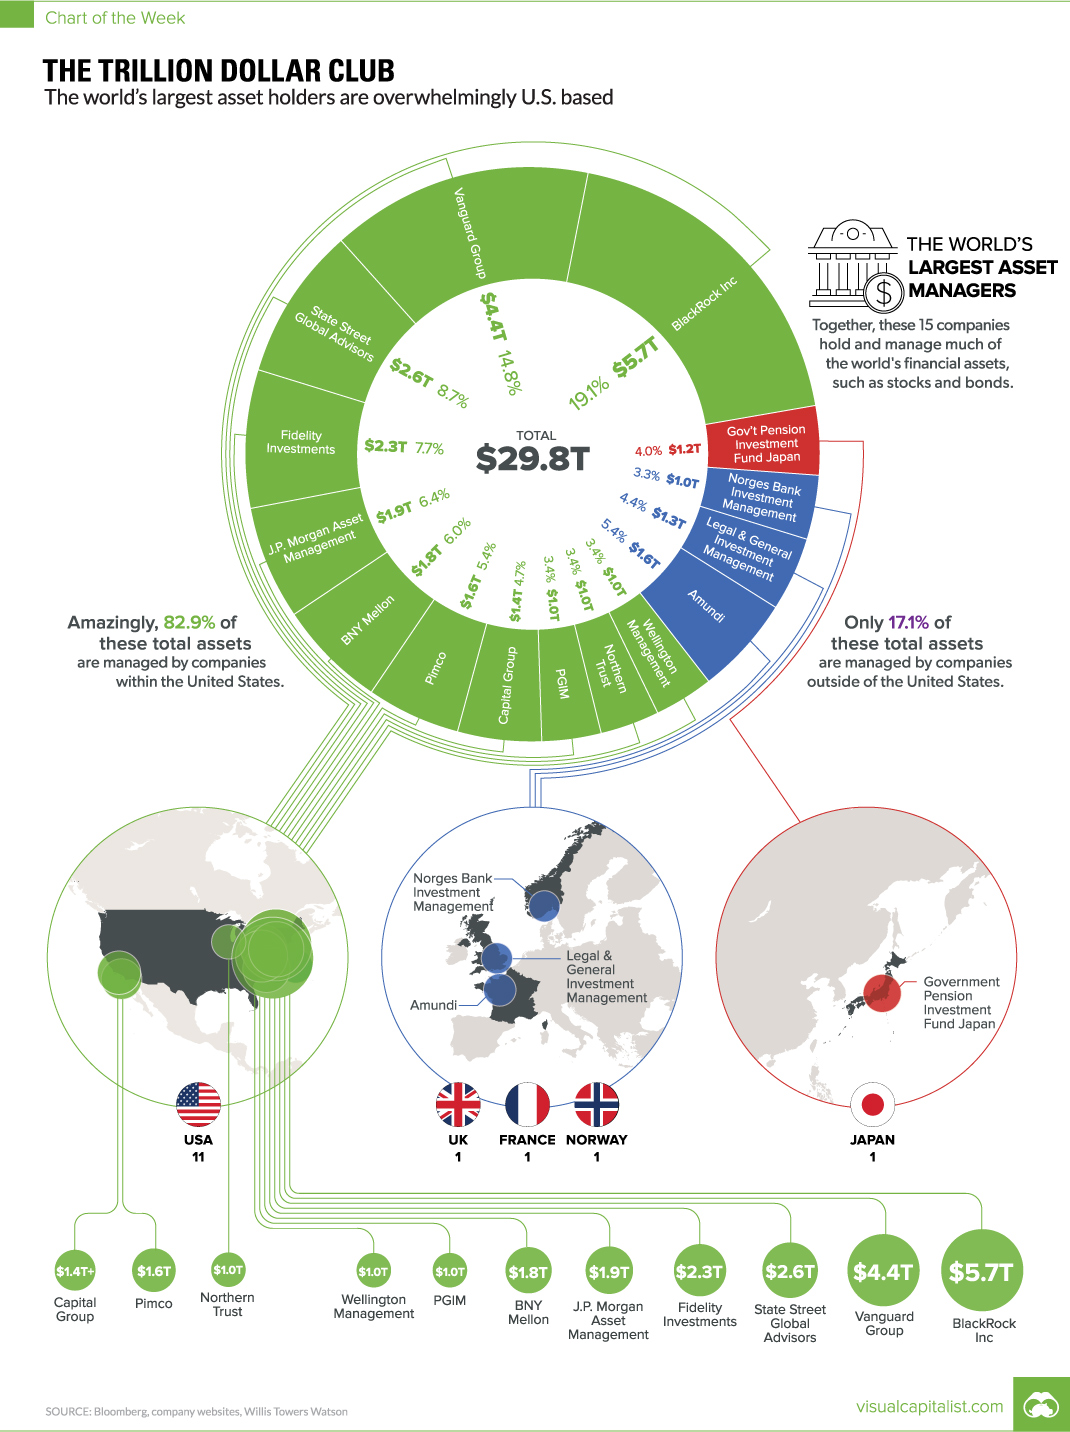
Chart: The Trillion Dollar Club
$1T+ club is dominated by U.S. based asset managers
The Chart of the Week is a weekly Visual Capitalist feature on Fridays.
In the late 1700s, it was the start of the battle of stock exchanges: in 1773, the London Stock Exchange was formed, and the New York Stock Exchange was formed just 19 years later.
And while London was a preferred destination for international finance at the time, England also had laws that restricted the formation of new joint-stock companies. The law was repealed in 1825, but by then it was already too late.
In the U.S., exchanges in New York City and Philadelphia took full advantage by dealing in stocks early on. Eventually, for this and a variety of other reasons, the NYSE emerged as the most dominant exchange in the world – helping propel New York and Wall Street to the center of finance.
The Center of Finance
Wall Street, and the U.S. in general, is now synonymous with finance – and most of the world’s largest banks, funds, and investors maintain a presence nearby. The biggest asset management companies, which pool investments into securities such as stocks and bonds on behalf of investors, are no exception to this.
Today’s chart shows all global companies with over $1 trillion in assets under management (AUM).
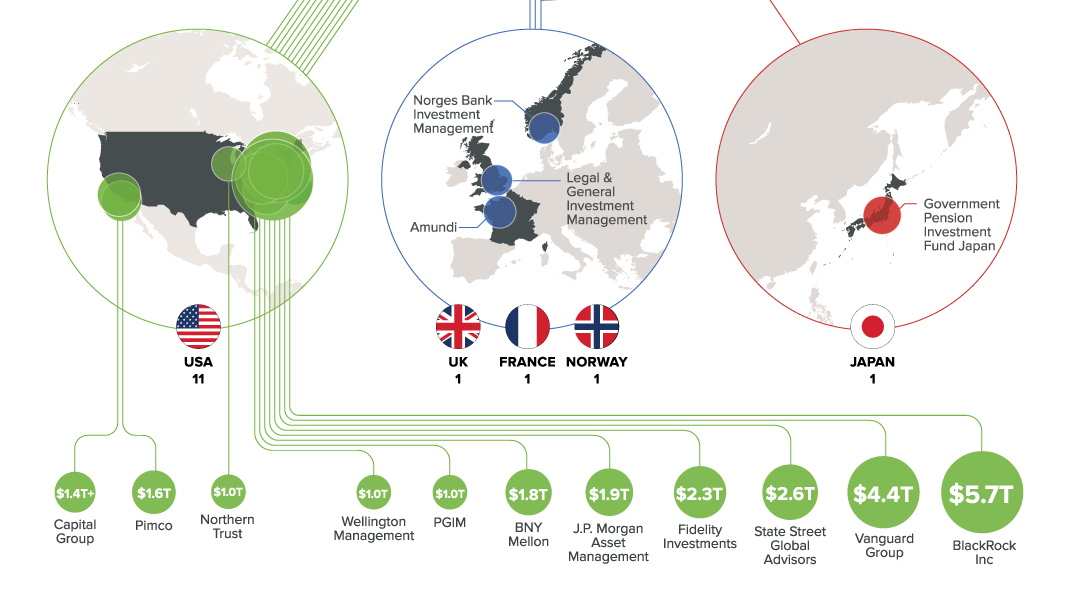
Not surprisingly, all but 17.1% of assets managed by this $1 Trillion Club are overseen by companies based in the United States.
| Rank | Company | Country | AUM |
|---|---|---|---|
| #1 | BlackRock Inc. | USA | $5.7 trillion |
| #2 | Vanguard Group | USA | $4.4 trillion |
| #3 | State Street Global Advisors | USA | $2.6 trillion |
| #4 | Fidelity Investments | USA | $2.3 trillion |
| #5 | J.P. Morgan Asset Management | USA | $1.9 trillion |
| #6 | BNY Mellon | USA | $1.8 trillion |
| #7 | Pimco | USA | $1.6 trillion |
| #8 | Amundi | France | $1.6 trillion |
| #9 | Capital Group | USA | $1.4+ trillion |
| #10 | Legal & General Investment Management | UK | $1.3 trillion |
| #11 | Government Pension Investment Fund | Japan | $1.2 trillion |
| #12 | PGIM | USA | $1.0+ trillion |
| #13 | Northern Trust | USA | $1.0 trillion |
| #14 | Wellington Management | USA | $1.0 trillion |
| #15 | Norges Bank Investment Management | Norway | $1.0 trillion |
Even further, outside of Northern Trust (Chicago), Pimco (Newport Beach), and Capital Group (Los Angeles), the remaining U.S. companies are based in the Northeast specifically – either on Wall Street, or just a short drive away.
The Newest Entrant
The newest entrant to the $1 trillion club is Norway’s sovereign wealth fund, which is managed by Norges Bank Investment Management. It’s the world’s largest sovereign wealth fund, and it was “never forecast” to get so big.
The Norwegian fund recently joined France’s Amundi ($1.6 trillion), the UK’s Legal & General ($1.3 trillion), and Japan’s Goverment Pension Investment Fund ($1.2 trillion) as non-U.S. members of this exclusive club.


Markets
U.S. Debt Interest Payments Reach $1 Trillion
U.S. debt interest payments have surged past the $1 trillion dollar mark, amid high interest rates and an ever-expanding debt burden.


U.S. Debt Interest Payments Reach $1 Trillion
This was originally posted on our Voronoi app. Download the app for free on iOS or Android and discover incredible data-driven charts from a variety of trusted sources.
The cost of paying for America’s national debt crossed the $1 trillion dollar mark in 2023, driven by high interest rates and a record $34 trillion mountain of debt.
Over the last decade, U.S. debt interest payments have more than doubled amid vast government spending during the pandemic crisis. As debt payments continue to soar, the Congressional Budget Office (CBO) reported that debt servicing costs surpassed defense spending for the first time ever this year.
This graphic shows the sharp rise in U.S. debt payments, based on data from the Federal Reserve.
A $1 Trillion Interest Bill, and Growing
Below, we show how U.S. debt interest payments have risen at a faster pace than at another time in modern history:
| Date | Interest Payments | U.S. National Debt |
|---|---|---|
| 2023 | $1.0T | $34.0T |
| 2022 | $830B | $31.4T |
| 2021 | $612B | $29.6T |
| 2020 | $518B | $27.7T |
| 2019 | $564B | $23.2T |
| 2018 | $571B | $22.0T |
| 2017 | $493B | $20.5T |
| 2016 | $460B | $20.0T |
| 2015 | $435B | $18.9T |
| 2014 | $442B | $18.1T |
| 2013 | $425B | $17.2T |
| 2012 | $417B | $16.4T |
| 2011 | $433B | $15.2T |
| 2010 | $400B | $14.0T |
| 2009 | $354B | $12.3T |
| 2008 | $380B | $10.7T |
| 2007 | $414B | $9.2T |
| 2006 | $387B | $8.7T |
| 2005 | $355B | $8.2T |
| 2004 | $318B | $7.6T |
| 2003 | $294B | $7.0T |
| 2002 | $298B | $6.4T |
| 2001 | $318B | $5.9T |
| 2000 | $353B | $5.7T |
| 1999 | $353B | $5.8T |
| 1998 | $360B | $5.6T |
| 1997 | $368B | $5.5T |
| 1996 | $362B | $5.3T |
| 1995 | $357B | $5.0T |
| 1994 | $334B | $4.8T |
| 1993 | $311B | $4.5T |
| 1992 | $306B | $4.2T |
| 1991 | $308B | $3.8T |
| 1990 | $298B | $3.4T |
| 1989 | $275B | $3.0T |
| 1988 | $254B | $2.7T |
| 1987 | $240B | $2.4T |
| 1986 | $225B | $2.2T |
| 1985 | $219B | $1.9T |
| 1984 | $205B | $1.7T |
| 1983 | $176B | $1.4T |
| 1982 | $157B | $1.2T |
| 1981 | $142B | $1.0T |
| 1980 | $113B | $930.2B |
| 1979 | $96B | $845.1B |
| 1978 | $84B | $789.2B |
| 1977 | $69B | $718.9B |
| 1976 | $61B | $653.5B |
| 1975 | $55B | $576.6B |
| 1974 | $50B | $492.7B |
| 1973 | $45B | $469.1B |
| 1972 | $39B | $448.5B |
| 1971 | $36B | $424.1B |
| 1970 | $35B | $389.2B |
| 1969 | $30B | $368.2B |
| 1968 | $25B | $358.0B |
| 1967 | $23B | $344.7B |
| 1966 | $21B | $329.3B |
Interest payments represent seasonally adjusted annual rate at the end of Q4.
At current rates, the U.S. national debt is growing by a remarkable $1 trillion about every 100 days, equal to roughly $3.6 trillion per year.
As the national debt has ballooned, debt payments even exceeded Medicaid outlays in 2023—one of the government’s largest expenditures. On average, the U.S. spent more than $2 billion per day on interest costs last year. Going further, the U.S. government is projected to spend a historic $12.4 trillion on interest payments over the next decade, averaging about $37,100 per American.
Exacerbating matters is that the U.S. is running a steep deficit, which stood at $1.1 trillion for the first six months of fiscal 2024. This has accelerated due to the 43% increase in debt servicing costs along with a $31 billion dollar increase in defense spending from a year earlier. Additionally, a $30 billion increase in funding for the Federal Deposit Insurance Corporation in light of the regional banking crisis last year was a major contributor to the deficit increase.
Overall, the CBO forecasts that roughly 75% of the federal deficit’s increase will be due to interest costs by 2034.

-

 Markets2 weeks ago
Visualizing America’s Shortage of Affordable Homes
-

 Technology1 week ago
Ranked: Semiconductor Companies by Industry Revenue Share
-

 Money1 week ago
Which States Have the Highest Minimum Wage in America?
-

 Real Estate1 week ago
Ranked: The Most Valuable Housing Markets in America
-

 Business2 weeks ago
Charted: Big Four Market Share by S&P 500 Audits
-

 AI2 weeks ago
The Stock Performance of U.S. Chipmakers So Far in 2024
-

 Automotive2 weeks ago
Almost Every EV Stock is Down After Q1 2024
-

 Money2 weeks ago
Where Does One U.S. Tax Dollar Go?