Markets
Chart: The Downward Spiral in Interest Rates
During the onset of an economic crisis, national governments are thought to have two chief policy tools at their disposal:
- Fiscal Policy
How the central government collects money through taxation, and how it spends that money - Monetary Policy
How central banks choose to manage the supply of money and interest rates
Major fiscal policy changes can take time to be implemented — but since central banks can make moves unilaterally, monetary policy is often the first line of defense in settling markets.
As the ripple effect of the COVID-19 pandemic rages on, central banks have been quick to act in slashing interest rates. However, with rates already sitting at historic lows before the crisis, it is possible that banks may be forced to employ more unconventional and controversial techniques to try and calm the economy as time goes on.
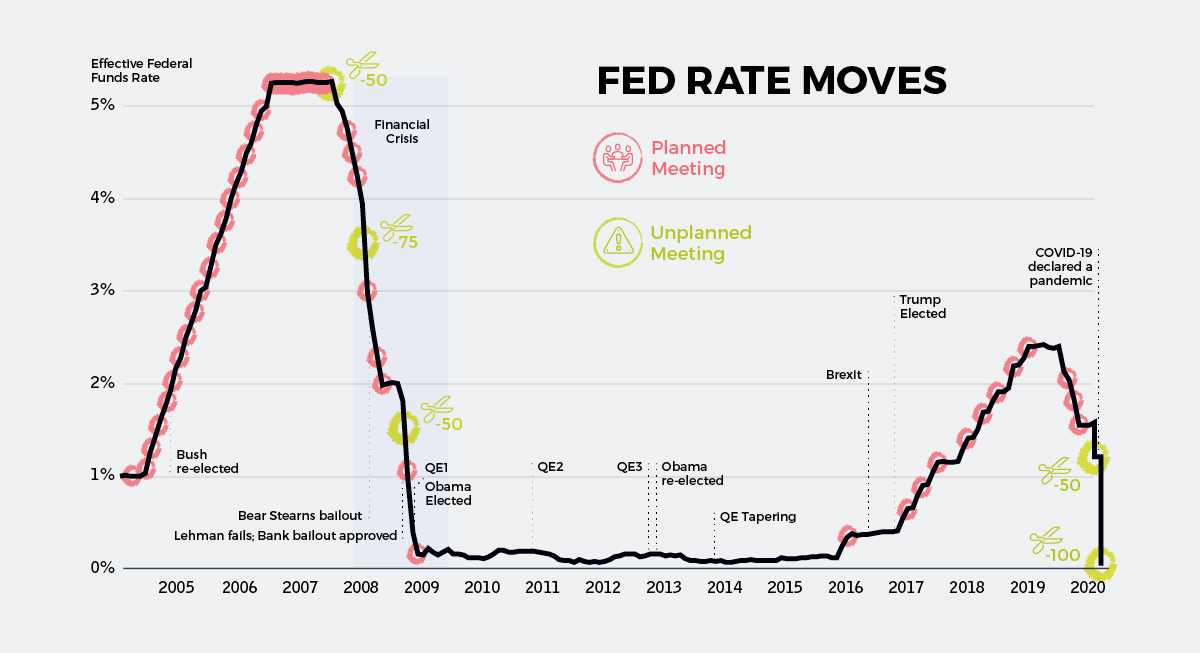
The Fed: Firing at Will
The most meaningful rate cuts happened on March 3rd and March 15th after emergency meetings in the United States.
First, the Federal Open Market Committee (FOMC) cut the target rate from 1.5% to 1.0% — and then on Sunday (March 15th) the rate got chopped by an entire percentage point to rub up against the lower bound of zero.

As you can see on the chart, this puts us back into familiar territory: a policy environment analogous to that seen during the recovery from the financial crisis.
ZIRP or NIRP?
It’s been awhile, but with interest rates again bumping up against the lower bound, you’ll begin to see discussions pop up again about the effectiveness of zero interest rate policy (ZIRP) and even negative interest rate policy (NIRP).
Although the latter has been used by some European banks in recent years, NIRP has never been experimented with in the United States or Canada.
Here’s a quick primer on both:
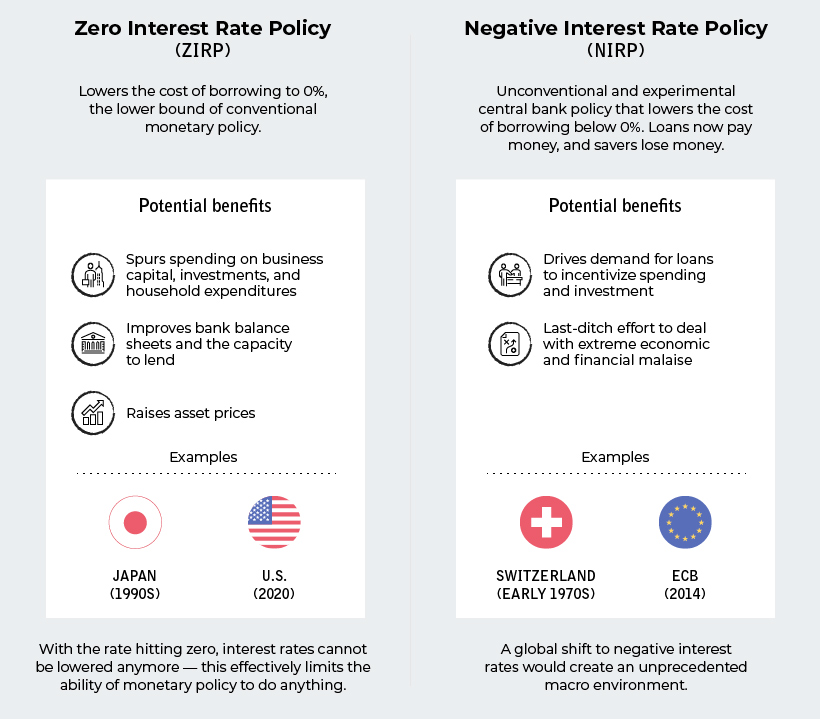
With rates sitting at zero, it’s not impossible for the Fed and other central banks to begin toying more seriously with the idea of negative rates. Such a move would be bold, but also seen as highly experimental and risky with unforeseen consequences.
Global Rate Slashing
Since only the beginning of March, the world’s central banks have cut interest rates on 37 separate occasions.
The only exception to this rule was the National Bank of Kazakhstan, which raised its key rate by 2.75% to support its currency in light of current oil prices. Even so, the Kazakhstani tenge has lost roughly 15% of its value against the U.S. dollar since February.
Here’s a look at cumulative interest rate cuts by some of the world’s most important central banks, from January 1, 2020 until today:
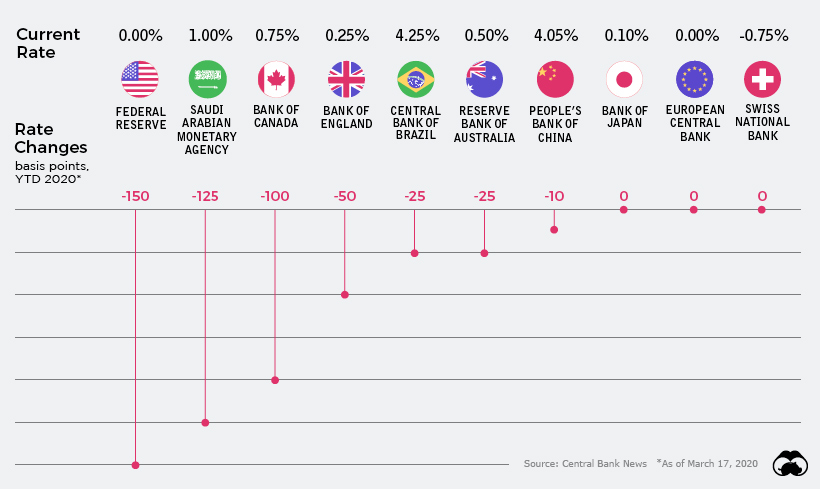
Going into the year, rates in developed economies were already between 0% and 2%.
Despite not having much room to work with, banks have slashed rates where they can — and now out of major developed economies, Canada has the “highest” interest rate at just 0.75%.
Helicopters on the Horizon
With central banks running out of ammo for the use of traditional measures, the conversation is quickly shifting to unconventional measures such as “helicopter money” and NIRP.
Life is already surreal as societal measures to defend against the spread of COVID-19 unfold; pretty soon, monetary measures taken around the globe may seem just as bizarre.
Put another way, unless something changes fast and miraculously, we could be moving into an unprecedented monetary environment where up is down, and down is up. At that point, it’s anybody’s guess as to how things will shake out going forward.


Markets
U.S. Debt Interest Payments Reach $1 Trillion
U.S. debt interest payments have surged past the $1 trillion dollar mark, amid high interest rates and an ever-expanding debt burden.


U.S. Debt Interest Payments Reach $1 Trillion
This was originally posted on our Voronoi app. Download the app for free on iOS or Android and discover incredible data-driven charts from a variety of trusted sources.
The cost of paying for America’s national debt crossed the $1 trillion dollar mark in 2023, driven by high interest rates and a record $34 trillion mountain of debt.
Over the last decade, U.S. debt interest payments have more than doubled amid vast government spending during the pandemic crisis. As debt payments continue to soar, the Congressional Budget Office (CBO) reported that debt servicing costs surpassed defense spending for the first time ever this year.
This graphic shows the sharp rise in U.S. debt payments, based on data from the Federal Reserve.
A $1 Trillion Interest Bill, and Growing
Below, we show how U.S. debt interest payments have risen at a faster pace than at another time in modern history:
| Date | Interest Payments | U.S. National Debt |
|---|---|---|
| 2023 | $1.0T | $34.0T |
| 2022 | $830B | $31.4T |
| 2021 | $612B | $29.6T |
| 2020 | $518B | $27.7T |
| 2019 | $564B | $23.2T |
| 2018 | $571B | $22.0T |
| 2017 | $493B | $20.5T |
| 2016 | $460B | $20.0T |
| 2015 | $435B | $18.9T |
| 2014 | $442B | $18.1T |
| 2013 | $425B | $17.2T |
| 2012 | $417B | $16.4T |
| 2011 | $433B | $15.2T |
| 2010 | $400B | $14.0T |
| 2009 | $354B | $12.3T |
| 2008 | $380B | $10.7T |
| 2007 | $414B | $9.2T |
| 2006 | $387B | $8.7T |
| 2005 | $355B | $8.2T |
| 2004 | $318B | $7.6T |
| 2003 | $294B | $7.0T |
| 2002 | $298B | $6.4T |
| 2001 | $318B | $5.9T |
| 2000 | $353B | $5.7T |
| 1999 | $353B | $5.8T |
| 1998 | $360B | $5.6T |
| 1997 | $368B | $5.5T |
| 1996 | $362B | $5.3T |
| 1995 | $357B | $5.0T |
| 1994 | $334B | $4.8T |
| 1993 | $311B | $4.5T |
| 1992 | $306B | $4.2T |
| 1991 | $308B | $3.8T |
| 1990 | $298B | $3.4T |
| 1989 | $275B | $3.0T |
| 1988 | $254B | $2.7T |
| 1987 | $240B | $2.4T |
| 1986 | $225B | $2.2T |
| 1985 | $219B | $1.9T |
| 1984 | $205B | $1.7T |
| 1983 | $176B | $1.4T |
| 1982 | $157B | $1.2T |
| 1981 | $142B | $1.0T |
| 1980 | $113B | $930.2B |
| 1979 | $96B | $845.1B |
| 1978 | $84B | $789.2B |
| 1977 | $69B | $718.9B |
| 1976 | $61B | $653.5B |
| 1975 | $55B | $576.6B |
| 1974 | $50B | $492.7B |
| 1973 | $45B | $469.1B |
| 1972 | $39B | $448.5B |
| 1971 | $36B | $424.1B |
| 1970 | $35B | $389.2B |
| 1969 | $30B | $368.2B |
| 1968 | $25B | $358.0B |
| 1967 | $23B | $344.7B |
| 1966 | $21B | $329.3B |
Interest payments represent seasonally adjusted annual rate at the end of Q4.
At current rates, the U.S. national debt is growing by a remarkable $1 trillion about every 100 days, equal to roughly $3.6 trillion per year.
As the national debt has ballooned, debt payments even exceeded Medicaid outlays in 2023—one of the government’s largest expenditures. On average, the U.S. spent more than $2 billion per day on interest costs last year. Going further, the U.S. government is projected to spend a historic $12.4 trillion on interest payments over the next decade, averaging about $37,100 per American.
Exacerbating matters is that the U.S. is running a steep deficit, which stood at $1.1 trillion for the first six months of fiscal 2024. This has accelerated due to the 43% increase in debt servicing costs along with a $31 billion dollar increase in defense spending from a year earlier. Additionally, a $30 billion increase in funding for the Federal Deposit Insurance Corporation in light of the regional banking crisis last year was a major contributor to the deficit increase.
Overall, the CBO forecasts that roughly 75% of the federal deficit’s increase will be due to interest costs by 2034.

-

 Technology2 weeks ago
Ranked: The Most Popular Smartphone Brands in the U.S.
-

 Automotive1 week ago
Almost Every EV Stock is Down After Q1 2024
-

 Money1 week ago
Where Does One U.S. Tax Dollar Go?
-

 Green2 weeks ago
Ranked: Top Countries by Total Forest Loss Since 2001
-

 Real Estate2 weeks ago
Visualizing America’s Shortage of Affordable Homes
-

 Maps2 weeks ago
Mapped: Average Wages Across Europe
-

 Mining2 weeks ago
Charted: The Value Gap Between the Gold Price and Gold Miners
-

 Demographics2 weeks ago
Visualizing the Size of the Global Senior Population