Datastream
Charted: Money Can Buy Happiness After All
The Briefing
- Previous research has indicated that money stops buying happiness after $75,000/year
- However, new research finds a strong correlation between income and happiness, trending upwards even after $80,000/year
In One Chart: Money Can Buy Happiness After All
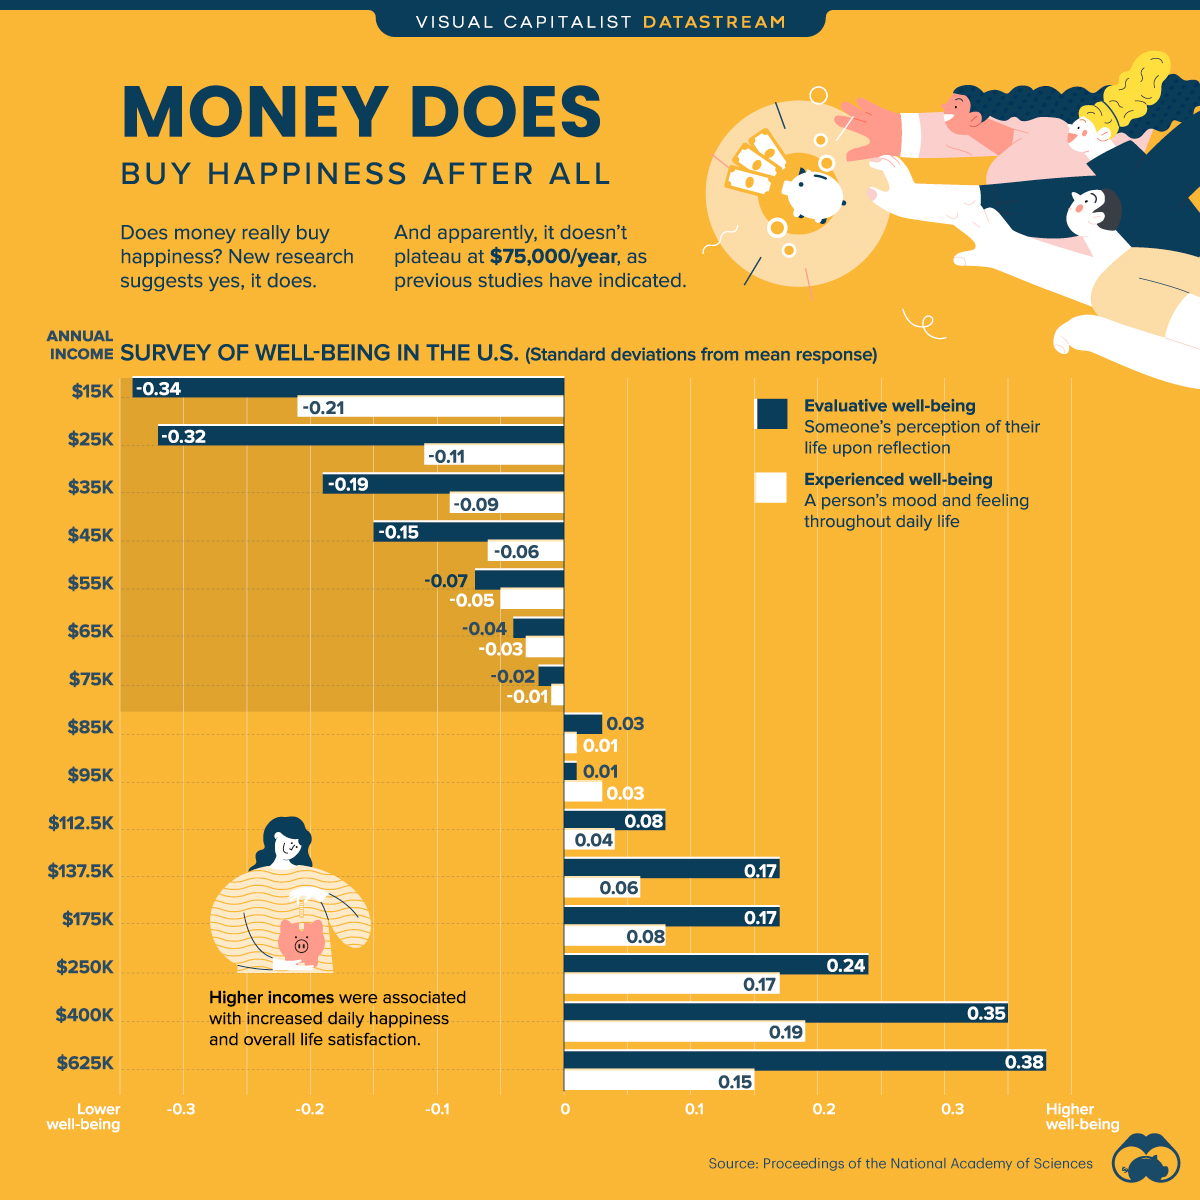
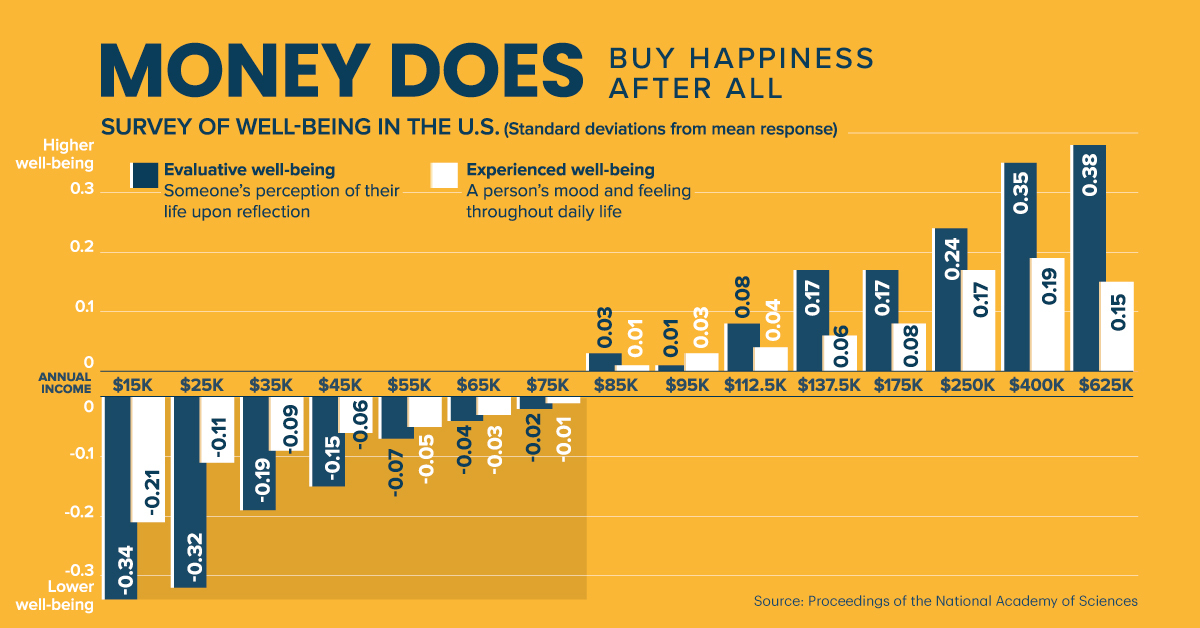
What’s the relationship between money and happiness? Previous studies have indicated that, while money can in fact buy happiness, it plateaus at approximately $75,000/year.
However, new research suggests otherwise.
Using over a million real-time reports from a large U.S. sample group, a recent study found that happiness increases linearly with reported income (logarithmic), and continues to rise beyond the $80,000/year mark.
Below, we’ll provide more details on the research methodology, while touching on a few possible reasons why higher incomes may improve people’s happiness levels.
How is Happiness Measured?
Past research on happiness relative to income has relied on retrospective data, which leaves room for human memory errors. In contrast, this new study uses real-time, logged data from a mood tracking app, allowing for a more accurate representation of respondents’ experienced well-being.
Data was also collected by random prompts over a period of time, with dozens of entries logged for each single respondent. This provides a more well-rounded representation of a person’s overall well-being.
Two forms of well-being were measured in this study:
- Experienced well-being
A person’s mood and feeling throughout daily life. - Evaluative well-being:
Someone’s perception of their life upon reflection.
Both forms of well-being increased with higher incomes, but evaluative well-being showed a more drastic split between the lower and higher income groups.
The Results (Measured in Standard Deviations from Mean)
| Annual Income | Well-Being (Experienced) | Well-Being (Evaluative) |
|---|---|---|
| $15,000 | -0.21 | -0.34 |
| $25,000 | -0.11 | -0.32 |
| $35,000 | -0.09 | -0.19 |
| $45,000 | -0.06 | -0.15 |
| $55,000 | -0.05 | -0.07 |
| $65,000 | -0.03 | -0.04 |
| $75,000 | -0.01 | -0.02 |
| $85,000 | 0.01 | 0.03 |
| $95,000 | 0.03 | 0.01 |
| $112,500 | 0.04 | 0.08 |
| $137,500 | 0.06 | 0.17 |
| $175,000 | 0.08 | 0.17 |
| $250,000 | 0.17 | 0.24 |
| $400,000 | 0.19 | 0.35 |
| $625,000 | 0.15 | 0.38 |
Why Does Money Buy Happiness?
The report warns that any theories behind why happiness increases with income are purely speculative. However, it does list a few possibilities:
- Increased comfort
As someone earns more, they may have the ability to purchase things that reduce suffering. This is particularly true when comparing low to moderate income groups—larger incomes below $80,000/year still showed a strong association with reduced negative feelings. - More control
Control seems to be tied to respondents’ happiness levels. In fact, having a sense of control accounted for 74% of the association between income and well-being. - Money matters
Not all respondents cared about money. But for those who did, it had a significant impact on their perceived well-being. In general, lower income earners were happier if they didn’t value money, while higher income earners were happier if they thought money mattered.
Whatever the cause may be, one thing is clear—Biggie Smalls was wrong. Looks like more money doesn’t necessarily mean more problems.
»Like this? Then you might enjoy this article, Which Countries are the Most (and Least) Happy?
Where does this data come from?
Source: Proceedings of the National Academy of Sciences
Details: Participants were 33,391 employed adults living in the United States; median age was 33; median household income was $85,000/y (25th percentile = $45,000; 75th percentile = $137,500; mean = $106,548; SD = $95,393); 36% were male; and 37% were married


Datastream
Can You Calculate Your Daily Carbon Footprint?
Discover how the average person’s carbon footprint impacts the environment and learn how carbon credits can offset your carbon footprint.


The Briefing
- A person’s carbon footprint is substantial, with activities such as food consumption creating as much as 4,500 g of CO₂ emissions daily.
- By purchasing carbon credits from Carbon Streaming Corporation, you can offset your own emissions and fund positive climate action.
Your Everyday Carbon Footprint
While many large businesses and countries have committed to net-zero goals, it is essential to acknowledge that your everyday activities also contribute to global emissions.
In this graphic, sponsored by Carbon Streaming Corporation, we will explore how the choices we make and the products we use have a profound impact on our carbon footprint.
Carbon Emissions by Activity
Here are some of the daily activities and products of the average person and their carbon footprint, according to Clever Carbon.
| Household Activities & Products | CO2 Emissions (g) |
|---|---|
| 💡 Standard Light Bulb (100 watts, four hours) | 172 g |
| 📱 Mobile Phone Use (195 minutes per day)* | 189 g |
| 👕 Washing Machine (0.63 kWh) | 275 g |
| 🔥 Electric Oven (1.56 kWh) | 675 g |
| ♨️ Tumble Dryer (2.5 kWh) | 1,000 g |
| 🧻 Toilet Roll (2 ply) | 1,300 g |
| 🚿 Hot Shower (10 mins) | 2,000 g |
| 🚙 Daily Commute (one hour, by car) | 3,360 g |
| 🍽️ Average Daily Food Consumption (three meals of 600 calories) | 4,500 g |
| *Phone use based on yearly use of 69kg per the source, Reboxed | |
Your choice of transportation plays a crucial role in determining your carbon footprint. For instance, a 15 km daily commute to work on public transport generates an average of 1,464 g of CO₂ emissions. Compared to 3,360 g—twice the volume for a journey the same length by car.
By opting for more sustainable modes of transport, such as cycling, walking, or public transportation, you can significantly reduce your carbon footprint.
Addressing Your Carbon Footprint
One way to compensate for your emissions is by purchasing high-quality carbon credits.
Carbon credits are used to help fund projects that avoid, reduce or remove CO₂ emissions. This includes nature-based solutions such as reforestation and improved forest management, or technology-based solutions such as the production of biochar and carbon capture and storage (CCS).
While carbon credits offer a potential solution for individuals to help reduce global emissions, public awareness remains a significant challenge. A BCG-Patch survey revealed that only 34% of U.S. consumers are familiar with carbon credits, and only 3% have purchased them in the past.
About Carbon Streaming
By financing the creation or expansion of carbon projects, Carbon Streaming Corporation secures the rights to future carbon credits generated by these sustainable projects. You can then purchase these carbon credits to help fund climate solutions around the world and compensate for your own emissions.
Ready to get involved?
>> Learn more about purchasing carbon credits at Carbon Streaming

-

 Markets1 week ago
U.S. Debt Interest Payments Reach $1 Trillion
-

 Business2 weeks ago
Charted: Big Four Market Share by S&P 500 Audits
-

 Real Estate2 weeks ago
Ranked: The Most Valuable Housing Markets in America
-

 Money2 weeks ago
Which States Have the Highest Minimum Wage in America?
-

 AI2 weeks ago
Ranked: Semiconductor Companies by Industry Revenue Share
-

 Markets2 weeks ago
Ranked: The World’s Top Flight Routes, by Revenue
-

 Demographics2 weeks ago
Population Projections: The World’s 6 Largest Countries in 2075
-

 Markets2 weeks ago
The Top 10 States by Real GDP Growth in 2023