Technology
Chart: The Largest Companies by Market Cap Over 15 Years
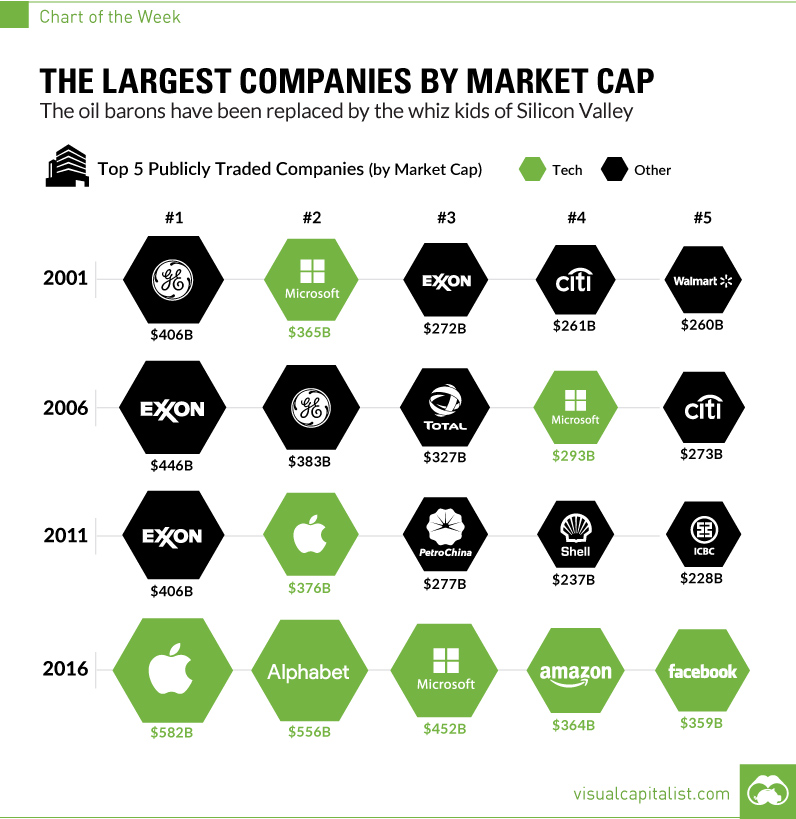
Chart: The Largest Companies by Market Cap Over 15 Years
The Oil Barons have been replaced by the Whiz Kids of Silicon Valley
The Chart of the Week is a weekly Visual Capitalist feature on Fridays.
By definition, the largest companies by market cap are the most valued by investors in absolute terms.
Of course, these companies change all the time. Secular trends rise and fall, and economic cycles rinse and repeat. New companies are built, while former “blue chips” may struggle. For every Enron that busts, there’s an Amazon shooting up through the ranks.
At the end of the day, however, a snapshot of the largest companies at a given time tells us what the market valued the most. And as this week’s chart shows, this simple data series can also tell us a surprising amount about the macroeconomic story over recent years.
Energy Downturn, Tech Upturn
In 2001, oil was about $30/bbl. Only one oil company (Exxon) cracked the top five list by market cap at the time.
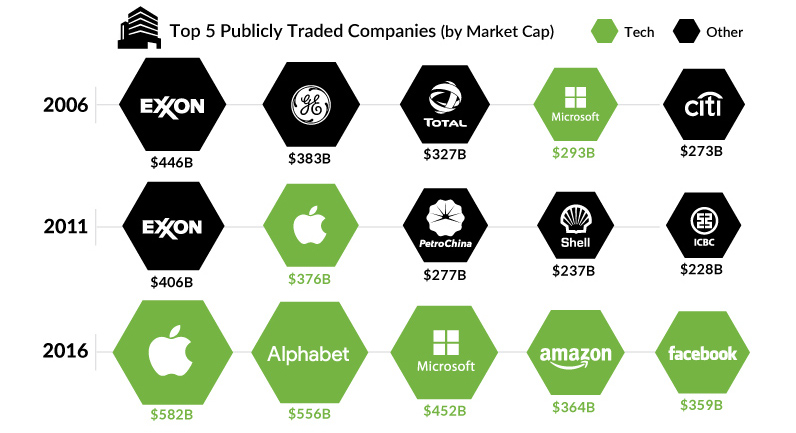
Fast forward a decade, when oil prices soared to the $100/bbl neighborhood. At this point, three of five of the largest companies by market cap were now in the oil business: Exxon, PetroChina, and Royal Dutch Shell.
And today? We are back at $40/bbl and no energy companies crack the top five. Instead, the list has been completely replaced by tech companies, including Apple, Alphabet, Amazon, Facebook, and Microsoft.
Scale is in Style
Well, scale has always been in style, but now it is achievable in ways like never before. To reach more people, Walmart had to build more stores, expand complex supply chains, and hire new employees. This takes a lot of capital and manpower, and the stakes are high for each new expansion.
Amazon on the other hand, can bring in more revenues with less of the work or risk involved. Scale allows tech companies to get bigger without getting bogged down by many of the problems that companies with millions of employees can run into.
The world’s best tech companies are also able to gain competitive advantages that are extremely difficult to supplant. While oil companies are fighting over a limited supply and have a commoditized end product, Google and Facebook have key businesses that are truly unique and the best at what they do.
For these reasons, tech is likely to top the leaderboard for the largest companies by market cap for the foreseeable future.


Technology
Visualizing AI Patents by Country
See which countries have been granted the most AI patents each year, from 2012 to 2022.


Visualizing AI Patents by Country
This was originally posted on our Voronoi app. Download the app for free on iOS or Android and discover incredible data-driven charts from a variety of trusted sources.
This infographic shows the number of AI-related patents granted each year from 2010 to 2022 (latest data available). These figures come from the Center for Security and Emerging Technology (CSET), accessed via Stanford University’s 2024 AI Index Report.
From this data, we can see that China first overtook the U.S. in 2013. Since then, the country has seen enormous growth in the number of AI patents granted each year.
| Year | China | EU and UK | U.S. | RoW | Global Total |
|---|---|---|---|---|---|
| 2010 | 307 | 137 | 984 | 571 | 1,999 |
| 2011 | 516 | 129 | 980 | 581 | 2,206 |
| 2012 | 926 | 112 | 950 | 660 | 2,648 |
| 2013 | 1,035 | 91 | 970 | 627 | 2,723 |
| 2014 | 1,278 | 97 | 1,078 | 667 | 3,120 |
| 2015 | 1,721 | 110 | 1,135 | 539 | 3,505 |
| 2016 | 1,621 | 128 | 1,298 | 714 | 3,761 |
| 2017 | 2,428 | 144 | 1,489 | 1,075 | 5,136 |
| 2018 | 4,741 | 155 | 1,674 | 1,574 | 8,144 |
| 2019 | 9,530 | 322 | 3,211 | 2,720 | 15,783 |
| 2020 | 13,071 | 406 | 5,441 | 4,455 | 23,373 |
| 2021 | 21,907 | 623 | 8,219 | 7,519 | 38,268 |
| 2022 | 35,315 | 1,173 | 12,077 | 13,699 | 62,264 |
In 2022, China was granted more patents than every other country combined.
While this suggests that the country is very active in researching the field of artificial intelligence, it doesn’t necessarily mean that China is the farthest in terms of capability.
Key Facts About AI Patents
According to CSET, AI patents relate to mathematical relationships and algorithms, which are considered abstract ideas under patent law. They can also have different meaning, depending on where they are filed.
In the U.S., AI patenting is concentrated amongst large companies including IBM, Microsoft, and Google. On the other hand, AI patenting in China is more distributed across government organizations, universities, and tech firms (e.g. Tencent).
In terms of focus area, China’s patents are typically related to computer vision, a field of AI that enables computers and systems to interpret visual data and inputs. Meanwhile America’s efforts are more evenly distributed across research fields.
Learn More About AI From Visual Capitalist
If you want to see more data visualizations on artificial intelligence, check out this graphic that shows which job departments will be impacted by AI the most.

-

 Mining1 week ago
Gold vs. S&P 500: Which Has Grown More Over Five Years?
-

 Markets2 weeks ago
Ranked: The Most Valuable Housing Markets in America
-

 Money2 weeks ago
Which States Have the Highest Minimum Wage in America?
-

 AI2 weeks ago
Ranked: Semiconductor Companies by Industry Revenue Share
-

 Markets2 weeks ago
Ranked: The World’s Top Flight Routes, by Revenue
-

 Countries2 weeks ago
Population Projections: The World’s 6 Largest Countries in 2075
-

 Markets2 weeks ago
The Top 10 States by Real GDP Growth in 2023
-

 Demographics2 weeks ago
The Smallest Gender Wage Gaps in OECD Countries