Energy
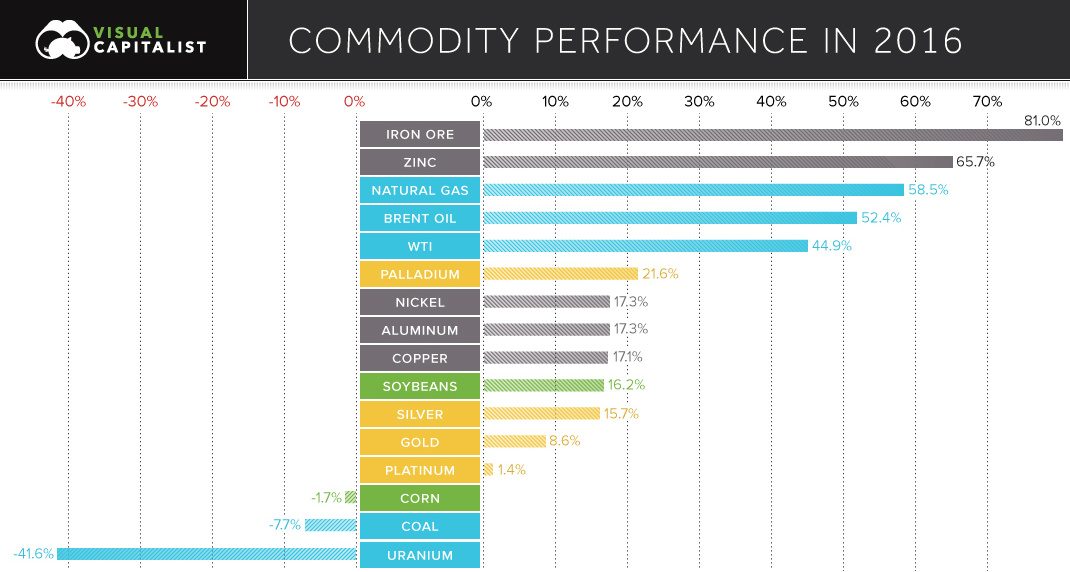
Chart: How Every Commodity Performed in 2016
Presented by: 
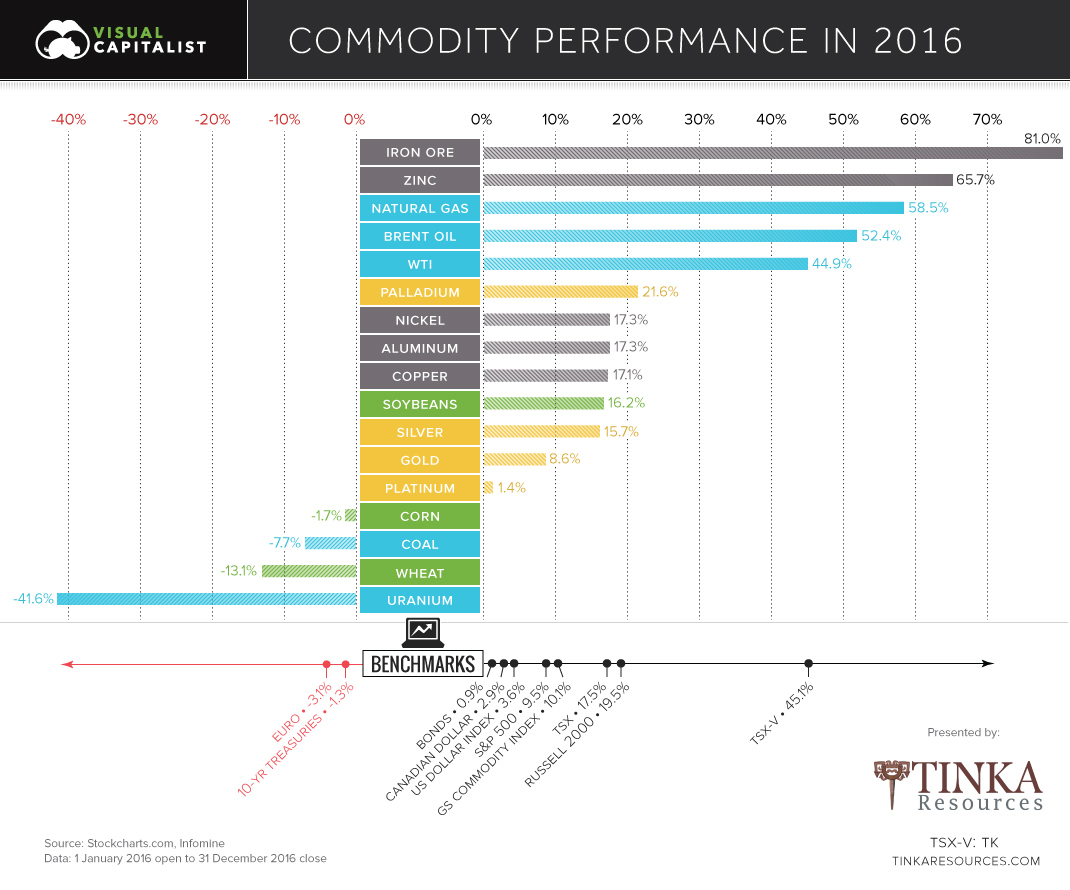
2016 Commodity Performance
It was an up and down year for commodities, but things ultimately finished in the black.
The S&P Goldman Sachs Commodity Index (GSCI) climbed 10.1% on the year – it was just enough to edge out the S&P 500, which ended 2016 with a 9.5% return.
Winners in 2016
The biggest winners on the year were base metals and the oil and gas sector.
Here’s how base metals did:
| Base Metal | Q1 | Q2 | Q3 | Q4 | 2016 |
|---|---|---|---|---|---|
| Iron Ore | 37.0% | -6.2% | 6.3% | 31.1% | 81.0% |
| Zinc | 20.0% | 13.1% | -3.2% | 26.1% | 65.7% |
| Nickel | -3.1% | 13.9% | 11.9% | -5.0% | 17.3% |
| Aluminum | 3.8% | 7.2% | 1.4% | 4.0% | 17.3% |
| Copper | 0.1% | 3.9% | -0.5% | 13.1% | 17.1% |
Iron ore and zinc were the best performing commodities on the face of the planet in 2016. Iron finished up 81%, its first calendar gain in four years. Meanwhile, zinc shot up 65.7% on the year as major zinc mines shut down, and supply stockpiles dwindled.
Oil and gas also posted a major comeback in 2016:
| Energy | Q1 | Q2 | Q3 | Q4 | 2016 |
|---|---|---|---|---|---|
| Natural gas | -17.0% | 53.3% | -2.7% | 28.0% | 58.5% |
| Oil (Brent) | 0.6% | 35.1% | -1.2% | 13.6% | 52.4% |
| Oil (WTI) | -3.2% | 37.3% | -2.1% | 11.4% | 44.9% |
It was a volatile year overall, but it appears that the worst of the downturn in energy prices is over.
Losers in 2016
Not all energy-related commodities could be so lucky.
Uranium continued its epic nosedive, losing -41.6% on the year. U3O8 now trades for $20.25/lb, a tiny fraction of its previous highs of over $100/lb in 2007.
| Energy Losers | Q1 | Q2 | Q3 | Q4 | 2016 |
|---|---|---|---|---|---|
| Uranium | -16.0% | -7.4% | -12.0% | -14.7% | -41.6% |
| Coal | 0.5% | -9.3% | 1.3% | 0.0% | -7.7% |
Coal has also performed abysmally, at least in North America where CAPP prices finished down on the year -7.7%. We previously showed the decline of coal in three charts, and it seems that coal will likely continue to be an unpopular choice for utility companies in the U.S. and Canada.
That said, it is worth mentioning that Australian coal prices went bonkers earlier this year due to a Chinese administrative oversight.


Energy
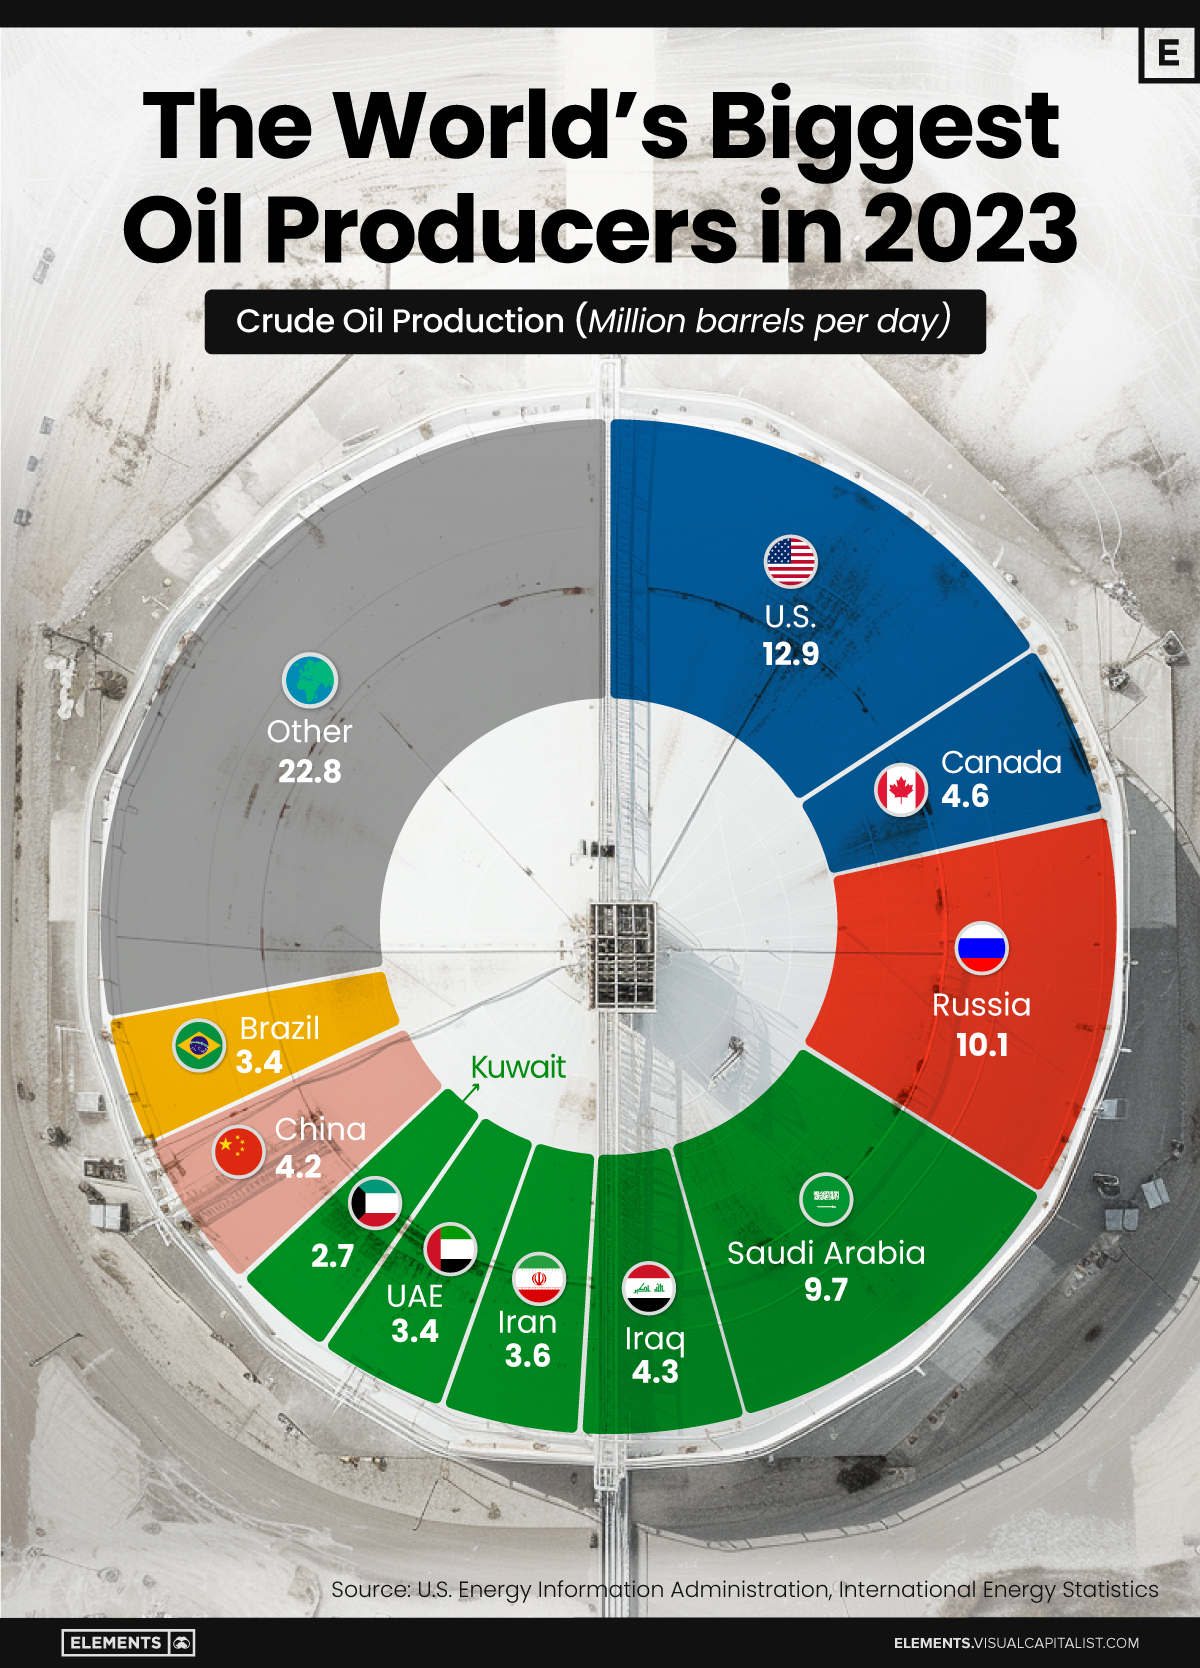
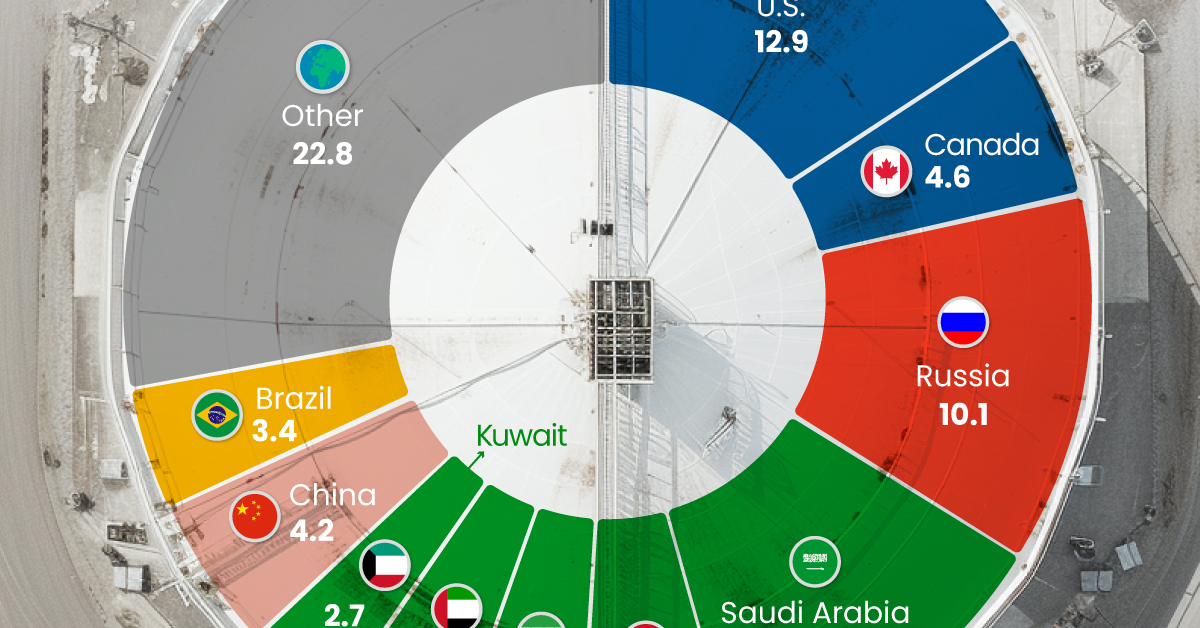
The World’s Biggest Oil Producers in 2023
Just three countries accounted for 40% of global oil production last year.
The World’s Biggest Oil Producers in 2023
This was originally posted on Elements. Sign up to the free mailing list to get beautiful visualizations on natural resource megatrends in your email.
Despite efforts to decarbonize the global economy, oil still remains one of the world’s most important resources. It’s also produced by a fairly limited group of countries, which can be a source of economic and political leverage.
This graphic illustrates global crude oil production in 2023, measured in million barrels per day, sourced from the U.S. Energy Information Administration (EIA).
Three Countries Account for 40% of Global Oil Production
In 2023, the United States, Russia, and Saudi Arabia collectively contributed 32.7 million barrels per day to global oil production.
| Oil Production 2023 | Million barrels per day |
|---|---|
| 🇺🇸 U.S. | 12.9 |
| 🇷🇺 Russia | 10.1 |
| 🇸🇦 Saudi Arabia | 9.7 |
| 🇨🇦 Canada | 4.6 |
| 🇮🇶 Iraq | 4.3 |
| 🇨🇳 China | 4.2 |
| 🇮🇷 Iran | 3.6 |
| 🇧🇷 Brazil | 3.4 |
| 🇦🇪 UAE | 3.4 |
| 🇰🇼 Kuwait | 2.7 |
| 🌍 Other | 22.8 |
These three nations have consistently dominated oil production since 1971. The leading position, however, has alternated among them over the past five decades.
In contrast, the combined production of the next three largest producers—Canada, Iraq, and China—reached 13.1 million barrels per day in 2023, just surpassing the production of the United States alone.
In the near term, no country is likely to surpass the record production achieved by the U.S. in 2023, as no other producer has ever reached a daily capacity of 13.0 million barrels. Recently, Saudi Arabia’s state-owned Saudi Aramco scrapped plans to increase production capacity to 13.0 million barrels per day by 2027.
In 2024, analysts forecast that the U.S. will maintain its position as the top oil producer. In fact, according to Macquarie Group, U.S. oil production is expected to achieve a record pace of about 14 million barrels per day by the end of the year.

-

 Misc2 weeks ago
Tesla Is Once Again the World’s Best-Selling EV Company
-

 AI1 week ago
The Stock Performance of U.S. Chipmakers So Far in 2024
-

 Misc1 week ago
Almost Every EV Stock is Down After Q1 2024
-

 Money2 weeks ago
Where Does One U.S. Tax Dollar Go?
-

 Green2 weeks ago
Ranked: Top Countries by Total Forest Loss Since 2001
-

 Real Estate2 weeks ago
Visualizing America’s Shortage of Affordable Homes
-

 Maps2 weeks ago
Mapped: Average Wages Across Europe
-

 Mining2 weeks ago
Charted: The Value Gap Between the Gold Price and Gold Miners