Markets
The Economic Impact of Violence
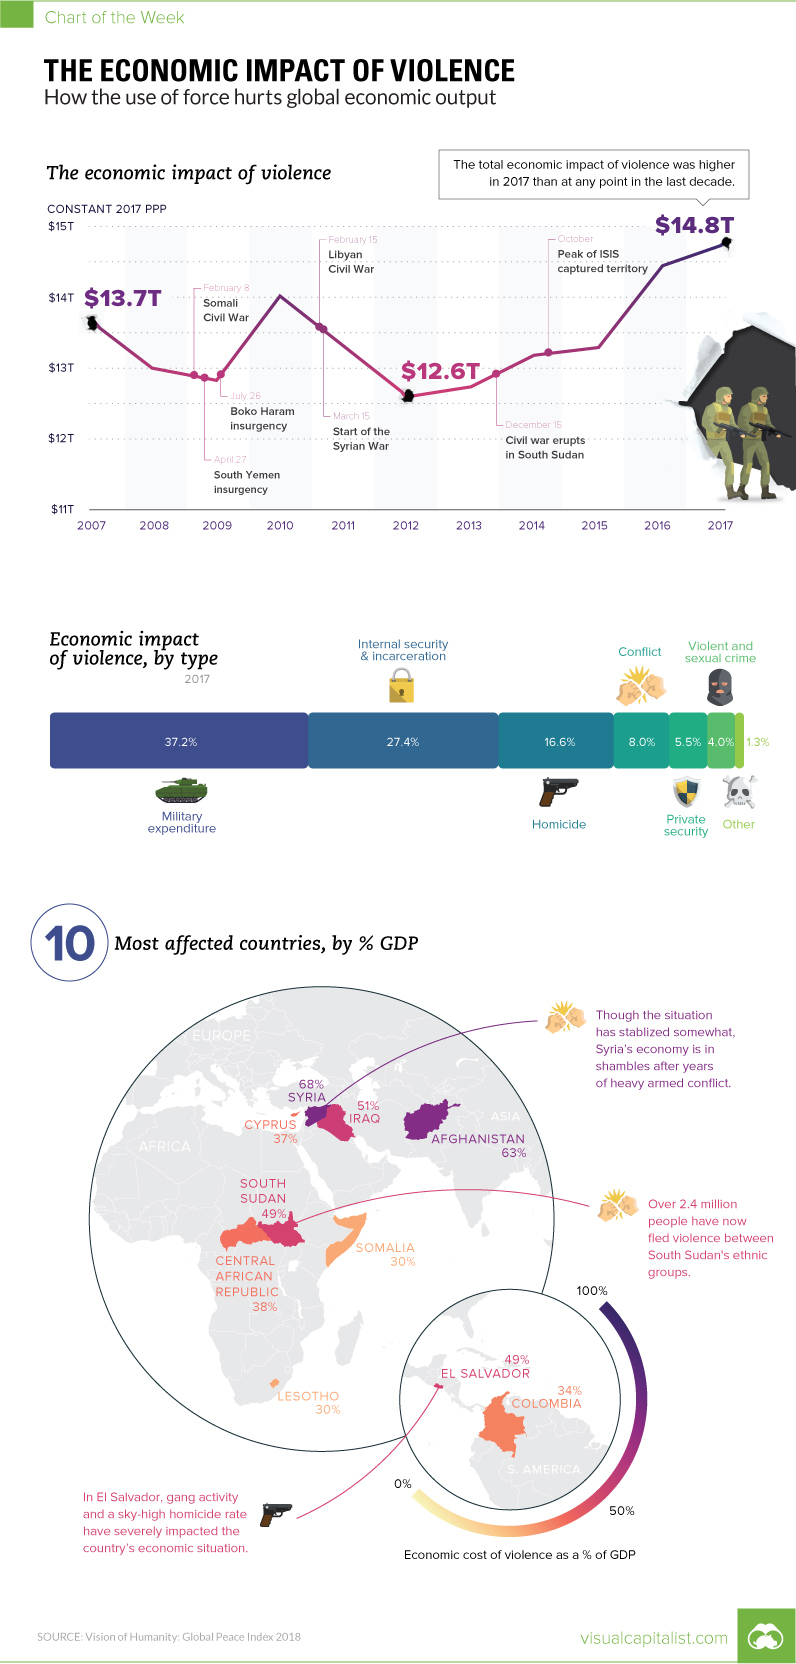
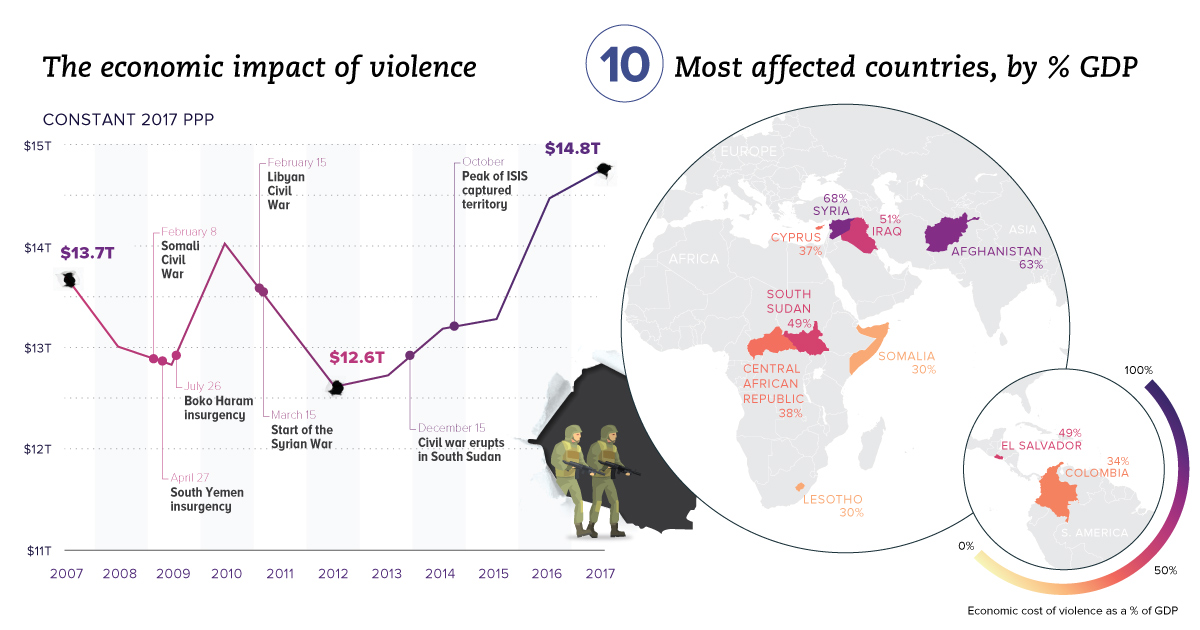
The Economic Impact of Violence
The Chart of the Week is a weekly Visual Capitalist feature on Fridays.
When you regularly buy goods or services, it helps fuel the economy at both the local and national level.
But what if you live in a place like Syria, that is torn apart by a seven-year long civil war?
Aside from the obvious humanitarian costs, these dire circumstances would ultimately change your spending behavior, how businesses operate, and how capital gets utilized. The fact is that conflicts, homicides, terrorism, and other types of violence can hinder productivity and wealth creation, and this ultimately has an impact on families around the world.
Calculating an Economic Impact
In today’s chart, we use data from the Global Peace Index 2018 report, which tries to put a figure on the expenditures and economic effects related to “containing, preventing and dealing with the consequences of violence”.
According to the report, the economic impact of violence to the global economy was $14.76 trillion in 2017 in constant purchasing power parity (PPP) terms. This is roughly 12.4% of world gross domestic product (GDP), or $1,988 per person.
While those figures themselves are quite staggering, how it all breaks down is even more interesting.
Violence by Type
Violence comes in many forms, so how does factor into the economic impact?
The Institute for Economics and Peace, the non-profit think tank that has authored the report for the last 12 years, breaks down economic impacts as follows:
| Type of economic impact | Share of total |
|---|---|
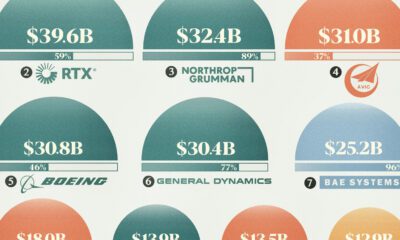
| Military expenditures | 37.2% |
| Internal security & incarceration | 27.4% |
| Homicide | 16.6% |
| Conflict | 8.0% |
| Private security | 5.5% |
| Violent & sexual crime | 4.0% |
| Other | 1.3% |
The vast majority of impact comes from military and security spending, which are both aimed at the prevention or containment of violence. Meanwhile, homicide and conflict – two more direct violent actions – are the next two biggest factors.
Here’s how this breaks down by region:
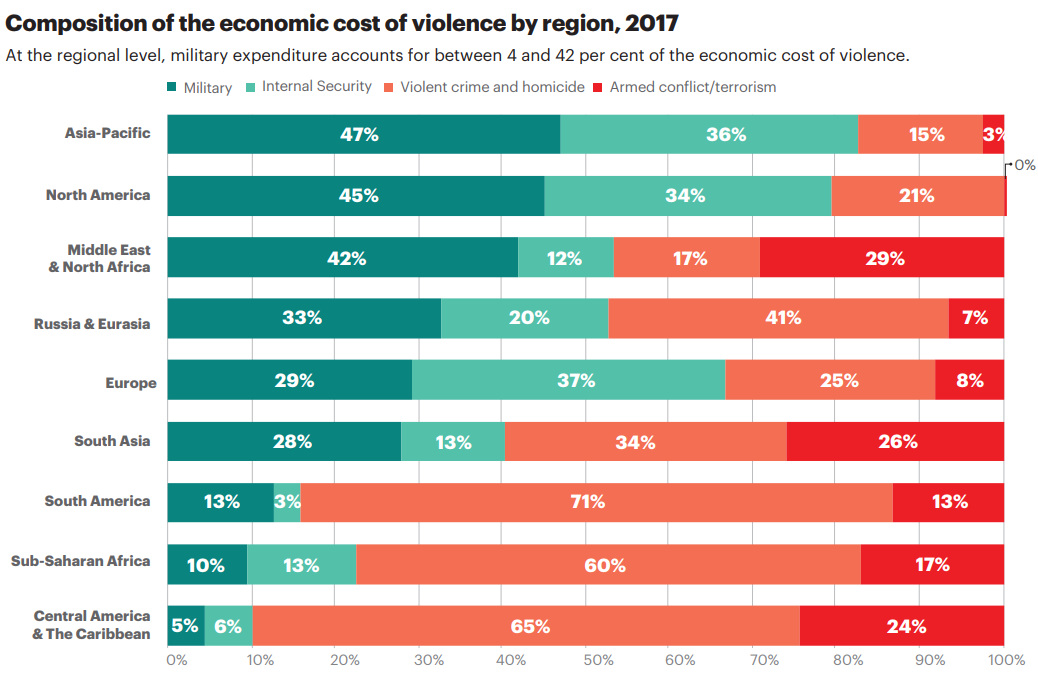
Dollars are going to military and security spending in North America, Asia-Pacific, and Europe. Meanwhile, it’s actual violence like homicides, conflict, and terrorism that cause economic havoc in South America, Central America, and Africa.
The Countries Most Affected
Which countries are impacted the most by violence, as a percentage of their GDP?
Here are the top 10, as per the report:
| Rank | Country | Economic impact (% of GDP) |
|---|---|---|
| #1 | Syria | 68% |
| #2 | Afghanistan | 63% |
| #3 | Iraq | 51% |
| #4 | El Salvador | 49% |
| #5 | South Sudan | 49% |
| #6 | Central African Republic | 38% |
| #7 | Cyprus | 37% |
| #8 | Colombia | 34% |
| #9 | Lesotho | 30% |
| #10 | Somalia | 30% |
Syria, which has been in its civil war for seven years now, is the country most affected by the economic impact of violence. Meanwhile, war-torn Afghanistan is not far behind.
Interestingly, the cost of violence in Latin American countries is comparable to regions that have been at war for years. El Salvador ranks a surprising fourth place, due to its issues with gang activity and a sky-high homicide rate, and Colombia makes the list as well.


Markets
U.S. Debt Interest Payments Reach $1 Trillion
U.S. debt interest payments have surged past the $1 trillion dollar mark, amid high interest rates and an ever-expanding debt burden.


U.S. Debt Interest Payments Reach $1 Trillion
This was originally posted on our Voronoi app. Download the app for free on iOS or Android and discover incredible data-driven charts from a variety of trusted sources.
The cost of paying for America’s national debt crossed the $1 trillion dollar mark in 2023, driven by high interest rates and a record $34 trillion mountain of debt.
Over the last decade, U.S. debt interest payments have more than doubled amid vast government spending during the pandemic crisis. As debt payments continue to soar, the Congressional Budget Office (CBO) reported that debt servicing costs surpassed defense spending for the first time ever this year.
This graphic shows the sharp rise in U.S. debt payments, based on data from the Federal Reserve.
A $1 Trillion Interest Bill, and Growing
Below, we show how U.S. debt interest payments have risen at a faster pace than at another time in modern history:
| Date | Interest Payments | U.S. National Debt |
|---|---|---|
| 2023 | $1.0T | $34.0T |
| 2022 | $830B | $31.4T |
| 2021 | $612B | $29.6T |
| 2020 | $518B | $27.7T |
| 2019 | $564B | $23.2T |
| 2018 | $571B | $22.0T |
| 2017 | $493B | $20.5T |
| 2016 | $460B | $20.0T |
| 2015 | $435B | $18.9T |
| 2014 | $442B | $18.1T |
| 2013 | $425B | $17.2T |
| 2012 | $417B | $16.4T |
| 2011 | $433B | $15.2T |
| 2010 | $400B | $14.0T |
| 2009 | $354B | $12.3T |
| 2008 | $380B | $10.7T |
| 2007 | $414B | $9.2T |
| 2006 | $387B | $8.7T |
| 2005 | $355B | $8.2T |
| 2004 | $318B | $7.6T |
| 2003 | $294B | $7.0T |
| 2002 | $298B | $6.4T |
| 2001 | $318B | $5.9T |
| 2000 | $353B | $5.7T |
| 1999 | $353B | $5.8T |
| 1998 | $360B | $5.6T |
| 1997 | $368B | $5.5T |
| 1996 | $362B | $5.3T |
| 1995 | $357B | $5.0T |
| 1994 | $334B | $4.8T |
| 1993 | $311B | $4.5T |
| 1992 | $306B | $4.2T |
| 1991 | $308B | $3.8T |
| 1990 | $298B | $3.4T |
| 1989 | $275B | $3.0T |
| 1988 | $254B | $2.7T |
| 1987 | $240B | $2.4T |
| 1986 | $225B | $2.2T |
| 1985 | $219B | $1.9T |
| 1984 | $205B | $1.7T |
| 1983 | $176B | $1.4T |
| 1982 | $157B | $1.2T |
| 1981 | $142B | $1.0T |
| 1980 | $113B | $930.2B |
| 1979 | $96B | $845.1B |
| 1978 | $84B | $789.2B |
| 1977 | $69B | $718.9B |
| 1976 | $61B | $653.5B |
| 1975 | $55B | $576.6B |
| 1974 | $50B | $492.7B |
| 1973 | $45B | $469.1B |
| 1972 | $39B | $448.5B |
| 1971 | $36B | $424.1B |
| 1970 | $35B | $389.2B |
| 1969 | $30B | $368.2B |
| 1968 | $25B | $358.0B |
| 1967 | $23B | $344.7B |
| 1966 | $21B | $329.3B |
Interest payments represent seasonally adjusted annual rate at the end of Q4.
At current rates, the U.S. national debt is growing by a remarkable $1 trillion about every 100 days, equal to roughly $3.6 trillion per year.
As the national debt has ballooned, debt payments even exceeded Medicaid outlays in 2023—one of the government’s largest expenditures. On average, the U.S. spent more than $2 billion per day on interest costs last year. Going further, the U.S. government is projected to spend a historic $12.4 trillion on interest payments over the next decade, averaging about $37,100 per American.
Exacerbating matters is that the U.S. is running a steep deficit, which stood at $1.1 trillion for the first six months of fiscal 2024. This has accelerated due to the 43% increase in debt servicing costs along with a $31 billion dollar increase in defense spending from a year earlier. Additionally, a $30 billion increase in funding for the Federal Deposit Insurance Corporation in light of the regional banking crisis last year was a major contributor to the deficit increase.
Overall, the CBO forecasts that roughly 75% of the federal deficit’s increase will be due to interest costs by 2034.

-

 Maps2 weeks ago
Mapped: Average Wages Across Europe
-

 Money1 week ago
Which States Have the Highest Minimum Wage in America?
-

 Real Estate1 week ago
Ranked: The Most Valuable Housing Markets in America
-

 Markets1 week ago
Charted: Big Four Market Share by S&P 500 Audits
-

 AI1 week ago
The Stock Performance of U.S. Chipmakers So Far in 2024
-

 Automotive2 weeks ago
Almost Every EV Stock is Down After Q1 2024
-

 Money2 weeks ago
Where Does One U.S. Tax Dollar Go?
-

 Green2 weeks ago
Ranked: Top Countries by Total Forest Loss Since 2001