Markets
This Chart Shows How Different Generations Would Invest $10,000
How Different Generations Would Invest $10,000
The Chart of the Week is a weekly Visual Capitalist feature on Fridays.
If someone slipped you a $10,000 check and told you to invest it, what would you do with the money?
With no strings attached, there is a wide variety of ways that you could deploy that cash.
You could look at it as a one-time windfall that could shore up your personal balance sheet, or you could go at it much more aggressively. It’s money that you didn’t expect to receive, so why not throw it at high-risk, high-reward assets?
How to Invest $10k?
Today’s chart is based on a survey from LendEDU, which posed this exact question to 1,000 Americans in March 2018:
Question: If you were given $10,000 tax-free and had the ability to invest all of it in one of the following options, which would you choose?
Here are the results of the sample as a whole:
| How to Invest $10K? | % of Respondents |
|---|---|
| Pay down debt | 27.3% |
| Real estate | 13.5% |
| Savings account or CDs | 12.2% |
| 401(k) or Roth IRA | 9.9% |
| Stock market | 7.2% |
| Child's education | 6.9% |
| Small business | 6.2% |
| Virtual currency | 5.1% |
| Education | 3.2% |
| Other/Unsure | 8.5% |
Note: We’ve made slight adjustments to the original answers, combining one low-performing category (P2P loans) into the “Other” category
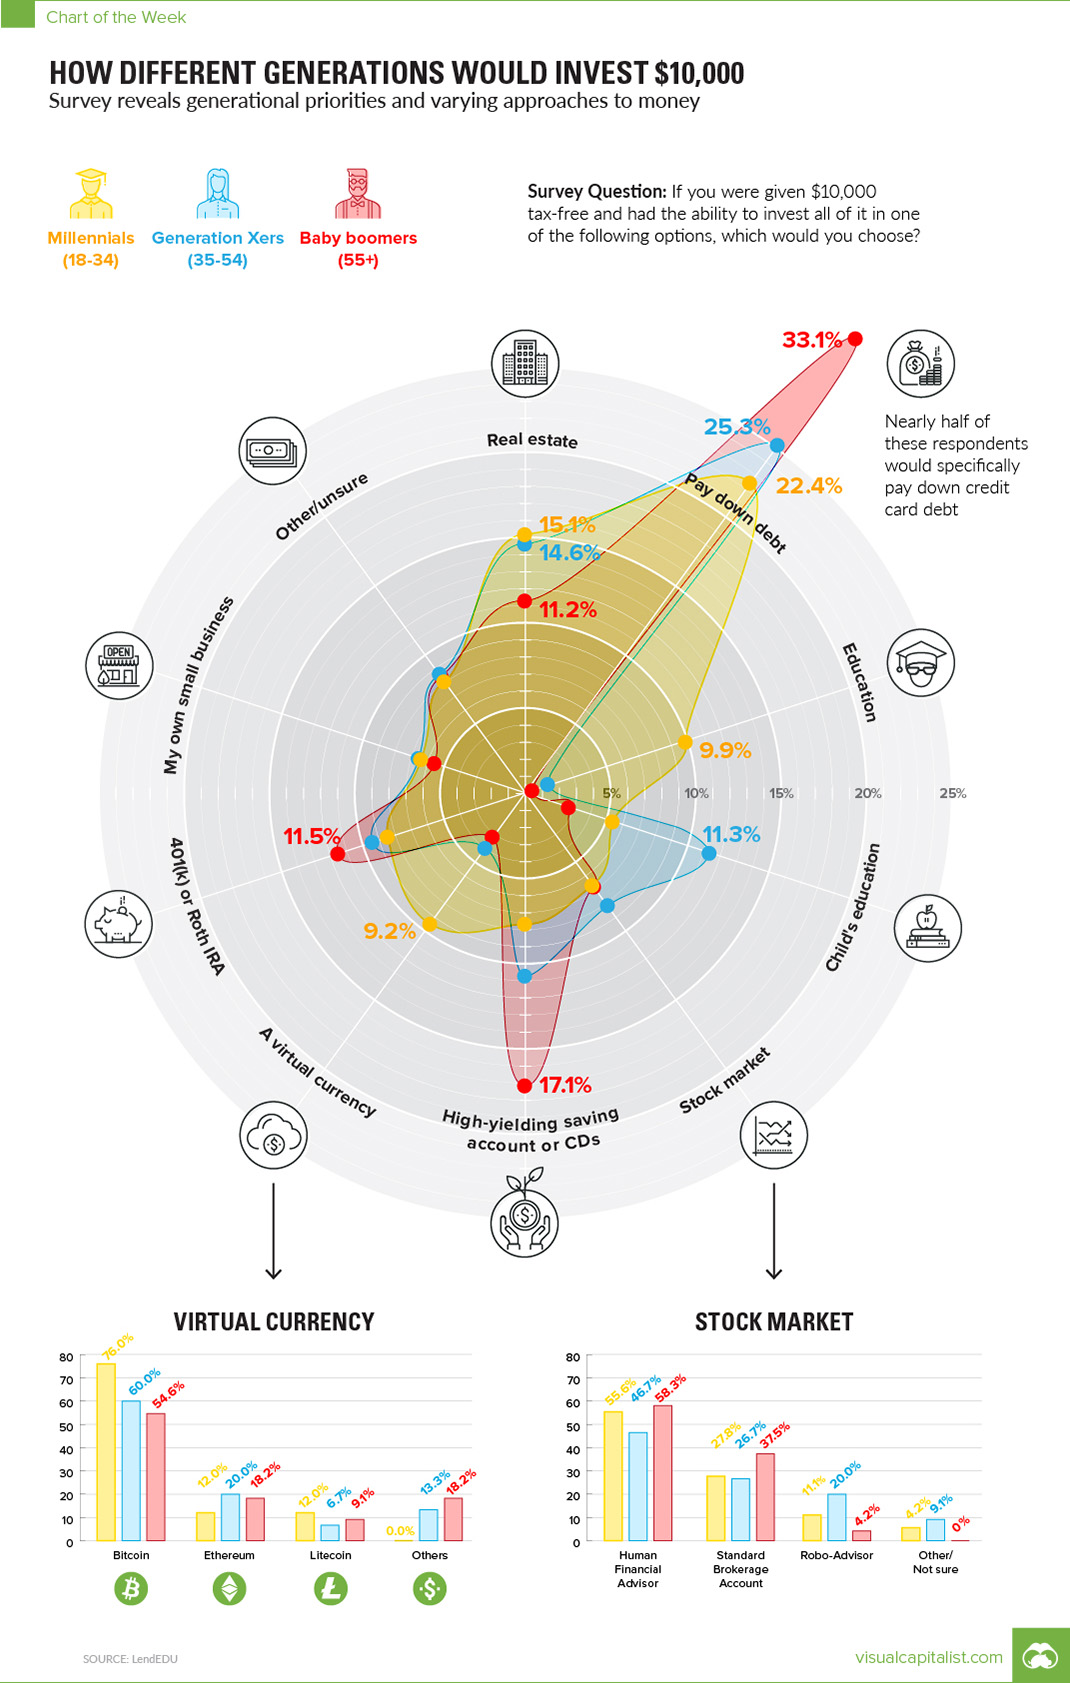
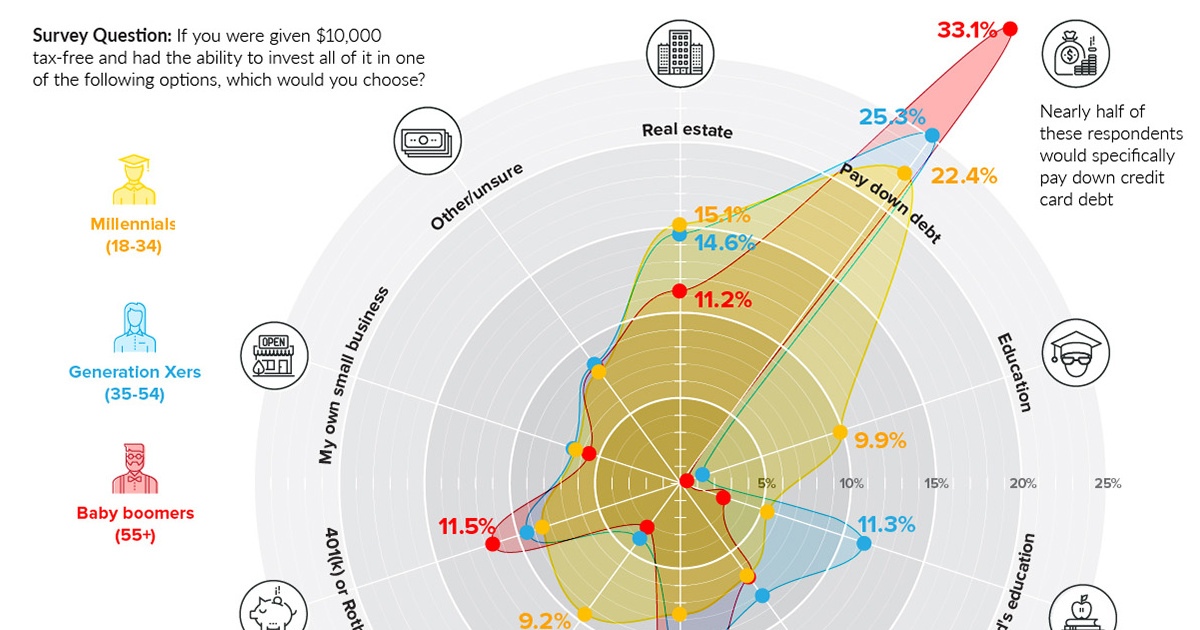
Paying down debt (27.3%) was by far the most popular response. It’s also interesting to see that many people would opt to put the $10k towards their own small business, education, or even digital currencies like Bitcoin, Ethereum, or Litecoin.
Now, here’s the same data grouped together by generations:
| How to Invest $10K? | Millenials (18-34) | Gen X (35-54) | Boomers (55+) |
|---|---|---|---|
| Pay down debt | 22.4% | 25.3% | 33.1% |
| Real estate | 15.1% | 14.6% | 11.2% |
| Education | 9.9% | 1.1% | 0.3% |
| Virtual currency | 9.2% | 4.0% | 3.1% |
| 401(k) or Roth IRA | 8.5% | 9.4% | 11.5% |
| Other/Unsure | 8.1% | 8.6% | 8.7% |
| Savings account or CDs | 7.7% | 10.8% | 17.1% |
| Stock market | 6.6% | 8.1% | 6.7% |
| Child's education | 6.3% | 11.3% | 2.8% |
| Small business | 6.3% | 6.7% | 5.6% |
Interestingly, certain answers had the same popularity across the board for all generations.
All groups were equally interested in investing in their small businesses. The highest response here came from Gen X at 6.7%, but Millennials and Gen X weren’t far off at 6.3% and 5.6% respectively.
In addition, investing in the stock market was pretty consistent as well, with Millennials at 6.6%, Generation X at 8.1%, and Boomers at 6.7%. All these groups were mostly interested in doing this through a human financial advisor, though Gen X gave robo-advisors a higher rate of consideration (20%) than other generations (11% Millennials, 4% Boomers)
Generational Differences
Some generational differences are as to be expected. For instance, barely any Baby Boomers (0.3%) wanted to put $10,000 towards their own education. This makes sense, since many are at or near retirement already. On the other hand, 9.9% of Millennials opted for an investment in education.
But here’s a situation that might be a bit more peculiar. One would guess that with student debt being at $1.5 trillion in the United States, many Millennials would opt to pay down debt with their $10,000 check. Interestingly, fewer Millennials (22.4%) chose to pay down debt than either Gen X (25.3%) or Boomers (33.1%).
On the same token, Millennials were more likely to choose either real estate (15.1%) or cryptocurrency (9.2%) as an investment. For contrast, look at Boomers, a group that had 11.2% choose real estate and only 3.1% choose crypto.


Markets
U.S. Debt Interest Payments Reach $1 Trillion
U.S. debt interest payments have surged past the $1 trillion dollar mark, amid high interest rates and an ever-expanding debt burden.


U.S. Debt Interest Payments Reach $1 Trillion
This was originally posted on our Voronoi app. Download the app for free on iOS or Android and discover incredible data-driven charts from a variety of trusted sources.
The cost of paying for America’s national debt crossed the $1 trillion dollar mark in 2023, driven by high interest rates and a record $34 trillion mountain of debt.
Over the last decade, U.S. debt interest payments have more than doubled amid vast government spending during the pandemic crisis. As debt payments continue to soar, the Congressional Budget Office (CBO) reported that debt servicing costs surpassed defense spending for the first time ever this year.
This graphic shows the sharp rise in U.S. debt payments, based on data from the Federal Reserve.
A $1 Trillion Interest Bill, and Growing
Below, we show how U.S. debt interest payments have risen at a faster pace than at another time in modern history:
| Date | Interest Payments | U.S. National Debt |
|---|---|---|
| 2023 | $1.0T | $34.0T |
| 2022 | $830B | $31.4T |
| 2021 | $612B | $29.6T |
| 2020 | $518B | $27.7T |
| 2019 | $564B | $23.2T |
| 2018 | $571B | $22.0T |
| 2017 | $493B | $20.5T |
| 2016 | $460B | $20.0T |
| 2015 | $435B | $18.9T |
| 2014 | $442B | $18.1T |
| 2013 | $425B | $17.2T |
| 2012 | $417B | $16.4T |
| 2011 | $433B | $15.2T |
| 2010 | $400B | $14.0T |
| 2009 | $354B | $12.3T |
| 2008 | $380B | $10.7T |
| 2007 | $414B | $9.2T |
| 2006 | $387B | $8.7T |
| 2005 | $355B | $8.2T |
| 2004 | $318B | $7.6T |
| 2003 | $294B | $7.0T |
| 2002 | $298B | $6.4T |
| 2001 | $318B | $5.9T |
| 2000 | $353B | $5.7T |
| 1999 | $353B | $5.8T |
| 1998 | $360B | $5.6T |
| 1997 | $368B | $5.5T |
| 1996 | $362B | $5.3T |
| 1995 | $357B | $5.0T |
| 1994 | $334B | $4.8T |
| 1993 | $311B | $4.5T |
| 1992 | $306B | $4.2T |
| 1991 | $308B | $3.8T |
| 1990 | $298B | $3.4T |
| 1989 | $275B | $3.0T |
| 1988 | $254B | $2.7T |
| 1987 | $240B | $2.4T |
| 1986 | $225B | $2.2T |
| 1985 | $219B | $1.9T |
| 1984 | $205B | $1.7T |
| 1983 | $176B | $1.4T |
| 1982 | $157B | $1.2T |
| 1981 | $142B | $1.0T |
| 1980 | $113B | $930.2B |
| 1979 | $96B | $845.1B |
| 1978 | $84B | $789.2B |
| 1977 | $69B | $718.9B |
| 1976 | $61B | $653.5B |
| 1975 | $55B | $576.6B |
| 1974 | $50B | $492.7B |
| 1973 | $45B | $469.1B |
| 1972 | $39B | $448.5B |
| 1971 | $36B | $424.1B |
| 1970 | $35B | $389.2B |
| 1969 | $30B | $368.2B |
| 1968 | $25B | $358.0B |
| 1967 | $23B | $344.7B |
| 1966 | $21B | $329.3B |
Interest payments represent seasonally adjusted annual rate at the end of Q4.
At current rates, the U.S. national debt is growing by a remarkable $1 trillion about every 100 days, equal to roughly $3.6 trillion per year.
As the national debt has ballooned, debt payments even exceeded Medicaid outlays in 2023—one of the government’s largest expenditures. On average, the U.S. spent more than $2 billion per day on interest costs last year. Going further, the U.S. government is projected to spend a historic $12.4 trillion on interest payments over the next decade, averaging about $37,100 per American.
Exacerbating matters is that the U.S. is running a steep deficit, which stood at $1.1 trillion for the first six months of fiscal 2024. This has accelerated due to the 43% increase in debt servicing costs along with a $31 billion dollar increase in defense spending from a year earlier. Additionally, a $30 billion increase in funding for the Federal Deposit Insurance Corporation in light of the regional banking crisis last year was a major contributor to the deficit increase.
Overall, the CBO forecasts that roughly 75% of the federal deficit’s increase will be due to interest costs by 2034.

-

 Green1 week ago
Ranked: The Countries With the Most Air Pollution in 2023
-

 Misc2 weeks ago
Almost Every EV Stock is Down After Q1 2024
-

 AI2 weeks ago
The Stock Performance of U.S. Chipmakers So Far in 2024
-

 Markets2 weeks ago
Charted: Big Four Market Share by S&P 500 Audits
-

 Real Estate2 weeks ago
Ranked: The Most Valuable Housing Markets in America
-

 Money2 weeks ago
Which States Have the Highest Minimum Wage in America?
-

 AI2 weeks ago
Ranked: Semiconductor Companies by Industry Revenue Share
-

 Travel2 weeks ago
Ranked: The World’s Top Flight Routes, by Revenue