Green
Chart: Automakers’ Adoption of Fuel-Saving Technologies
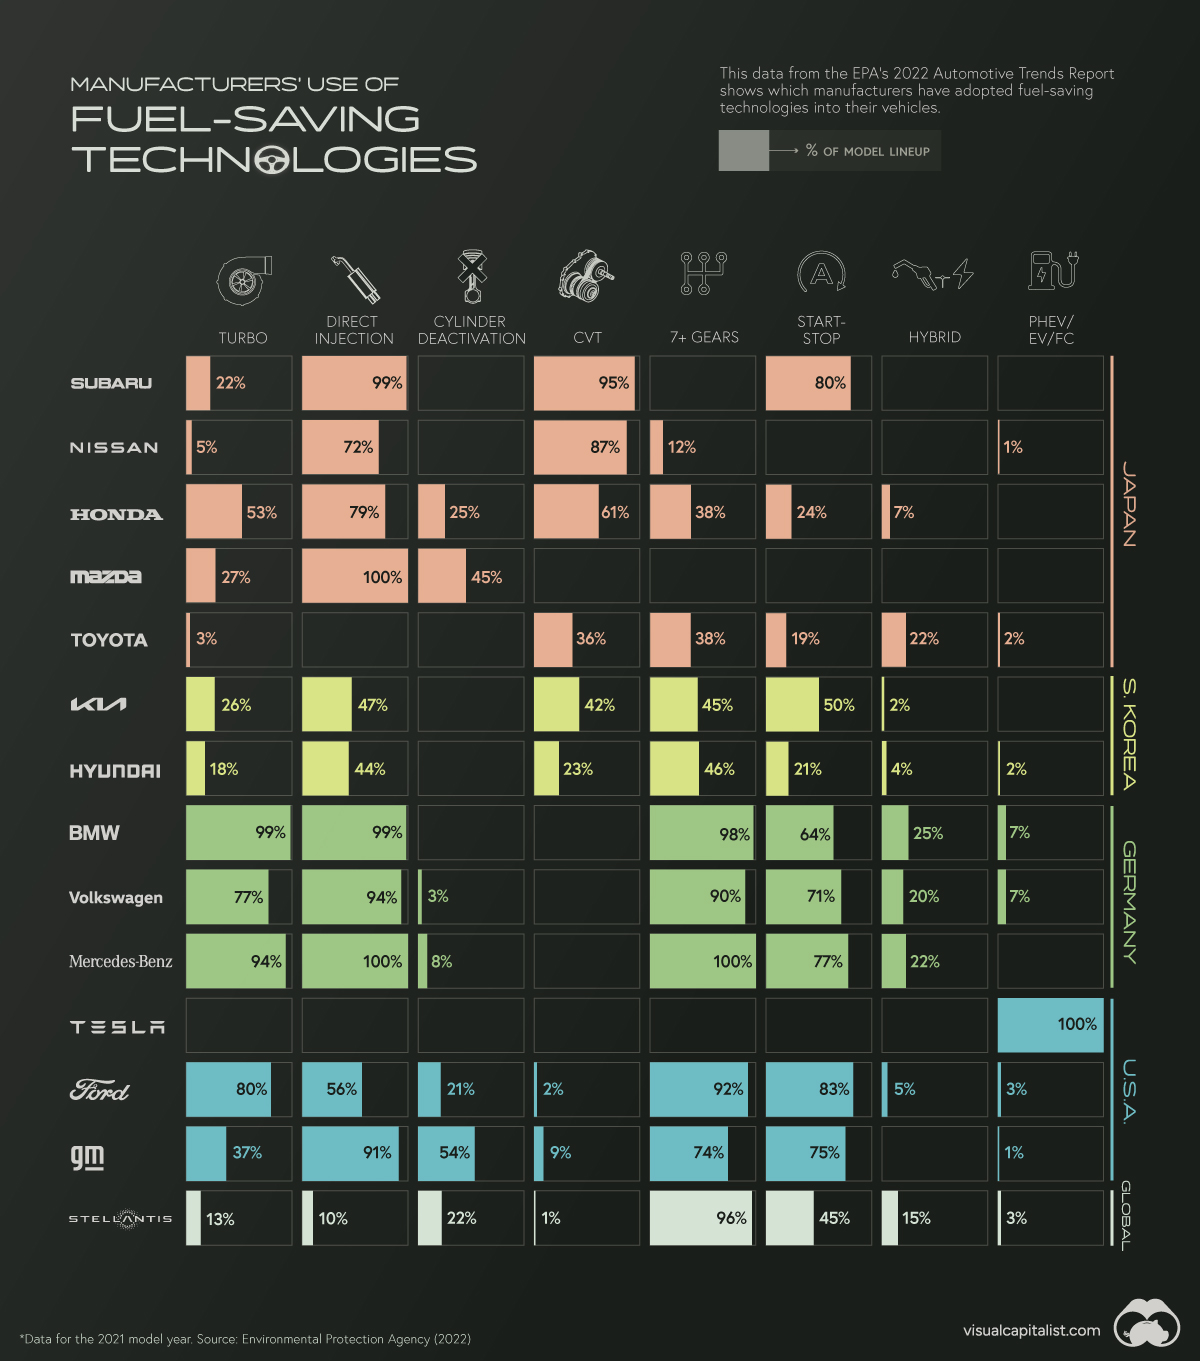


Automakers’ Adoption of Fuel-Saving Technologies
Over the past few decades, automakers have invested plenty of time and money into various fuel-saving technologies. This includes innovations such as direct injection, cylinder deactivation, and auto start-stop features.
Keeping track of which companies have adopted these technologies can be difficult. Thankfully, the EPA’s 2022 Automotive Trends Report includes data that shows which automakers have adopted what technologies.
Understanding the Data
The percentages in this infographic show how 14 major automakers have adopted various fuel-saving technologies into their lineups. The report did not specify if this data is for North American models only.
| Brand | Turbo | Direct Injection | Cylinder Deact. | CVT | 7+ Gears | Start-Stop | Hybrid | PHEV/EV/FC |
|---|---|---|---|---|---|---|---|---|
| Subaru | 22% | 99% | 0% | 95% | 0% | 80% | 0% | 0% |
| Nissan | 5% | 72% | 0% | 87% | 12% | 0% | 0% | 1% |
| Honda | 53% | 79% | 25% | 61% | 38% | 24% | 7% | 0% |
| Mazda | 27% | 100% | 45% | 0% | 0% | 0% | 0% | 0% |
| Toyota | 3% | 0% | 0% | 36% | 38% | 19% | 22% | 2% |
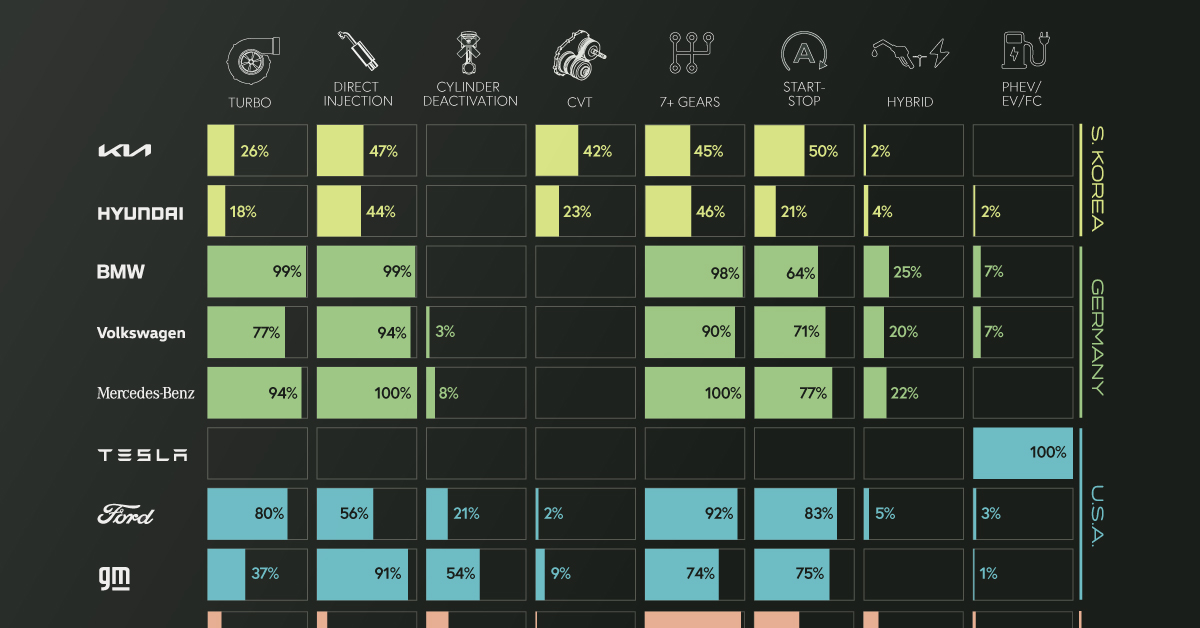
| Kia | 26% | 47% | 0% | 42% | 45% | 50% | 2% | 0% |
| Hyundai | 18% | 44% | 0% | 23% | 46% | 21% | 4% | 2% |
| BMW | 99% | 99% | 0% | 0% | 98% | 64% | 25% | 7% |
| Volkswagen | 77% | 94% | 3% | 0% | 90% | 71% | 20% | 7% |
| Mercedes-Benz | 94% | 100% | 8% | 0% | 100% | 77% | 22% | 0% |
| Tesla | 0% | 0% | 0% | 0% | 0% | 0% | 0% | 100% |
| Ford | 80% | 56% | 21% | 2% | 92% | 83% | 5% | 3% |
| GM | 37% | 91% | 54% | 9% | 74% | 75% | 0% | 1% |
| Stellantis | 13% | 10% | 22% | 1% | 96% | 45% | 15% | 3% |
There are several geographical trends hidden within this dataset. To make them more obvious, we color-coded the 14 automakers by their nationality.
Asian Automakers
Starting from the top of the graphic, we can see that Japanese automakers are big proponents of gasoline direct injection (GDI) engines, as well as continuously variable transmissions (CVT).
With a GDI engine, fuel is injected directly into the combustion chamber at high pressure. This is more precise than the traditional method known as port injection, which results in greater fuel efficiency and lower emissions.
CVT transmissions use pulleys instead of gears to improve fuel efficiency. CVTs are best paired with smaller, lower output engines, which may explain why Japanese automakers (who have a history of building smaller cars) have adopted them so widely.
Note that Toyota is listed as having 0% adoption of direct injection, but this isn’t exactly true. The automaker uses its D4-S system, which is a combination of both port and direct fuel injection.
South Korean automakers, on the other hand, have a more balanced technology profile, adopting a wider number of technologies, but each to a lesser degree.
German Automakers
German automakers are well-known for their expertise in building combustion engines, so it’s no surprise they use turbocharging and direct injection in nearly every model.
They’ve also heavily adopted high gear-count transmissions (7 or more gears), which can not only enable better fuel efficiency, but also faster acceleration. The downside to these transmissions is that they can be very heavy and complex.
Furthermore, German automakers utilize the auto start-stop feature in many of their vehicles, and are tied with Toyota in terms of hybrid adoption.
American & Other Automakers
Ford and GM’s technology profile is similar to the Germans, using turbocharging and direct injection combined with 7+ gear transmissions.
GM uses turbocharging less frequently, but stands out with its high usage of cylinder deactivation technology, at 54% of models. Referred to by GM as Active Fuel Management (AFM), this feature shuts down half of the engine’s cylinders during light driving.
GM is known for its small-block V8 engines, which can be had in many of the company’s models. Given the high cylinder count of a V8, AFM is a clever trick for improving fuel efficiency.
Stellantis, which is a merger between Italian-American Fiat Chrysler and French Peugeot, has not widely adopted many technologies except for the 7+ gear transmission.
Finally there’s Tesla, which does not use any of the aforementioned technologies due to it being a pure electric automaker.
Going The Way of the Dinosaur
The technologies shown in this infographic have helped to bring the average mpg of a new car to record highs in recent years.
Many of these innovations could become obsolete as automakers slowly phase out gasoline engines. In 2021, six major automakers including Ford, Mercedes-Benz, and GM pledged to phase out the sale of new gasoline and diesel-powered cars by 2040.
Other companies such as Porsche believe that the combustion engine still has a future, pointing to synthetic fuels as a means of significantly reducing CO2 emissions.


Green
Ranking the Top 15 Countries by Carbon Tax Revenue
This graphic highlights France and Canada as the global leaders when it comes to generating carbon tax revenue.


Top 15 Countries by Carbon Tax Revenue
This was originally posted on our Voronoi app. Download the app for free on iOS or Android and discover incredible data-driven charts from a variety of trusted sources.
Carbon taxes are designed to discourage CO2 emissions by increasing the cost of carbon-intensive activities and incentivizing the adoption of cleaner energy alternatives.
In this graphic we list the top 15 countries by carbon tax revenue as of 2022. The data is from the World Bank’s State and Trends of Carbon Pricing Report, published in April 2023.
France and Canada Lead in Global Carbon Tax Revenue
In 2022, the top 15 countries generated approximately $30 billion in revenue from carbon taxes.
France and Canada lead in this regard, accounting for over half of the total amount. Both countries have implemented comprehensive carbon pricing systems that cover a wide range of sectors, including transportation and industry, and they have set relatively high carbon tax rates.
| Country | Government revenue in 2022 ($ billions) |
|---|---|
| 🇫🇷 France | $8.9 |
| 🇨🇦 Canada | $7.8 |
| 🇸🇪 Sweden | $2.3 |
| 🇳🇴 Norway | $2.1 |
| 🇯🇵 Japan | $1.8 |
| 🇫🇮 Finland | $1.7 |
| 🇨🇭 Switzerland | $1.6 |
| 🇬🇧 United Kingdom | $0.9 |
| 🇮🇪 Ireland | $0.7 |
| 🇩🇰 Denmark | $0.5 |
| 🇵🇹 Portugal | $0.5 |
| 🇦🇷 Argentina | $0.3 |
| 🇲🇽 Mexico | $0.2 |
| 🇸🇬 Singapore | $0.1 |
| 🇿🇦 South Africa | $0.1 |
In Canada, the total carbon tax revenue includes both national and provincial taxes.
While carbon pricing has been recognized internationally as one of the more efficient mechanisms for reducing CO2 emissions, research is divided over what the global average carbon price should be to achieve the goals of the Paris Climate Agreement, which aims to limit global warming to 1.5–2°C by 2100 relative to pre-industrial levels.
A recent study has shown that carbon pricing must be supported by other policy measures and innovations. According to a report from Queen’s University, there is no feasible carbon pricing scenario that is high enough to limit emissions sufficiently to achieve anything below 2.4°C warming on its own.

-

 Maps2 weeks ago
Mapped: Average Wages Across Europe
-

 Money1 week ago
Which States Have the Highest Minimum Wage in America?
-

 Real Estate1 week ago
Ranked: The Most Valuable Housing Markets in America
-

 Markets1 week ago
Charted: Big Four Market Share by S&P 500 Audits
-

 AI1 week ago
The Stock Performance of U.S. Chipmakers So Far in 2024
-

 Automotive1 week ago
Almost Every EV Stock is Down After Q1 2024
-

 Money2 weeks ago
Where Does One U.S. Tax Dollar Go?
-

 Green2 weeks ago
Ranked: Top Countries by Total Forest Loss Since 2001