Politics
Chart: America’s Gold Plated Cabinet
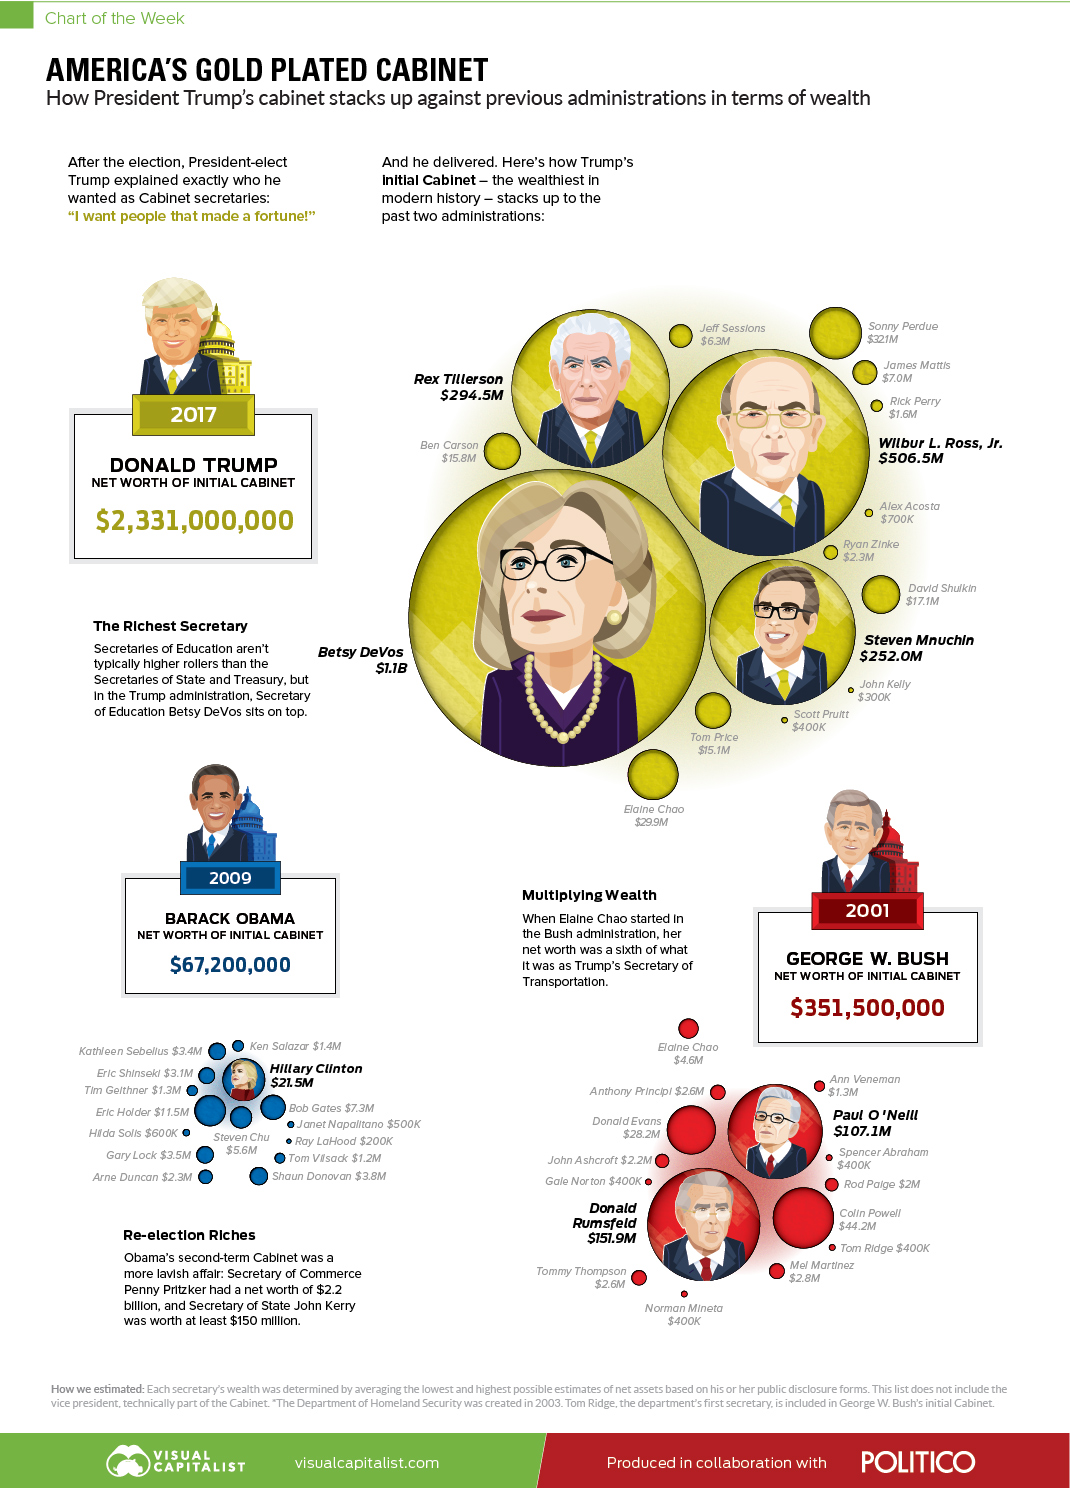
America’s Gold Plated Cabinet
The Chart of the Week is a weekly Visual Capitalist feature on Fridays.
When President Trump was elected to the Oval Office with a net worth in the billions, it was clear that this presidency would be unique.
Not only did he himself come a successful business background, but he wanted the people surrounding him to have similar backgrounds as well.
In 2016, the newly elected Trump was quoted as saying he wanted to have people in his cabinet that “made a fortune”, also stating that he was putting together “one of the great cabinets that has ever been assembled in the history of our nation.”
Comparing First-Term Cabinets
Today’s chart, which also appears on the back cover of Politico Magazine (web version found here), shows the wealth of initial cabinets put together by the last three presidents: Trump, Obama, and Bush.
Here’s how they stack up, in terms of aggregate wealth:
| Administration | Start of Initial Term | Cabinet Net Worth |
|---|---|---|
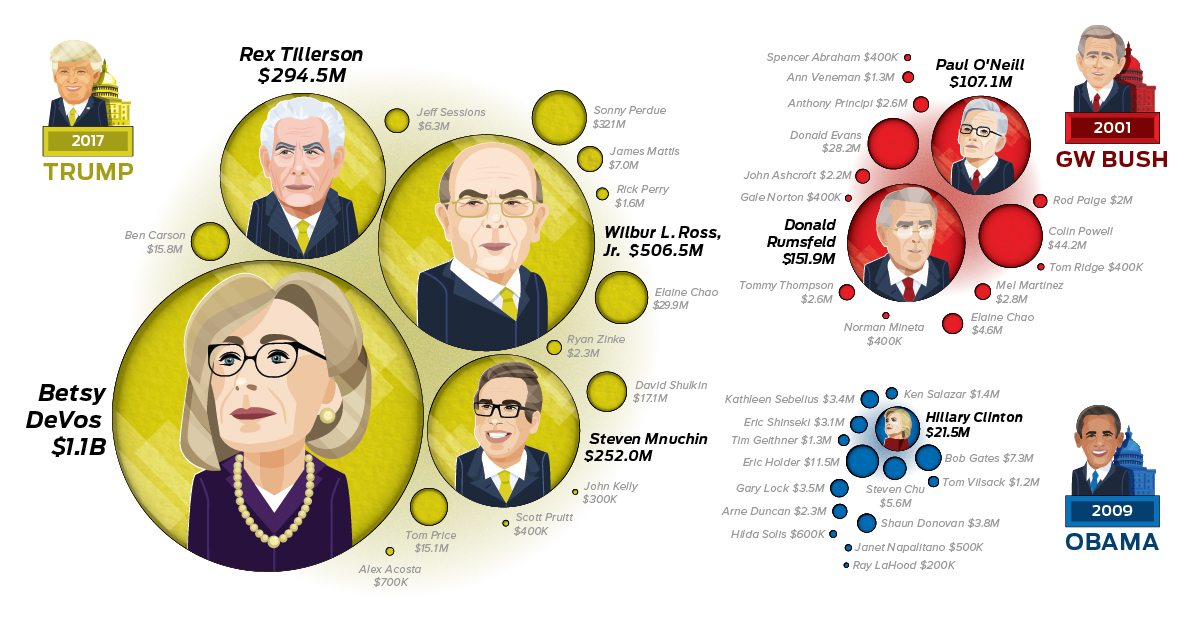
| Trump | 2017 | $2.33 billion |
| Obama | 2009 | $67 million |
| Bush | 2001 | $355 million |
Trump’s cabinet is worth a cool $2.33 billion – about 35x the size of Barack Obama’s initial cabinet, and 7x the size of George W. Bush’s first.
Interestingly, the top four people (in terms of wealth) are all in Trump’s:
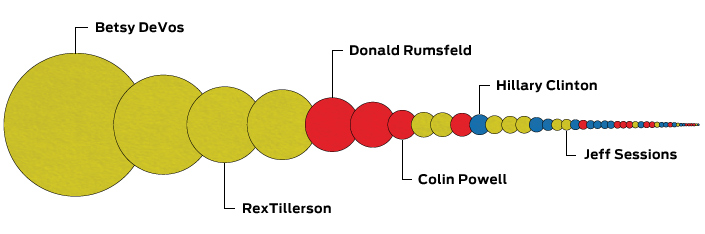
Betsy DeVos ($1.1 billion) sits atop as the wealthiest person in all three initial cabinets – and Wilbur Ross ($506.5 million), Rex Tillerson ($294.5 million), and Steve Mnuchin ($252.0 million) round out the other top spots.
Meanwhile, Donald Rumsfeld ($151.9 million) was the richest person outside of Trump’s cabinet.
Obama’s Second Term
While the comparisons in the chart are all for initial cabinets, it is worth noting that Obama’s second cabinet was not so modest.
He elected to bring in Penny Pritzker as the U.S. Secretary of Commerce, who was worth $2.2 billion – almost the combined net worth of Trump’s cabinet today!


War
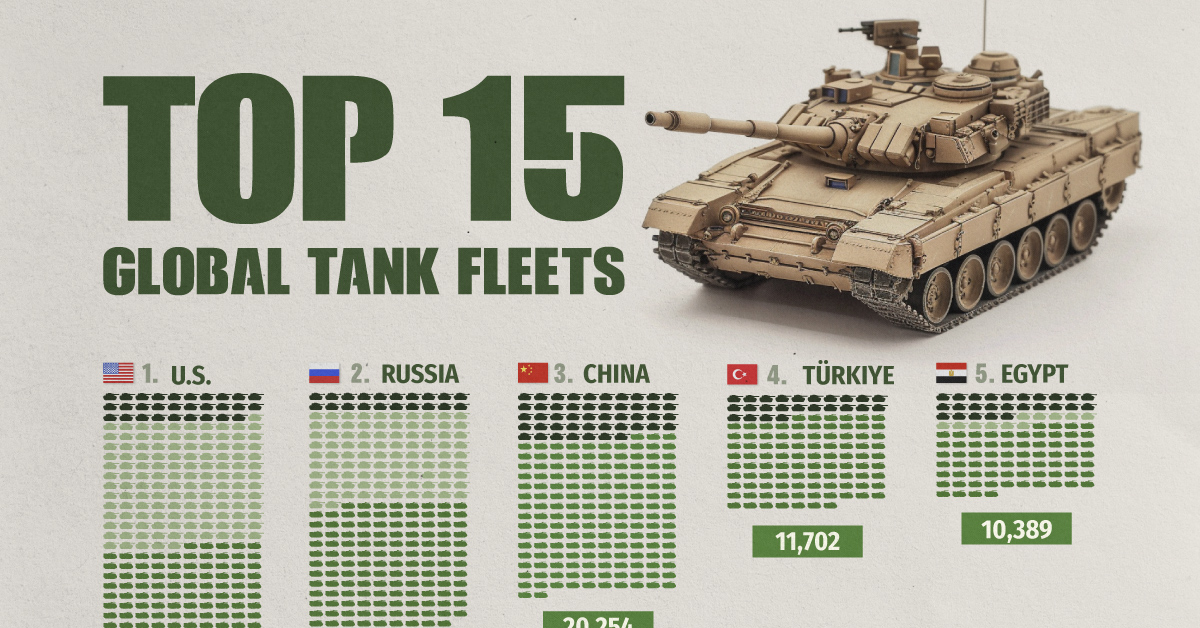
Visualized: Top 15 Global Tank Fleets
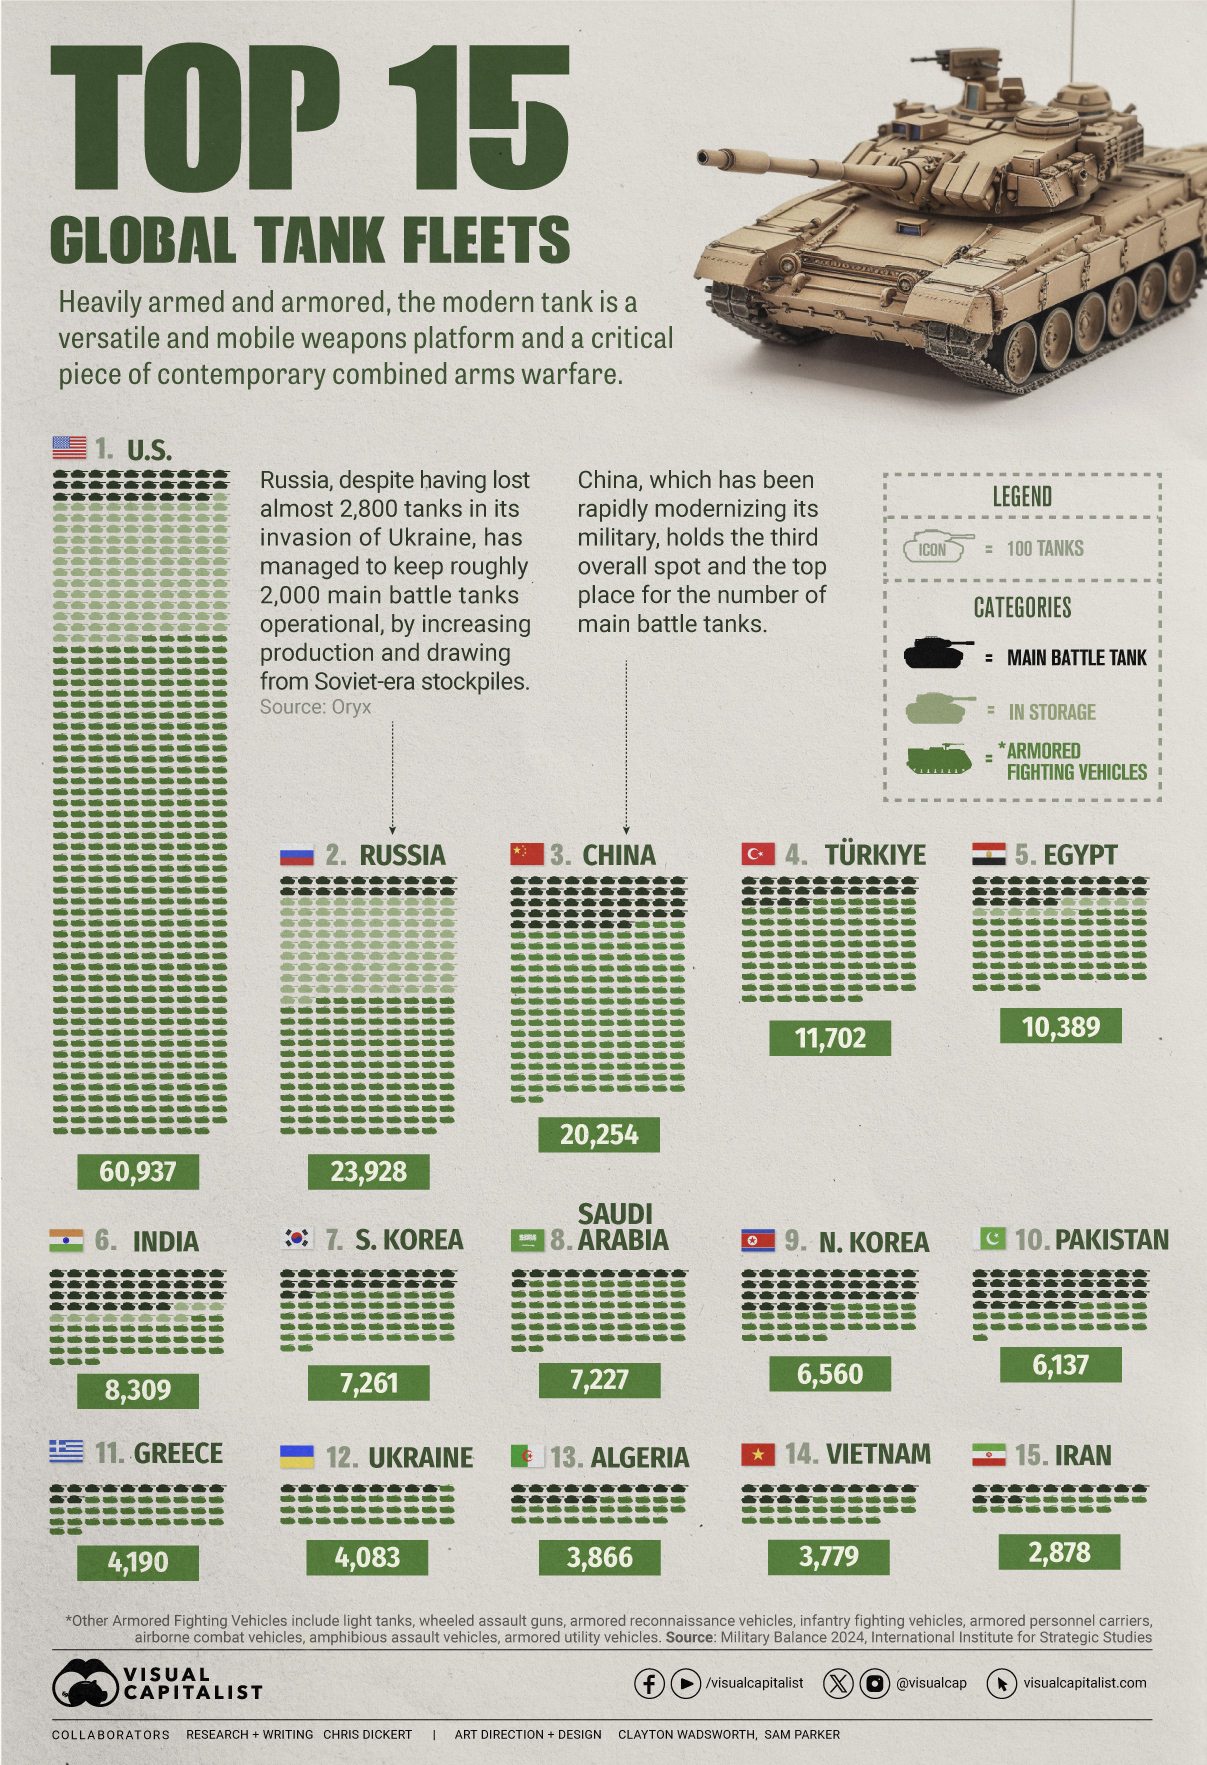
Heavily armed and armored, the modern tank is a versatile and mobile weapons platform, and a critical piece of contemporary warfare.
The Top 15 Global Tank Fleets
This was originally posted on our Voronoi app. Download the app for free on iOS or Android and discover incredible data-driven charts from a variety of trusted sources.
Heavily armed and armored, the modern tank is a versatile and mobile weapons platform, and a critical piece of contemporary warfare.
This visualization shows the top 15 global tank fleets, using data from the 2024 Military Balance report from the International Institute for Strategic Studies (IISS).
Let’s take an in-depth look at the top three fleets:
1. United States
As the world’s pre-eminent military power, it’s perhaps no surprise that the United States also has the largest tank fleet, by a wide margin.
In total, they have just over 45,000 armored fighting vehicles in operation, along with 2,640 main battle tanks (MBTs), and 12,800 vehicles in storage, of which 2,000 are main battle tanks.
| Category | Vehicles | Global rank |
|---|---|---|
| Main battle tanks | 2,640 | 4 |
| Armored reconnaissance | 1,745 | 1 |
| Infantry fighting vehicles | 3,262 | 3 |
| Armored personnel carriers | 10,644 | 1 |
| Amphibious assault vehicles | 1,401 | 1 |
| Armored utility vehicles | 28,445 | 1 |
| Storage | 12,800 | 1 |
| Total | 60,937 | 1 |
The U.S. is internalizing the lessons from the ongoing invasion of Ukraine, where Western-supplied anti-tank weapons and massed Ukrainian artillery have been cutting Russian tanks to pieces. As a result, the U.S. recently canceled an upgrade of the M1 Abrams in favor of a more ambitious upgrade.
Meanwhile, the U.S. is nervously eyeing a more confident China and a potential clash over Taiwan, where air and naval forces will be critical. However, a recent war game showed that Taiwanese mechanized ground forces, kitted out with American-made tanks and armored fighting vehicles, were critical in keeping the island autonomous.
2. Russia
According to Oryx, a Dutch open-source intelligence defense website, at time of writing, Russia has lost almost 2,800 main battle tanks since invading Ukraine. Considering that in the 2022 edition of the Military Balance, Russia was estimated to have 2,927 MBTs in operation, those are some hefty losses.
Russia has been able to maintain about 2,000 MBTs in the field, in part, by increasing domestic production. Many defense plants have been taken over by state-owned Rostec and now operate around the clock. Russia is also now spending a full third of their budget on defense, equivalent to about 7.5% of GDP.
At the same time, they’ve also been drawing down their Soviet-era stockpiles, which are modernized before being sent to the front. Just how long they can keep this up is an open question; their stockpiles are large, but not limitless. Here is what their storage levels look like:
| Category | 2023 | 2024 | YOY change |
|---|---|---|---|
| Main battle tanks | 5,000 | 4,000 | -20.0% |
| Armored reconnaissance | 1,000 | 100 | -90.0% |
| Infantry fighting vehicles | 4,000 | 2,800 | -30.0% |
| Armored personnel carriers | 6,000 | 2,300 | -61.7% |
| Total | 16,000 | 9,200 | -42.5% |
3. China
China holds the third overall spot and top place globally for the number of main battle tanks in operation. Untypically, the People’s Liberation Army has no armored vehicles in storage, which perhaps isn’t surprising when you consider that China has been rapidly modernizing its military and that stockpiles usually contain older models.
China also has one of the world’s largest fleets of armored fighting vehicles, second only to the United States. Breaking down that headline number, we can also see that they have the largest number of light tanks, wheeled guns, and infantry fighting vehicles.
| Category | Vehicles | Global rank |
|---|---|---|
| Main battle tanks | 4,700 | 1 |
| Light tanks | 1,330 | 1 |
| Wheeled guns | 1,250 | 1 |
| Infantry fighting vehicles | 8,200 | 1 |
| Armored personnel carriers | 3,604 | 5 |
| Airborne combat vehicles | 180 | 2 |
| Amphibious assault vehicles | 990 | 2 |
| Total | 20,254 | 3 |
This is equipment that would be integral if China were to make an attempt to reunify Taiwan with the mainland by force, where lightly armored mechanized units need to move with speed to occupy the island before Western allies can enter the fray. It’s worth noting that China also has one of the world’s largest fleets of amphibious assault vehicles.
End of the Tank?
Many commentators at the outset of Russia’s invasion of Ukraine, were quick to predict the end of the tank, however, to paraphrase Mark Twain, reports of the tank’s demise are greatly exaggerated.
With the U.S. and China both developing remote and autonomous armored vehicles, tanks could be quite different in the future, but there is nothing else that matches them for firepower, mobility, and survivability on the modern battlefield today.

-

 Business2 weeks ago
America’s Top Companies by Revenue (1994 vs. 2023)
-

 Environment1 week ago
Ranked: Top Countries by Total Forest Loss Since 2001
-

 Markets1 week ago
Visualizing America’s Shortage of Affordable Homes
-

 Maps2 weeks ago
Mapped: Average Wages Across Europe
-

 Mining2 weeks ago
Charted: The Value Gap Between the Gold Price and Gold Miners
-

 Demographics2 weeks ago
Visualizing the Size of the Global Senior Population
-

 Misc2 weeks ago
Tesla Is Once Again the World’s Best-Selling EV Company
-

 Technology2 weeks ago
Ranked: The Most Popular Smartphone Brands in the U.S.